Market Brief · by Aidan Sowa · October 5, 2026
Why Do Sources Disagree on the Median Elmhurst Sale? Reading a Wide Middle Range
Reading a Wide Middle Range for Elmhurst, IL, with each source dated and its limits noted, for owners weighing a listing against a direct sale.
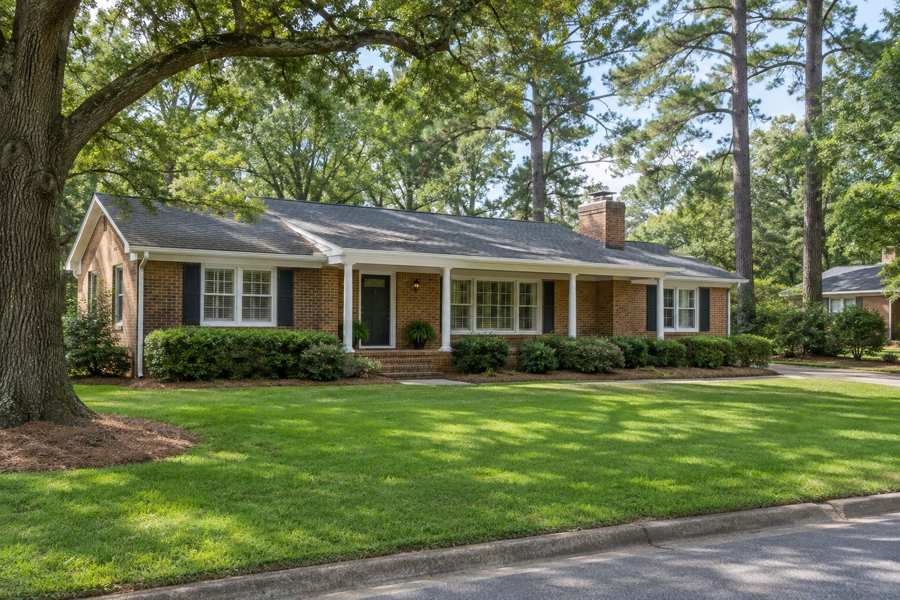
Why do three public sources put the median Elmhurst sale at $664,000, $702,148 and $720,000? A six-month study of 327 closings by Resideline gives the lowest of the three. Redfin's page for the three months to July 2026 gives the middle one. Realtor.com's page for June 2026 gives the highest. Each number is a real median of real sales, and an owner could quote any of them to a buyer without lying. They differ because they cover different months, different sets of homes and different ways of counting a sale.
The same three pages disagree on how long a home takes to sell. Realtor.com says the median is 29 days. Redfin says 44 days, and also says the average home goes pending in about 46. Resideline measured 40 days from listing to a signed contract and 9 more from contract to closing. A Zillow page says homes go pending in about 17 days. An owner who reads only one of them gets a confident answer that another page would contradict.
The spread inside the sales matters more than the gap between the medians. Resideline reports that the middle half of Elmhurst sales closed between $490,000 and $1,125,000, a band more than twice as wide at the top as at the bottom. This brief sets the sources side by side, shows where they conflict, adds Census facts about the postal area that includes Elmhurst and a regional series for the Chicago area, and then explains plainly what a private sale changes and what it does not.
Key Findings
- Realtor.com reported, with key indicators as of June 2026, a median listing price of $805,000 for Elmhurst (down 4.86% on the year and up 45.03% on three years), a median sold price of $720,000 (up 20% on the year and down 0.35% on three years) and $378 per square foot (up 3.55% and up 19.61%) (Realtor.com, Elmhurst housing market).
- The same Realtor.com page reported 151 homes for sale (down 4.96% on the year), a median of 29 days on market (down 7.14%), a sale-to-list ratio of 99%, 62 rental properties and a median rent of $2,985 a month (up 20.36%), and described Elmhurst as a hot, seller's market.
- Redfin reported a median sale price of $702,148 for the three months to July 2026 (up 6.4%), $360 per square foot (up 0.8%), 194 homes sold in July (up 8.6%), a median of 44 days on market against 47 a year earlier, a sale-to-list ratio of 100.6%, 42.9% of homes sold above list and 13.2% with price drops (Redfin, Elmhurst housing market).
- Resideline tracked 327 closings in six months with a median of $664,000 and $370 per square foot, a middle half between $490,000 and $1,125,000, a median of 40 days from listing to contract across 145 closings and 9 days from contract to closing across 83 (Resideline, Elmhurst market report).
- A property transfer page for Elmhurst reported 444 residential sales and a $659K median for 2026 to date, with 433 residential sales at a $663K median and 11 multi-family sales at $506K (MyTownView, Elmhurst sales).
- The Chicago area median days on market was 33 in May 2026 and 36 in September, and active listings rose from 12,574 to 15,929 over the same months (Realtor.com, days on market; Realtor.com, active listings).
Which of the three Elmhurst medians should an owner believe?
All three, in a sense, and none of them as a price for a particular house. The gap between the lowest and the highest is $56,000, which is 8.4% of the $664,000 figure. The middle figure sits $38,148 above the lowest and $17,852 below the highest. A gap that size is what one expects when three sources measure different months, so it is not evidence that any of them is wrong.
Start with the periods. Resideline covers six months of closings, which pulls in the cooler winter and spring sales along with the summer. Redfin covers three months to July. Realtor.com's page is for June alone. In a market where prices are rising, the longer the window, the lower the median, because older sales weigh in. The order of the three medians matches the order of the windows, from six months to three to one. That is this brief's inference, and the pages do not say it.
The year-on-year changes show how hard it is to compare them. Realtor.com says the sold median is up 20% on the year, which puts last June at about $600,000. A RealtyTrac page, which shows a table running from June 2025 to May 2026, lists a median sold price of $600.2K for June 2025 and $636.7K for May 2026, a rise of about 6%. The first agrees with the Realtor.com implied figure. The second is far below Realtor.com's June 2026 number of $720,000, though it is dated a month earlier and is a different measure. Redfin says its three-month median is up only 6.4%, from about $660,000.
So the honest range for the typical Elmhurst sale in mid-2026 runs from about $636,000 to $720,000, depending on who counts and when. A seller deciding what to ask should treat that as a band to test against comparable sales, and should not take the top of it as a promise. The question that matters is which of those sales looks like the house. The medians cannot answer it, but the next section shows why.
| Source and period | Measure | Value |
|---|---|---|
| Realtor.com, June | Median sold price | $720,000 (up 20%) |
| Redfin, three months to July | Median sale price | $702,148 (up 6.4%) |
| Resideline, six months | Median closing price | $664,000 (327 closings) |
| Property transfer page, 2026 to date | Residential median | $663,000 (433 sales) |
| Realtor.com, June | Median listing price | $805,000 (down 4.86%) |
| Redfin, three months to July | Sale-to-list ratio | 100.6% |
| Realtor.com, June | Sale-to-list ratio | 99% |
Source: Realtor.com, Redfin, Resideline, MyTownView and RealtyTrac as cited. The $56,000, the 8.4%, the $38,148 and $17,852 gaps, the implied June 2025 figure of about $600,000, the implied $660,000 and the range from $636,000 to $720,000 are this brief's arithmetic from stated figures. The explanation by window is this brief's inference. Commercial content; not independently verified.
What does a middle half from $490,000 to $1,125,000 tell an owner?
Resideline reports that the middle half of the 327 closings fell between $490,000 and $1,125,000. The band is $635,000 wide. The top of it is 2.3 times the bottom. The median of $664,000 sits about 27% of the way up the band, which means it is much closer to the bottom edge than to the top. A quarter of the sales, about 82 of the 327, closed above $1,125,000, and about the same number closed below $490,000. Resideline says it trimmed the distribution to the 5th through 95th percentile, so the most extreme sales are left out.
This is the clearest sign that Elmhurst is not one market. A town in which a quarter of sales close above $1.1 million and a quarter below $490,000 is a town of very different homes: older bungalows and ranches on standard lots, condominiums near the train, and large new houses on rebuilt lots. Resideline itself says the median is a weak anchor for any individual address and that comparable sales have to be matched tightly. That is the page's own advice, and it fits what the numbers show.
Source: Resideline as cited. The $635,000, the 2.3 times, the 27%, the figure of about 82 sales are this brief's arithmetic. The description of the kinds of homes is this brief's inference and not a statement of any source. Commercial content; not independently verified.
Do the days on market agree, from 17 to 46?
No, and the reason lies in what each source starts and stops counting. Realtor.com reports a median of 29 days on market for June, down 7.14% on the year, which puts last June at about 31 days. Redfin reports 44 days for the three months to July against 47 a year earlier, and says that the average home goes pending in around 46 days, while the most competitive homes sell for about 3% above list in about 29 days. Zillow's page says homes go pending in around 17 days, as updated on August 31, 2026 (Zillow, Elmhurst home values). Zillow's page also gives an average home value of $642,280, up 8.4%, which the page presents as a home value and not as a median of sales.
Resideline's measure is the most explicit. Across 145 closings, the median time from listing to a signed contract was 40 days. Across 83 closings, the median time from contract to closing was 9 days. The two counts are different sets of sales, because a sale is counted only when its own dates are known, so the medians cannot be added to give 49 days. Even so, it is a useful reminder that a sale has two clocks. The first runs while buyers are deciding and the second while the lender, the inspection and the title work are finishing.
For an owner, the number that matters is not the median but the wait for one's own house. A home that sits for 60 days is 'on the market' in every sense that a buyer's agent will notice, and a price cut will be visible on every listing site. The five benefits of selling off-market that Maison Off-Market offers are an answer to that exposure: privacy, with no showings and no neighbors talking about you selling, a closing date that can be flexible so there is time to find a new home, no commission costs, no closing costs, and no inspections or repairs.
Source: Realtor.com, Redfin, Resideline and Zillow as cited. The implied June 2025 figure of about 31 days and the sum of 40 and 9 are this brief's arithmetic. The reading of price drops and sales above list is this brief's inference. Commercial content; not independently verified.
What does the neighborhood table on the Realtor.com page add?
Realtor.com lists neighborhoods for Elmhurst, and the table is a good test of whether the town number can be broken down. Downtown Elmhurst has a median listing price of $702,450 and $424 per square foot, with a median rent of $3,045. West Village has a median listing price of $285,000 and $191 per square foot, and rent of $1,750. The Seminary District has a median listing price of $307,450 and $183 per square foot. The town figure is $805,000 and $378 per square foot.
The gap between $285,000 and $805,000 is far too large to be a difference between detached houses. Dividing each median price by its price per square foot gives a rough size of about 1,660 square feet for Downtown Elmhurst, about 1,490 for West Village and about 2,130 for the town. Those are medians divided by medians and are only a rough guide, but they suggest that the cheaper areas are made up of smaller homes, and probably more condominiums. That is an inference, and the page does not say what the homes are.
Downtown Elmhurst is the interesting row. Its median listing price is 12.7% below the town figure, but its price per square foot is 12.2% above it. Buyers pay more per foot for a smaller home near the center of town. The days on market there are 56, up 25.56% on the month and up 135.42% on the year, which puts last year's figure at about 24 days. The Seminary District, at 61 days, is up 105% on the year. West Village, at 23 days, is down 67.36% on the month. A market in which one area has slowed to 56 days while another sells in 23 is not one market with one clock.
| Neighborhood | Median listing price | Homes for sale | Median days on market |
|---|---|---|---|
| Downtown Elmhurst | $702,450 | 7 | 56 |
| West Village | $285,000 | 16 | 23 |
| Seminary District | $307,450 | 12 | 61 |
| Heritage District | not shown | 11 | not shown |
| Brook Forest | not shown | 9 | not shown |
| Elmhurst citywide | $805,000 | 151 | 29 |
Source: Realtor.com as cited. The sizes of about 1,660, 1,490 and 2,130 square feet, the 12.7%, the 12.2%, the implied last-year figure of about 24 days and are this brief's arithmetic on stated medians. The reading that the cheaper areas hold smaller homes is this brief's inference. Commercial content; not independently verified.
What does the Census say about the postal area that includes Elmhurst?
The American Community Survey profile for the postal area that includes Elmhurst counts 47,516 people and 18,589 housing units (Census Reporter, Elmhurst profile). Of the 17,598 occupied homes, 14,200 are owner-occupied, which is 80.7%, and 3,398 are rented. Vacant homes are 991, or 5.3%. The median household income is $147,566, the per capita income is $77,520, the median age is 42.4, households average 2.6 people and 63.7% of adults have a bachelor's degree or higher. The poverty rate is 3.3%, and 8% of residents had moved in the previous year.
The stock is old. The median year built is 1966, and 64.4% of the units, which is 11,979 of 18,589, were built before 1980. The 1950s are the largest decade, with 4,068 units, or 21.9%, ahead of the 2,660 built before 1940 and the 2,579 built in the 2000s. The newest three decades together, the 2000s, 2010s and 2020s, hold 4,572 units, or 24.6%. A town with two bulges, one of mid-century homes and one of recent ones, is a town in which older houses are being replaced. That is an inference, and the Census table does not show demolitions.
The Census median home value is $540,300, with a margin of error of $27,621, or 5.1%. It is lower than every market median above: Resideline's $664,000 is 22.9% higher, Redfin's $702,148 is 30.0% higher and Realtor.com's $720,000 is 33.3% higher. The survey asks owners to estimate their own homes' values, averages five years of responses from 2020 to 2024, and covers every owner, including those in older and smaller homes who have not sold. The gap is therefore not a contradiction. It is a reminder that what an owner believes, what the survey recorded and what a buyer pays are three different numbers.
Source: U.S. Census Bureau, American Community Survey 2020-2024, Realtor.com, Redfin and Resideline as cited. Shares, sums, gaps and ratios are this brief's arithmetic. The reading of rebuilding is this brief's inference. The postal area is not the same as the town boundary.
Do the sources even agree on how many homes sold?
They do not, and this is the biggest conflict in the data. Redfin says 194 homes sold in July, up 8.6% from 179 a year earlier. Resideline counted 327 closings in six months, which is about 54 a month. The property transfer page counts 444 residential sales for 2026 to date, which is about 49 a month over nine months. A RealtyTrac page gives 629 transactions over a year, about 52 a month. Three sources agree on about 50 a month, and one says 194. Redfin's figure is 3.6 times Resideline's monthly rate.
The listing count has a similar problem. Realtor.com shows 151 homes for sale, down 4.96% on the year, which puts last year's count at about 159. The RealtyTrac page states 458 current listings, 3.0 times as many, and its own table shows homes for sale rising from 53 to 455. The page is dated March 2025 by its metadata but carries a May 2026 column, so its dates cannot be trusted. Use it as a warning, not as a count.
The regional series is steadier because one source produces it. In the Chicago area, active listings rose from 12,574 in May to 15,929 in September 2026, a rise of 26.7%, while new listings fell from 9,700 to 8,962, a fall of 7.6%. The median listing price barely moved, from $389,000 to $389,450. The number of price reductions rose from 3,072 in February to 4,712 in June, a rise of 53.4% (Realtor.com, new listings; Realtor.com, price reductions; Realtor.com, median listing price). Elmhurst's median listing price of $805,000 is 2.0 times the regional figure for June of $394,500. More homes waiting and more price cuts across the region are the background against which Elmhurst's 29 to 44 days should be read. Readers comparing markets can also read the Glencoe brief and the Hinsdale brief.
Source: Redfin, Resideline, MyTownView, RealtyTrac, Realtor.com and the Federal Reserve Bank of St. Louis as cited. The monthly rates, the 3.6 times, the 3.0 times, the implied last-year count of about 159 and the percentage changes are this brief's arithmetic. The explanations of the conflict are this brief's hypotheses and are not confirmed.
What should an owner ask before trusting any median, and what does a private sale change?
Four questions will do more than any median. First, which months does the figure cover? Second, which homes does it include, and does it count condominiums and large new houses with older ranches? Third, how many sales are behind it? A number from 7 homes and a number from 327 should not be read in the same way. Fourth, does the source say what it is measuring, as Resideline does when it states the six-month window, the trimming and the smaller counts for days? A source that cannot answer those four questions should be treated as a hint.
A public listing meets the market as it is. The home is photographed, shown and negotiated. Buyers' inspections follow, and repairs are part of the bargaining. The fees are real, and they are arithmetic on the price, not a claim about any sale. At the $664,000 median, each 1% is $6,640, so 3% is $19,920 and 5% is $33,200. At $720,000, 1% is $7,200, 3% is $21,600 and 5% is $36,000. At the top of the middle half, $1,125,000, 1% is $11,250, 3% is $33,750 and 5% is $56,250. These amounts show what each percentage point of cost is worth on each price. They are not a prediction of what any seller would pay.
A private sale with Maison Off-Market changes the way the sale is run, and it does not change what the house is worth. There are no showings and no neighbors talking about you selling. The closing date can be flexible, so an owner has time to find a new home. There are no commission costs and no closing costs, and no inspections or repairs. An owner who values those things may accept a different price. An owner who wants every possible offer from a crowd may prefer a public listing. This brief does not claim that either route always yields more.
To compare, an owner can do three things. Take the three or four closest sales and note their dates, sizes and prices. Write down what a public sale would cost in fees, repairs and time, using the fee arithmetic above. Then ask what a private offer would be net of those items. Maison Off-Market speaks only to sellers. If you would like a private, no-obligation offer for an Elmhurst home, call 401-219-4207 or use the contact form on this site.
Source: Maison Off-Market and the sources above as cited. The fee figures are this brief's arithmetic and not claims about any sale.
Methodology and limitations
Prices, price per square foot, days on market, listing and rental counts, rents, the sale-to-list ratio and the neighborhood tables come from a national listing site page with key indicators as of June 2026 and charts through May 2026. Sale prices, homes sold, days on market, the share of sales above list and price drops come from Redfin's page for July 2026. Closings, the middle half of sales and the two clocks come from a market report by Resideline updated October 3, 2026, and county transfer counts come from a page whose stated window does not match its stated update date. The sources cover different periods and sets of homes and are not independent.
Census figures come from the American Community Survey 2020-2024 five-year estimates for the postal area that includes Elmhurst, through Census Reporter. Regional series are Realtor.com data published by the Federal Reserve Bank of St. Louis for the Chicago area, and the series name was checked against the series page. Percentages, gaps, ratios and fee amounts are this brief's own arithmetic and are labeled as such. Where a reading goes beyond what a page says, it is called an inference. Commercial pages are not independently verified.
Conclusion
The Elmhurst record shows three sold medians of $664,000, $702,148 and $720,000 that differ mostly because they cover different months, a middle half of sales from $490,000 to $1,125,000, days on market from 17 to 46 depending on the source, and a sale count that one source puts near 50 a month and another at 194. It describes a large town with several different markets in it.
It does not fix a price for any one home. The choice between a public listing and a private sale comes down to whether an owner would rather meet showings, inspections and a public clock, or sell quietly on a date that suits them. Maison Off-Market speaks only to sellers, and a conversation costs nothing.
Frequently Asked Questions
What is the median home price in Elmhurst?
It depends on the source and the period. Realtor.com reports a median sold price of $720,000 for June 2026, Redfin reports $702,148 for the three months to July, and Resideline reports $664,000 across 327 closings in six months.
How long do Elmhurst homes take to sell?
Realtor.com reports a median of 29 days on market for June. Redfin reports 44 days and an average of about 46 days to pending. Resideline reports a median of 40 days from listing to contract and 9 from contract to closing.
Do Elmhurst homes sell above asking?
Redfin reports a sale-to-list ratio of 100.6% and 42.9% of homes sold above list. Realtor.com reports a ratio of 99%. Both describe a market near the asking price on average.
How old are the homes in Elmhurst?
The Census median year built for the postal area that includes Elmhurst is 1966, and 64.4% of homes were built before 1980. The 1950s are the largest decade with 4,068 units.
What is the difference between a private sale and a public listing?
A private sale with Maison Off-Market has no showings, a flexible closing date, no commission costs, no closing costs and no inspections or repairs. A public listing exposes the home to a wider group of buyers. This brief does not claim either always gets a higher price.
Compare your options before committing. Request a written private offer for your property, with no obligation, then weigh it against your listing plan.
Sources
- Realtor.com, 2026. Elmhurst, IL Housing Market and Rental Trends. https://www.realtor.com/local/market/illinois/dupage-county/elmhurst.
- Redfin, 2026. Elmhurst Housing Market Trends. https://www.redfin.com/city/29479/IL/Elmhurst/housing-market.
- Resideline, 2026. Elmhurst, IL Housing Market 2026: What Homes Actually Sell For. https://resideline.com/blog/elmhurst-il-housing-market.
- MyTownView, 2026. Elmhurst, Illinois Home Prices and Sales. https://mytownview.com/illinois/dupage/elmhurst/real-estate/sales.
- Realtor.com, 2026. Housing Inventory: Median Days on Market in Chicago-Naperville-Elgin, IL-IN-WI (CBSA). https://fred.stlouisfed.org/series/MEDDAYONMAR16980.
- Realtor.com, 2026. Housing Inventory: Active Listing Count in Chicago-Naperville-Elgin, IL-IN-WI (CBSA). https://fred.stlouisfed.org/series/ACTLISCOU16980.
- RealtyTrac, 2026. Elmhurst IL Real Estate Market Trends and Home Values. https://www.realtytrac.com/market-trends/elmhurst-il/.
- Zillow, 2026. Elmhurst, IL Housing Market: Home Prices and Trends. https://www.zillow.com/home-values/4568/elmhurst-il/.
- U.S. Census Bureau, 2026. American Community Survey 2020-2024 five-year estimates, the Elmhurst area (via Census Reporter). https://censusreporter.org/profiles/86000US60126-60126/.
- Realtor.com, 2026. Housing Inventory: New Listing Count in Chicago-Naperville-Elgin, IL-IN-WI (CBSA). https://fred.stlouisfed.org/series/NEWLISCOU16980.
- Realtor.com, 2026. Housing Inventory: Price Reduced Count in Chicago-Naperville-Elgin, IL-IN-WI (CBSA). https://fred.stlouisfed.org/series/PRIREDCOU16980.
- Realtor.com, 2026. Housing Inventory: Median Listing Price in Chicago-Naperville-Elgin, IL-IN-WI (CBSA). https://fred.stlouisfed.org/series/MEDLISPRI16980.
Related research

Seller Guide · October 6, 2026
How to Prepare Point Pleasant Beach Rental Records Before Selling
Separate rental approval, income history and booked stays before comparing sale terms.

Seller Guide · October 6, 2026
How to Prepare Rumson Flood and Waterfront Records Before Selling
Separate flood disclosure, elevation, repairs and waterfront rights before comparing sale terms.

Seller Guide · October 6, 2026
How to Prepare Sarasota Condo Inspection and Reserve Records Before Selling
Separate building condition, reserve funding and resale documents before comparing sale terms.