Market Brief · by Aidan Sowa · October 5, 2026
Why Do Glencoe Homes Sell Above Asking When the Median Listing Is Far Above the Median Sale? Reading Sale-to-List and Days on Market
Reading Sale-to-List and Days on Market for Glencoe, IL, with each source dated and its limits noted, for owners weighing a listing against a direct sale.
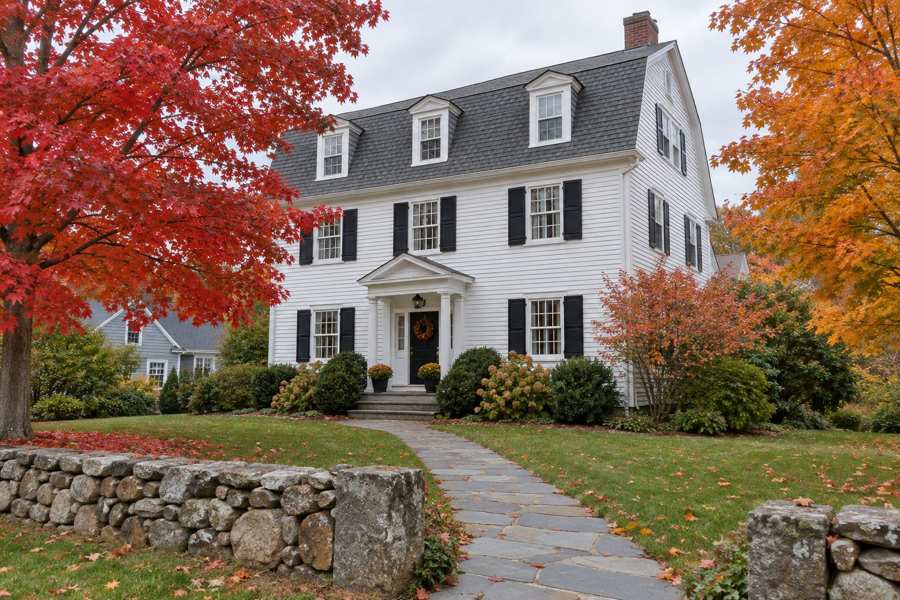
Why do Glencoe homes sell above asking when the median listing price is $714,500 higher than the median sale price? Realtor.com's page for Glencoe, with key indicators as of June 2026, shows a median listing price of $2,662,000 and a median sold price of $1,947,500. The same page shows a sale-to-list ratio of 106%, which means that the typical sale closed above its asking price. Redfin shows the same pattern: 105.6%, and 61.4% of homes sold above list.
The two facts fit together once the mix is clear. The listing median describes the homes that are for sale in a month, often the largest and most expensive, and the sold median describes the homes that closed, which include smaller houses that sold fast and above asking. A seller whose house is priced to the middle of the market is competing in the second group, and a seller who asks for the top is competing in the first.
This brief reads the Realtor.com page for Glencoe, the Redfin page for Glencoe, the Midwest Real Estate Data local market update for Glencoe and the Census profile side by side, tests the figures against one another, adds the Chicago area series and asks what they mean for an owner choosing between a public listing and a private sale.
Key Findings
- Realtor.com reported, with key indicators as of June 2026, a median listing price of $2,662,000 for Glencoe (up 11.15% on the year and up 50.01% on three years), a median sold price of $1,947,500 (up 26.79% and up 46.95%) and $471 per square foot (up 2.74% and up 12.95%).
- The same page reported 34 active listings (up 7.14% on the year and down 25% on three years), a median of 24 days on market (down 7.69% and down 31.43%), 11 rental properties, a median rent of $1,795 (down 10.03%) and a sale-to-list ratio of 106%, and called it a seller's market.
- Redfin reported a median sale price of $2,171,063 for the three months ending August 2026 (up 26.6%), $504 per square foot (up 5.0%), 45 homes sold in August (up 28.9%), an average of 37 days on market against 42, a sale-to-list ratio of 105.6% (up 1.2 points) and 61.4% of homes sold above list (up 7.2 points).
- Redfin also said that the average Glencoe home sells for about 4% above list price and goes pending in about 44 days, and that the most competitive homes sell for about 13% above list in about 16 days.
- A Midwest Real Estate Data update for July 2026 reported that for all properties in Glencoe, new listings changed by 26.3%, closed sales by 171.4% and the inventory of homes by 0.0%.
- In the Chicago area the median days on market was 33 in May 2026 and 36 in September (Realtor.com, days on market).
How can the median listing be $714,500 above the median sale?
The difference is $2,662,000 less $1,947,500, which is $714,500, or 26.8% of the listing median. Both medians are up on the year, the listing one by 11.15% and the sold one by 26.79%, and the sold figure is rising faster. Working back from the stated changes, the listing median was about $2.40 million a year ago and the sold median about $1.54 million, so the gap has narrowed from about $860,000.
A listing median is an average picture of what sellers hope for. A sold median is a picture of what buyers paid. In a market where 61.4% of homes sell above list, the sale price of a given house is often higher than its asking price. The difference between the two medians is therefore not a discount. It is a difference between which homes are in each group. Realtor.com's median listing price is taken from a small group of 34 homes, and a few very large houses can lift it, while the sold median is taken from every closed sale in the period.
Redfin gives a third figure, a median sale price of $2,171,063 over three months to August, 11.5% above Realtor.com's June figure of $1,947,500, from a different period and a different set of sales. The price per square foot is steadier: $471 on listings, up 2.74%, and $504 on sales, up 5.0%. The price of a foot of space on a sold house is 7.0% above the price on a listed one, which agrees with homes selling above list.
For an owner, the useful reading is that the headline listing median is the wrong anchor. An owner who looks at $2.66 million and expects it may be disappointed, and an owner who looks at $1.95 million and expects it may leave money. The price of any one house depends on the lot, the age, the school and the street, and the nearest recent sales give the best guide.
| Source and period | Measure | Value |
|---|---|---|
| Realtor.com, June | Median listing price | $2,662,000 (up 11.15%) |
| Realtor.com, June | Median sold price | $1,947,500 (up 26.79%) |
| Redfin, three months to August | Median sale price | $2,171,063 (up 26.6%) |
| Redfin, three months to August | Sale-to-list ratio | 105.6% |
Source: Realtor.com and Redfin as cited. The $714,500 gap, the 26.8%, the implied earlier medians of about $2.40 million and $1.54 million, the gap of about $860,000, the 11.5% and the 7.0% are this brief's arithmetic from the stated figures. The reading of the mix of homes is this brief's inference. Commercial content; not independently verified.
What does a sale-to-list ratio of 106 percent mean?
The ratio compares the price at which homes sold with the price at which they were listed. Realtor.com gives 106% for June, and Redfin gives 105.6% for the three months to August, up 1.2 points on the year. A ratio above 100% means that the typical home sold for more than its asking price. Redfin adds that 61.4% of homes sold above list, up 7.2 points on the year, so the share of homes selling below list is at most 38.6%.
The price paid above list is large. Redfin says the average Glencoe home sells for about 4% above list and goes pending in about 44 days, while the most competitive homes sell for about 13% above list in about 16 days. On a $2,000,000 asking price, 4% is $80,000 and 13% is $260,000. These are Redfin's averages and not claims about any particular sale. They show that in this market the first price is often a starting point for competing offers.
The speed is high. Realtor.com gives a median of 24 days on market, down 7.69% on the year and down 31.43% on three years, which implies about 26 days a year ago and about 35 days three years ago. Redfin gives an average of 37 days against 42 a year earlier. Both are well below the wait in many of the markets on this site, and both are consistent with a market in which a well-priced house goes under contract within a month.
The pattern repeats in the figures for the year. The sold median is up 26.79% and the number of sales in August is up 28.9%, so more homes sold at higher prices. A rise in both price and volume is typical of a market in which buyers are competing, and it explains why 61.4% of sales closed above list. If rates or buyers' budgets change, the share above list can fall quickly, as it can rise, and the 7.2 point gain on the year could reverse. This is the brief's reading of the pattern and not a forecast.
The supply is small. Realtor.com counts 34 active listings, up 7.14% on the year, which implies about 32 a year ago, and down 25% on three years, which implies about 45. Redfin counts 45 homes sold in August. If both figures described the same month, the stock would be under one month of sales, though they are from different months and sources, and this brief draws no conclusion from the ratio. The July update from Midwest Real Estate Data says closed sales rose 171.4% and the inventory of homes was unchanged on the year, which agrees in direction.
Source: Realtor.com, Redfin and the Midwest Real Estate Data update as cited. The 38.6%, the dollar amounts at 4% and 13%, the implied earlier days and counts and the remark on months of sales are this brief's arithmetic on stated figures and a $2,000,000 example, and are not claims about any sale. Commercial content; not independently verified.
Does the postal-area table describe Glencoe?
Realtor.com's Glencoe page lists no neighborhood medians. Its table of neighborhoods names Downtown Glencoe and Hubbard Woods, with median rents of $1,795 and $1,895 and no price or count. A seller who looks for a neighborhood figure for a street in Glencoe will not find one on this page.
The page also lists nearby postal areas with their own medians. The postal area that includes Glencoe has a median listing price of $2,299,000 at $471 per square foot, with 31 homes for sale, up 3.85%, and 10 rentals. Six neighboring areas have median listing prices from $679,000 to $1,972,500, and at least two of them have more than 100 homes for sale. Glencoe's postal area is the highest priced of the group, and it has the smallest count. That makes it a small, expensive pocket next to larger and cheaper markets.
The page's list of areas also makes a point about measurement. A median listing price taken from 31 homes is fragile, because a sale of two large lakefront houses or a handful of teardown lots changes it. The page's median of $2,299,000 for the postal area is $363,000 below the $2,662,000 it gives for the village, and the two figures sit side by side on one page, which shows how far a small sample moves. A seller reading either figure should treat it as a rough guide and not as a price, and should ask for the individual sales behind it, including the lot size, the age of the house and the date of each sale.
The comparison explains the buyers. A buyer with $1.5 million can look in several neighboring towns, and a buyer who wants Glencoe competes with a very small number of listings. With 31 or 34 homes for sale, a family that wants a particular school or a particular lakefront street has few choices, and that scarcity is the reason for sales above list. This is this brief's reading.
The rental figures show a small base as well. Realtor.com counts 11 rental properties, up 7.69% on the year and up 250% on three years, at a median rent of $1,795 that is down 10.03% on the year, which implies about $1,995 a year ago. A year of rent at $1,795 a month is $21,540, which is 1.1% of the median sold price. These are few homes, so the median rent can move a good deal on one lease.
| Area | Median listing price | Homes for sale | Median rent |
|---|---|---|---|
| Glencoe postal area | $2,299,000 | 31 | $1,795 |
| Highest neighbor | $1,972,500 | not shown here | $1,930 |
| Next-highest neighbor | $985,000 | not shown here | $4,123 |
| Lowest neighbor | $679,000 | 176 | $2,754 |
Source: Realtor.com page as cited. The page lists the postal areas by number, which this table omits; the neighbors are shown in order of price. The 1.1% and the implied rent of about $1,995 are this brief's arithmetic. The reading of scarcity and school choice is this brief's inference. Commercial content; not independently verified.
What does the Census say about an income that is capped?
The Census data is for the postal area that includes Glencoe, which is close to the village. It has 8,352 residents and 3,194 housing units, of which 2,851 are occupied and 343 are vacant, 10.7%. Owners hold 2,612 of the occupied homes, 91.6%, and renters 239, 8.4%. Households have 2.9 people on average, the median age is 44.9, and 88.5% of adults have a bachelor's degree or higher. Only 2.2% of people are below the poverty line.
The median household income is shown as $250,001. That is not a measured figure. It is the Census's top code, the highest value the published table reports, and it means that the true median is at or above $250,000 and the table cannot say by how much. Per capita income, at $147,290, is a measured figure and shows that incomes in the area are high even without the cap. A household earning at the cap can afford a house far above the owner-estimated median value of $1,392,900.
That value has a margin of error of $275,629, or 19.8%, which is very wide, because the area is small and its values are high. It is 28% below Realtor.com's sold median of $1,947,500 and 48% below the listing median. Owner-estimated values are lower than sales in a market that has risen, since an owner's estimate trails the market, and the margin is large, so this brief reads the comparison loosely.
The stock is old. The median year built is 1955, and 2,216 homes, 69.4%, were built before 1980, including 1,119, 35.0%, built before 1940. Only 794 homes, 24.9%, have been built since 1990. Mean travel time to work is 36.3 minutes, and 10.4% of people moved in the previous year. Old houses on established lots are what buyers often renovate or replace, and a seller of a house from the 1930s or 1950s gets paid for the lot and the location more than for the building.
Source: U.S. Census Bureau, American Community Survey 2020-2024, Realtor.com and Redfin as cited. Shares, gaps and sums are this brief's arithmetic. The explanation of the top code, the reading of owner-estimated values and the remark on renovation are this brief's reasoning and not statements of the Census.
What does the Chicago area series add, and what should an owner ask?
In the Chicago area, active listings rose from 12,574 in May 2026 to 15,929 in September (Realtor.com, active listings), an increase of 26.7%. New listings were 9,700 in May and 8,962 in September. Price-reduced listings rose from 3,072 in February to 4,712 in June (Realtor.com, price reduced listings), an increase of 53.4%.
The regional median listing price was $389,000 in May and $389,450 in September (Realtor.com, median listing price), a change of 0.1%. The median wait rose from 33 days to 36, an increase of 9.1%. The metropolitan market is gaining stock and price cuts, and Glencoe, with 34 homes for sale and 24 days on market, is not following it. The regional median is about one seventh of Glencoe's, so the two are different markets.
An owner can test any offer, public or private, with plain questions. What is the price, and is any part of it conditional on an inspection, a loan or the sale of another home? What will I take home after every charge? When will the sale close, and can the date move? Who pays for the repairs a buyer asks for?
A market that sells above list has more. If a public listing may draw several offers, what price would I need from a private buyer to be as well off, and what is the value to me of no showings, a fixed date and no repairs? Which recent sales are true comparables for my lot and my street, and what share of them closed above list? Is my price set for the 24 days of Realtor.com or the 44 days to go pending that Redfin gives? Readers comparing markets can also read the Wilmette brief and the Elmhurst brief.
Source: Realtor.com series published by the Federal Reserve Bank of St. Louis as cited. The 26.7%, 53.4%, 0.1% and 9.1% figures and the remark on one seventh are this brief's arithmetic. The comparison of the region and Glencoe and the questions are this brief's reasoning and not statements of any source.
What does a private sale change?
Maison Off-Market buys homes directly from their owners. It does not list a home, hold showings or put a home on a public listing. For a Glencoe owner, the five benefits are plain. There are no showings and no neighbors talking about the sale. The closing date can be flexible, which gives time to find a new home. There are no commission costs and no closing costs for the seller, and there are no inspections and repairs.
A little arithmetic shows what that is worth. Each 1% of a $1,947,500 sale is $19,475. A seller who gives up 3% gives up $58,425, and one who gives up 5% gives up $97,375. This brief does not claim that those are the costs of any sale, since the real figures depend on the agreement the seller signs. It also does not claim that a private sale beats a public one in a market where 61.4% of homes sell above list. A public listing can attract competing offers, and an owner should weigh that against what a private sale offers.
What a private sale offers is certainty and quiet. An owner who values privacy, a closing date of their choosing and freedom from showings, inspections and a repair list can compare the figure from a direct offer with what a public listing might bring after its costs. In a village of old houses, where 69.4% of the homes date from before 1980, the repair list from a buyer's inspector is often long.
Maison Off-Market speaks only to sellers. An owner who wants to see what a direct offer would look like can use the contact form below, or call 401-219-4207, and ask for a figure with no showings, no listing and no obligation.
Source: Maison Off-Market and the sources above as cited. The fee figures are this brief's arithmetic and not claims about any sale.
Methodology and limitations
Prices, price per square foot, days on market, listing and rental counts, rents, the sale-to-list ratio and the postal-area table come from a national listing site page with key indicators as of June 2026. Sale prices, homes sold, days on market, the share of sales above list and the average premium come from Redfin's page for August 2026, and the percentage changes for July come from a Midwest Real Estate Data update. The sources cover different periods and sets of homes and are not independently verified.
Age, tenure, vacancy, income, education, commuting and owner-estimated value come from the American Community Survey five-year estimates for the postal-code area that includes Glencoe, and the age of the stock from the 2020-2024 estimates. The household income figure is the survey's top code. Shares are calculated from published counts, and owner-estimated value carries a margin of error.
Days on market, active listings, median listing price and price reduced counts are Realtor.com series published by the Federal Reserve Bank of St. Louis for the Chicago metropolitan area. They describe the region and not the village. Implied earlier values are this brief's arithmetic. The brief makes no forecast and values no home.
Conclusion
The Glencoe record shows a listing median of $2,662,000 above a sold median of $1,947,500, a sale-to-list ratio of 106%, 61.4% of sales above list, 24 days on market and 34 homes for sale. It describes a very small, fast market in which many homes sell above asking and the lot, the street and the price decide how much.
It does not fix a price for any one home. The choice between a public listing and a private sale comes down to whether an owner would rather meet showings, inspections and a repair list, with the chance of competing offers, or take privacy, a flexible closing date, no commission, no closing costs and no inspections or repairs. To see what a direct offer would look like for your home, use the contact form below or call 401-219-4207.
Frequently Asked Questions
What is the median home price in Glencoe?
Realtor.com reports a median sold price of $1,947,500 and a median listing price of $2,662,000 for June 2026. Redfin reports a median sale price of $2,171,063 over three months to August.
Do Glencoe homes sell above asking?
Yes, on average. Realtor.com reports a sale-to-list ratio of 106% and Redfin reports 105.6%, with 61.4% of homes sold above list.
How long do Glencoe homes take to sell?
Realtor.com reports a median of 24 days on market. Redfin reports an average of 37 days, and about 44 days to go pending.
How many homes are for sale?
Realtor.com counts 34 active listings for June 2026.
Does a private sale always beat a public listing?
No. A public listing can attract competing bids. A private sale offers privacy, a flexible closing date, no commission, no closing costs and no inspections or repairs.
Compare your options before committing. Request a written private offer for your property, with no obligation, then weigh it against your listing plan.
Sources
- Realtor.com, 2026. Glencoe, IL Housing Market and Rental Trends. https://www.realtor.com/local/market/illinois/cook-county/glencoe.
- Redfin, 2026. Glencoe Housing Market Trends. https://www.redfin.com/city/7559/IL/Glencoe/housing-market.
- Midwest Real Estate Data, 2026. Local Market Update, July 2026: Glencoe. https://www.mredllc.com/statistics/documents/thing/LMUs/Glencoe.pdf.
- U.S. Census Bureau, 2026. American Community Survey 2020-2024 five-year estimates, the Glencoe area (via Census Reporter). https://censusreporter.org/profiles/86000US60022-60022/.
- Realtor.com, 2026. Housing Inventory: Median Days on Market in Chicago-Naperville-Elgin, IL-IN-WI (CBSA). https://fred.stlouisfed.org/series/MEDDAYONMAR16980.
- Realtor.com, 2026. Housing Inventory: Active Listing Count in Chicago-Naperville-Elgin, IL-IN-WI (CBSA). https://fred.stlouisfed.org/series/ACTLISCOU16980.
- Realtor.com, 2026. Housing Inventory: Price Reduced Count in Chicago-Naperville-Elgin, IL-IN-WI (CBSA). https://fred.stlouisfed.org/series/PRIREDCOU16980.
- Realtor.com, 2026. Housing Inventory: Median Listing Price in Chicago-Naperville-Elgin, IL-IN-WI (CBSA). https://fred.stlouisfed.org/series/MEDLISPRI16980.
Related research

Seller Guide · October 6, 2026
How to Prepare Point Pleasant Beach Rental Records Before Selling
Separate rental approval, income history and booked stays before comparing sale terms.

Seller Guide · October 6, 2026
How to Prepare Rumson Flood and Waterfront Records Before Selling
Separate flood disclosure, elevation, repairs and waterfront rights before comparing sale terms.

Seller Guide · October 6, 2026
How to Prepare Sarasota Condo Inspection and Reserve Records Before Selling
Separate building condition, reserve funding and resale documents before comparing sale terms.