Market Brief · by Aidan Sowa · October 5, 2026
Why Do Hinsdale Value Figures Run So Far Apart? Reading the Census, Zillow and Redfin Pages and the Rebuild Years
Reading the Census, Zillow and Redfin Pages and the Rebuild Years for Hinsdale, IL, with each source dated and its limits noted, for owners weighing a listing against a direct sale.
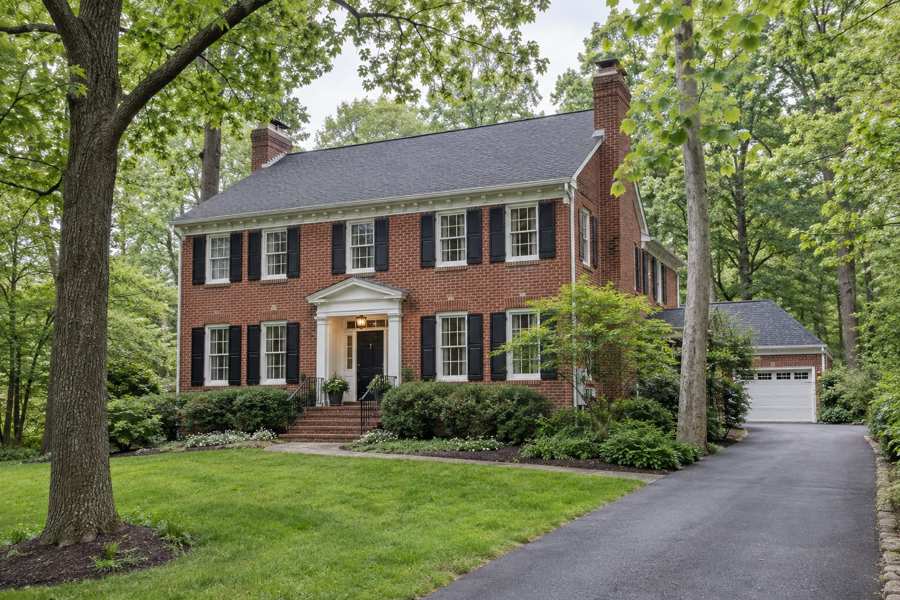
Why do Hinsdale value figures run from $1,032,800 to $1,650,000? Because each page measures something different. The Census median owner value for the postal area that includes Hinsdale is $1,032,800, with a margin of error of $72,260. Zillow's page showed a typical value of $1,202,422 in February 2026. Redfin's page shows a median sale price of $1,548,975 for the three months to August 2026, up 10.0%. Realtor.com shows a median sold price of $1,650,000 for August 2026, up 12.09%. The highest figure is 1.60 times the lowest, a ratio computed here, and none of them is wrong.
The pages also disagree on speed. Redfin shows a median of 48 days on market, and in the same block says the average home goes pending in around 63 days. Realtor.com shows 31 days. A brokerage report built on MRED sales data for the trailing twelve months to February 2026 shows 40 days. A market report from another brokerage says the town behaves like two markets, one below about $2 million and one above it. This brief sets out each page's figure, its date and what it measures.
Maison Off-Market speaks only to sellers. In the Census postal area that includes Hinsdale, 88.4% of the 6,042 occupied homes are owned, 82.7% of the 6,568 homes are detached houses and 29.9% were built since 2000, which fits the pages' talk of rebuilding. This brief takes the Census value, tenure and age cuts and a permit page. The last section sets out what a private sale changes for an owner.
Key Findings
- Redfin's page showed a median sale price of $1,548,975 for the three months to August 2026, up 10.0%, $421 per square foot, up 16.1%, 91 homes sold in August, up 3.7%, and a median of 48 days on market against 53 a year earlier (Redfin, Hinsdale housing market).
- Realtor.com's page, with indicators as of August 2026, showed a median sold price of $1,650,000, up 12.09%, a median listing price of $1,586,750, 68 active listings, down 12.16%, a median of 31 days on market and $409 per square foot (Realtor.com, Hinsdale housing market).
- A brokerage report built on MRED data, last updated June 2026, showed trailing twelve month figures to February 2026 for the postal area: a detached median of $1,425,000, down 1.4%, an average of $1,670,551, a list-to-sale ratio of 98.9% and 40 days on market, with an attached median of $580,000 (Brokerage report, Hinsdale home prices).
- A second brokerage's mid-2026 update said the town behaves like two markets, competitive below about $2 million and more selective above it, with roughly five to six months of supply, a sale-to-list ratio near 96% and more than 25% of homes rebuilt (Brokerage report, Hinsdale market update).
- The Census postal area that includes Hinsdale has 6,568 housing units, 88.4% of occupied homes owned, 82.7% of homes detached, a median household income of $249,200, a median rent of $1,955 and a median owner value of $1,032,800, plus or minus $72,260.
Why do the Hinsdale medians differ so much?
Start with what each figure counts. The Census value is what owners say their home would sell for, averaged over five years of surveys to 2024 for the whole postal area. Zillow's typical value is a modeled index of all homes, updated on February 28, 2026, which makes it seven months old beside the August pages. Redfin's median is a three-month median of recorded sales. Realtor.com's is a median of sold prices for one month. The MRED report is a twelve-month median of detached sales only. A seller comparing them is comparing five different things.
The Census figure is the lowest for a reason. At $1,032,800, it is 27.5% below the MRED detached median of $1,425,000, and the detached median is 1.38 times the Census value, computed here. Owners' estimates and five-year averages lag a market that Redfin says rose 10.0% in a year, and the Census estimate also includes condominiums, which the MRED report puts at a $580,000 median. The margin of error of $72,260 is 7.0% of the estimate, so the Census value is reasonably firm for what it measures.
The sale pages are close to each other but not the same. Realtor.com's $1,650,000 is 6.5% above Redfin's $1,548,975, computed here, and it covers one month where Redfin covers three. Realtor.com's median listing price, $1,586,750, is 3.8% below its median sold price, which means homes that sold in the month were priced above the homes still listed. That can happen when the biggest homes sell and the remaining listings are smaller, and it is an inference, since the page does not say.
Direction differs too, and the windows explain it. Redfin shows prices up 10.0% and the MRED report shows the detached median down 1.4%. The Redfin figure compares three months to August 2026 with the same months a year earlier, and the MRED figure compares twelve months to February 2026 with the twelve before. A brokerage blog from April 2026 quotes a Redfin median of $951,250, which is 38.6% below today's Redfin page, computed here. That older figure probably counted condominiums and townhomes too, since a mid-2026 report puts the all-property median at about $951,000, which is an inference. The lesson is to read the date and the home type before the number.
A data page adds a ZIP-level view. It shows a median home value of $1,251,000 for May 2026, up 8.8%, a single-family value of $1,353,000 and a condominium value of $554,000, with 75 listings and 5.0% of listings reduced (Data page, Hinsdale postal area). Its median listing price is $1,840,000, up 17.0%, which is 16.0% above Realtor.com's city figure, computed here. That page's rent figures are for a postal area and not a village, and its demographic block is from a 2023 survey that it says shows a population decline of 1.7% over five years.
| Source | Figure | What it measures |
|---|---|---|
| Census Reporter | $1,032,800 | Median owner value, five-year estimate; margin plus or minus $72,260 |
| Zillow | $1,202,422 | Typical value, as of February 28, 2026 |
| Data page | $1,251,000 | Median home value, May 2026 |
| MRED report | $1,425,000 | Detached median, twelve months to February 2026 |
| Redfin | $1,548,975 | Three-month median sale price to August 2026 |
| Realtor.com | $1,650,000 | Median sold price, August 2026 |
Sources as cited. The windows, home types and measures differ and the figures are not directly comparable. Commercial content; not independently verified.
How fast do Hinsdale homes sell, and does price tier change it?
The clocks range from 31 to 68 days. Realtor.com shows a median of 31 days, down 32.43% from a year earlier. The Redfin page shows 48 days against 53, and its text says the average home goes pending in around 63 days and sells for about 3% below list. Those two Redfin figures appear in the same page and measure different things, one the time to sale as a median and the other the time to pending as an average, so neither contradicts the other. An index page shows an average of 68 days from active listings, which is probably a measure of how long current listings have been up and not of how long sales took, an inference.
Prices relative to list tell a more cautious story. The MRED report shows 98.9% for detached homes and the second brokerage's report says near 96%. A blog from April 2026 quotes Redfin at 96.1%, with 22.2% of homes selling above list and 43 days to pending. The spread of 2.8 points between the first and third is computed here. At a $1,548,975 price, each point of list price is $15,490, so the gap between 98.9% and 96.1% is about $43,370 on that price, computed here. The sources do not agree on the sale-to-list ratio and a seller should ask which sales feed it.
The two-markets claim is the most useful. The second brokerage says homes below about $2 million are competitive and often draw multiple offers, while the $2 million and higher segment has a smaller buyer pool and longer timelines. The MRED report says homes above $2.5 million are fewer than 10 to 15 sales a year, which it says can move a monthly median. Realtor.com's median listing price of $1,586,750 sits below $2 million. A seller above that line should expect the average clock to understate how long a sale could take, which is an inference from the brokerages' descriptions, since no page gives days by price band.
Inventory is small. Realtor.com counts 68 active listings and the index page 49, of which 38 are single-family homes, 5 are condominiums and 2 are townhouses, with 33 priced at $1 million or more, 67.3% of the 49, computed here. Those bands sum to 49 only with a blank band for $750,000 to $1 million, which the page leaves empty, so the figure is as printed. The second brokerage's five to six months of supply sits between a buyer's and a seller's market. With fewer than 70 homes listed and a median sale price above $1.5 million, a few sales move every statistic.
The MRED report also describes what each budget buys. Below $600,000 it says the market is almost all attached homes, from $1 million to $1.5 million it describes the core detached market, and from $1.5 million to $2.5 million it describes larger lots and new or heavily renovated homes. Its figures show a $245,551 gap between its median and average, the average being 17.2% higher than the median, computed here, because a few sales above $3 million pull the average up. The brokerage says location in the village, school assignment, lot and finish can move two similar homes $200,000 apart. These are the brokerage's claims.
How much of Hinsdale has been rebuilt, and what do permits show?
The second brokerage calls Hinsdale the teardown epicenter and says over 25% of homes have been rebuilt, supported by high land values and limited new construction. It adds that a tired house on a premium lot may still be expensive because a buyer is paying for land. The page gives no source for the 25%, so this brief treats it as the brokerage's claim. The Census gives a rough check. In the postal area that includes Hinsdale, 1,967 homes were built since 2000, 29.9% of 6,568, computed here. That includes new subdivisions and the part of the postal area outside the village, so it is a ceiling for rebuilds and not a count of them.
The Census also shows an older stock under the new homes. The median year built is 1981 and 993 homes, 15.1%, date from 1939 or earlier, the second largest of the ten decades after the 2000s, which hold 1,182. Homes built before 1980 number 3,233, 49.2%. A postal area with that many homes from before the war and 1,182 from the 2000s has two housing stocks, and which one a seller owns changes what a buyer is paying for, the house or the lot.
The index page offers a permit view. It says the village issued 1,450 permits on record since 2009, with 295 issued in the last 12 months, a median project value of $13,429 and a total construction value of $50,038,201. The yearly chart on the page ends at 2023, with 295, and lists years that sum to 839, not 1,450, so the page's own history is incomplete and its last 12 months appear to be the 2023 bar, which is an inference. The average value is $169,621 a permit, computed here, 12.6 times the median, which means a few large projects carry the total.
What does that mean for a seller? The pages suggest that buyers of larger homes often want new or fully renovated product, and that an older home is priced against the land. A seller of an older home has to decide whether to renovate, sell as a teardown or sell to a buyer who will do either. That is a decision about cost, time and risk that the pages do not price. The brokerage that advises sellers says buyers are selective about price, condition and presentation, which is its claim and not a measured fact (Brokerage blog, Hinsdale luxury trends).
That blog also reports on who buys. Citing Redfin search data for October to December 2025, it says 82% of Hinsdale homebuyers searched to stay within the metro area and 3% searched into Hinsdale from outside metros. It says those are searches and not completed moves. The page's Census figures are for the village: a median age of 41.7, 89.9% owner-occupied homes, 2.96 people per household and 80.8% of adults with a bachelor's degree or higher. The 89.9% is close to the postal area's 88.4% owner share, a 1.5 point gap computed here.
What does the Census say about owners, tenure and building types near Hinsdale?
The Census postal area that includes Hinsdale has 6,568 housing units and 18,056 residents, so each occupied home averages 3.0 residents, computed from 18,056 and 6,042. By building type, 5,431 homes are detached houses, 82.7%, and 514 are attached, 7.8%. Buildings of five or more units hold 583 homes, 8.9%, and buildings of 20 or more hold 399, 6.1%. Another 24 homes are in two-to-four-unit buildings, 16 are mobile homes and none are boats or vans. Compared with a city postal area, this is a house town.
Owners dominate. Of 6,042 occupied homes, 5,343 are owned, 88.4%, and 699 are rented, 11.6%. The median household income is $249,200, and the median rent is $1,955. Realtor.com's median rent for the village is $4,975, 2.5 times the Census figure, computed here, and that page's one-year change of 126.14% shows how little a 13-home rental market tells. The Census rent covers 699 renter households over five years, and the page figure covers 13 current rental listings.
When did owners move in? The Census shows 72 owner households arrived in 2023 or later, 966 in 2020 to 2022 and 2,011 in 2010 to 2019, so 3,049 owner households, 57.1%, moved in since 2010, computed here. Owners who arrived from 2000 to 2009 number 1,114, 20.8%, and those who arrived in 1999 or earlier number 1,180, 22.1%, of whom 583 arrived in 1989 or earlier. Those 583 households, 10.9% of owners, have held their homes at least 35 years, a computed figure. They are the owners most likely to hold a home that is well below the price of a rebuilt neighbor.
Vacancy is 526 homes, 8.0%, of which 97 are for sale, 121 sold and not yet occupied, 168 seasonal and 140 other. The 121 sold-but-not-occupied homes are 23.0% of the vacant stock, and the 97 for sale are 18.4%, computed here. The Census counts a home as for sale on the survey day and averages five years, so the 97 does not measure inventory today. Realtor.com's 68 active listings and the index page's 49 are the live counts.
The index page's own Census block is the weakest. It shows a median household income of $250,001, which is a top-coded figure, and a median commute of 5382 minutes, which is clearly an error. It shows a Census median home value of $962,700 against $1,032,800 on the five-year release used here. This brief takes the figures from the release it cites, and it is a reminder that aggregator pages repeat and mis-scale government data. Readers comparing markets can also read the Elmhurst brief and the Lincoln Park brief.
Source: Census Reporter, American Community Survey 2020-2024 five-year estimates, tables B25024, B25003, B25038, B25004, B25034, B25077, B25064 and B19013. Percentages and ratios are this brief's arithmetic.
What should an owner ask, and what does a private sale change?
The first question is which Hinsdale the home is in. A condominium in the village core, a house north of the tracks near the station, a 1950s ranch on a large lot and a rebuilt home on a new lot do not share a median, a buyer or a clock. A seller should ask for closed sales of the same type, size and lot from the last twelve months, with the days to contract, the first ask and the final price. In a village that sold 91 homes in August, a handful of comparable sales is a real sample.
The second question is what a number measures. Ask whether it is a value, a sale price or a list price, a median or an average, one month or twelve, detached homes or all homes. The pages above differ on every one of those points, and a seller who reads $1,650,000 as the price of a typical home will overshoot the Census value by 59.8% and the MRED detached median by 15.8%, computed here.
The third question is the cost of selling, and the arithmetic is simple. Each 1% of $1,425,000 is $14,250. At 3% the figure is $42,750 and at 5% it is $71,250. At $1,548,975, each 1% is $15,490, 3% is $46,469 and 5% is $77,449. At $1,650,000, each 1% is $16,500, 3% is $49,500 and 5% is $82,500. These illustrate the size of each percentage point and are not quotes of any rate a seller would be charged. No page in this brief names a Hinsdale commission rate, and the medians are not the price of any one home.
The fourth question is what a listing exposes. A public listing runs showings through an owner's home, and with a median of 31 to 63 days the home is on view to neighbors, and to every buyer's agent, for weeks. A well-known village has neighbors who talk. A private sale has no showings and no neighbors talking about a sale, and for an owner with an older home, it also avoids a debate over what a buyer's inspector will find.
The benefits are plain. Maison Off-Market buys luxury homes and estates directly from their owners and speaks only to sellers. A private sale has no showings. It allows closing dates that give a seller time to find a new home. It has no commission costs and no closing costs, and it avoids inspection repairs, which matters in a postal area where 49.2% of homes predate 1980, though the Census says nothing about the condition of any one house. The company does not say that a private sale always beats a public listing, and in a town where one page shows $1,032,800 and another $1,650,000, an owner is right to ask what each route yields. If you would like a private, no-obligation offer for a Hinsdale home, call 401-219-4207 or use the contact form on this site.
Methodology and limitations
Each page's date, title and place were read before use. The Zillow figure is dated February 28, 2026 and is stale beside the August pages. The Redfin page's 48 days and 63 days measure different things. The MRED report is a trailing twelve month figure to February 2026 for detached homes. The brokerage claims about two markets, rebuilt homes and buyer behavior were not checked against sales records, and the 25% rebuilt figure has no source on its page. The index page's permit history is incomplete and its Census block has errors. The Census figures are five-year estimates for a postal area that is larger than the village. Percent changes were taken as printed, and ratios and sums are this brief's arithmetic.
Conclusion
The Hinsdale record shows value figures from $1,032,800 to $1,650,000 that differ because they measure different things, clocks from 31 to 68 days, and a stock where 29.9% of homes in the postal area date from 2000 or later and 49.2% from before 1980. The useful number for an owner is a closed sale of the same type and lot, not a median.
Frequently Asked Questions
What is the median home price in Hinsdale, Illinois?
Pages differ by what they measure. Redfin shows $1,548,975 for the three months to August 2026, Realtor.com shows $1,650,000 for August 2026 and an MRED report shows a $1,425,000 detached median for the twelve months to February 2026.
How long do homes take to sell in Hinsdale?
Realtor.com shows a median of 31 days, Redfin shows 48 days with about 63 days to pending, and the MRED report shows 40 days. A brokerage says homes below about $2 million sell faster than the estate segment.
Is Hinsdale a teardown market?
One brokerage calls it the teardown epicenter and says over 25% of homes have been rebuilt, without a source. The Census shows 29.9% of homes in the postal area were built since 2000, which includes more than rebuilds.
What kinds of homes are in the Hinsdale postal area?
In the Census postal area that includes Hinsdale, 82.7% of homes are detached houses, 88.4% of occupied homes are owned and 49.2% were built before 1980.
Can I sell my Hinsdale home privately?
Yes. Maison Off-Market buys luxury homes and estates directly from their owners with no showings, flexible closing dates, no commission costs, no closing costs and no inspections or repairs. Call 401-219-4207 or use the contact form.
Compare your options before committing. Request a written private offer for your property, with no obligation, then weigh it against your listing plan.
Sources
- Redfin, 2026. Hinsdale, IL Housing Market. https://www.redfin.com/city/29486/IL/Hinsdale/housing-market.
- Realtor.com, 2026. Hinsdale, IL Housing Market and Rental Trends. https://www.realtor.com/local/market/illinois/dupage-county/hinsdale.
- Brokerage report, Hinsdale home prices, 2026. Hinsdale IL Home Prices: What Homes Cost in 2026. https://mikebergrealtor.com/hinsdale-il-home-prices/.
- Brokerage report, Hinsdale market update, 2026. Hinsdale Real Estate Market Update 2026: A Tale of Two Markets. https://chicagoestatesco.com/hinsdale-real-estate-market-update/.
- Data page, 2026. Hinsdale, IL Home Prices, Rental Trends, Listings and Demographics. https://www.prop-metrics.com/zip/60521.
- Brokerage blog, Hinsdale luxury trends, 2026. Current Hinsdale Luxury Home Trends for Sellers. https://deidrerudich.com/blog/hinsdale-luxury-home-market-trends-for-sellers.
Related research

Seller Guide · October 6, 2026
How to Prepare Point Pleasant Beach Rental Records Before Selling
Separate rental approval, income history and booked stays before comparing sale terms.

Seller Guide · October 6, 2026
How to Prepare Rumson Flood and Waterfront Records Before Selling
Separate flood disclosure, elevation, repairs and waterfront rights before comparing sale terms.

Seller Guide · October 6, 2026
How to Prepare Sarasota Condo Inspection and Reserve Records Before Selling
Separate building condition, reserve funding and resale documents before comparing sale terms.