Market Brief · by Aidan Sowa · October 5, 2026
Why Are Rockledge Active Listings Falling Fast While Prices Barely Move? Reading Redfin, Realtor.com, Zillow and the Census Stock of Homes
Reading Redfin, Realtor.com, Zillow and the Census Stock of Homes for Rockledge, FL, with each source dated and its limits noted, for owners weighing a listing against a direct sale.
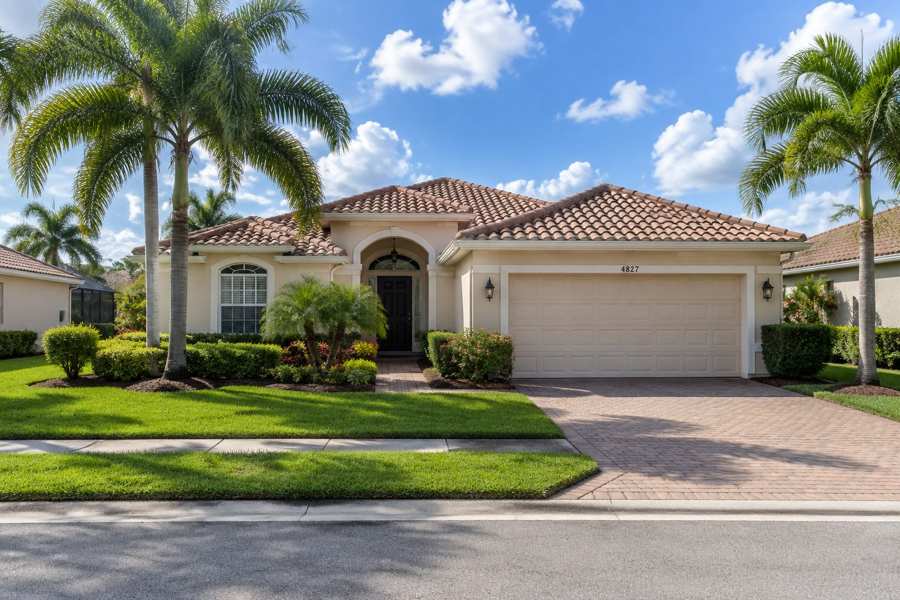
Why are Rockledge active listings falling fast while prices barely move? The pages suggest that fewer sellers are listing, not that buyers are paying more. Realtor.com's page for the postal area that includes Rockledge, for September 2026, shows 277 active listings, down 27.08% in a year, a median listing price of $386,250, down 1.08%, and a median of 64 days on market. Redfin's page for the same area, for the three months ending August 2026, shows a median sale price of $389,831, down 2.5%, and a median of 49 days on market against 59 a year earlier.
The picture is not a hot one. Redfin's sale-to-list ratio is 97.6%, only 13.0% of homes sold above list, and 36.1% had price drops. Zillow's page for Rockledge shows a home value index of $397,226, down 1.5%, but it was last updated on April 30, 2026, so it is the oldest figure here and is read with care. The Census adds a different feature: of 19,671 housing units, 1,536, or 7.8%, are held for seasonal use.
Maison Off-Market speaks only to sellers, and this brief is for an owner in Rockledge. It uses the local name from the sheet and the Census postal area that the sheet lists for it. Every figure is dated and linked, the arithmetic is shown, and inferences are labeled.
Key Findings
- Redfin's page for the postal area, for the three months ending August 2026, showed a median sale price of $389,831, down 2.5% from the same period last year, $223 per square foot, down 2.6%, 198 homes sold in August against 177 a year earlier, up 11.6% as printed, and a median of 49 days on market against 59. The sale-to-list ratio was 97.6%, up 0.8 points, 13.0% of homes sold above list, up 5.7 points, and 36.1% had price drops, down 8.4 points (Redfin, 32955 housing market).
- Realtor.com's page for the postal area, for September 2026, showed a median listing price of $386,250, down 0.85% from the month before and down 1.08% in a year, a median sold price of $385,000, down 12.80% from the month before and up 5.48% in a year, $223 per square foot, up 1.26% from the month before and down 1.28% in a year, 277 active listings, down 4.30% and down 27.08%, a median of 64 days on market, up 5.26% and down 16.67%, and a median rent of $2,150, down 2.23% and up 2.38% (Realtor.com, 32955 housing market).
- Zillow's page for Rockledge showed a home value index of $397,226, down 1.5% over the past year, with homes going pending in around 33 days. The page states that it was updated on April 30, 2026 (Zillow, Rockledge home values).
- In the Census postal area, 19,671 housing units were counted, 16,989 were occupied, 13,098 by owners and 3,891 by renters, 2,682 were vacant, 1,536 of them held for seasonal use, the median build year was 1995, the median owner value was $359,400, plus or minus $8,852, the median household income was $86,457 and the median rent was $1,755 per month (U.S. Census Bureau, American Community Survey 2020-2024 five-year estimates, tables B01003, B19013, B25004, B25034, B25064 and B25077).
- Of 41,008 people counted, 15.1% are under 18 and 25.1% are 65 or older. Of owners with a mortgage, 33.7% spent 30% or more of income on housing and 13.5% spent half or more. Of renters with a computed figure, 53.9% spent 30% or more of income on rent (U.S. Census Bureau, American Community Survey 2020-2024 five-year estimates, tables B01001, B25070 and B25091).
Why do the Rockledge price figures disagree, and what do they agree on?
The levels sit close together. Redfin's median sale price is $389,831, Realtor.com's sold median is $385,000 and its listing median is $386,250, and Zillow's index is $397,226. Realtor.com's sold median is 1.2% below Redfin's, computed here, and Zillow's index is 1.9% above it. A spread of about 3.2% between the lowest and highest of four figures is narrow, and it suggests that a typical Rockledge sale is near $390,000.
The directions are mixed. Redfin's median is down 2.5%, which implies about $399,827 a year earlier. Realtor.com's sold median is up 5.48% in a year, which implies about $364,998, and down 12.80% from the month before, which implies about $441,514. Its listing median is down 1.08%, which implies about $390,467. Zillow's index is down 1.5%, which implies about $403,275, though as of April.
Per-foot prices agree that nothing has moved much. Redfin shows $223, down 2.6%, which implies about $229 a year earlier, and Realtor.com shows $223, down 1.28%, which implies about $226. Both are down by about one to three percent. When two sources with different methods give the same level and a small decline, a seller can treat that as a flat market and not as a falling one.
The Census owner value of $359,400, plus or minus $8,852, is 7.8% below Redfin's median, computed here. It is 4.2 times the Census median household income of $86,457. Owners estimate the value of their homes, many of which they bought years ago, and the figure is an average over five years, so it trails current sales.
What the sources agree on is a flat price and a slower pace than in hotter markets. Prices are near $0.39M, homes take seven to nine weeks to sell by the median, and the average sale is below the list price. A seller who prices at the level of recent sales of similar homes should expect a patient sale, and a seller who prices above them should expect price cuts, since over a third of homes had one.
A short list of closed sales is the best check on all of this. Pick homes with a similar number of bedrooms, a similar lot and a similar age, sold in the last several months, and note the sale price, the days on market and the gap between the first ask and the last. With a median near $390,000 and a stock that ranges from older ranch houses to newer stucco homes, five or six sales of true comparables tell an owner more than a published median does.
| Source | Figure | What it measures |
|---|---|---|
| Census Reporter | $359,400 | Median owner value |
| Realtor.com | $385,000, up 5.48% | Median sold price, September 2026 |
| Realtor.com | $386,250, down 1.08% | Median listing price, September 2026 |
| Redfin | $389,831, down 2.5% | Median sale price, three months to August 2026 |
| Zillow | $397,226, down 1.5% | Home value index, updated April 30, 2026 |
Sources as cited. Ratios and year-earlier values in this section are computed from the published figures and percentages.
What is happening to Rockledge supply, and who has the leverage?
Supply has fallen. Realtor.com shows 277 active listings, down 27.08% in a year, which implies about 380 a year earlier, and down 4.30% from the month before, which implies about 289. That is a drop of about 103 listings, computed here. Redfin counted 198 sales in August, so 277 listings are about 1.4 months of sales, an inference that mixes two sources and a month with a three-month median, and is offered only as a rough scale.
Buyers still have room to bargain. Redfin rates the postal area somewhat competitive, with a score of 58 out of 100. Some homes get multiple offers. The average home sold about 3% below list and went pending in around 44 days, and hot homes sold for around the list price in around 24 days. Of homes sold, 13.0% went above list, up 5.7 points from a year before, which is a small share but a rising one, and 36.1% had a price drop, down 8.4 points, which is a falling one.
A sale below list is not a loss on its face. The sale-to-list ratio of 97.6% means that homes sold for 2.4% below their asking prices on average, which is about $9,356 on a sale near $390,000, computed here. Realtor.com's own figure is a ratio of 99%, with homes selling 1.44% below the asking price, so the two sources put the gap at about one to two and a half percent. The gap is the price of waiting, and a seller who lists high pays for the wait twice, once in the cut and once in the carrying costs.
Days on market differ by source. Redfin shows a median of 49 days against 59 a year earlier, a gain of about ten days by the page text. Realtor.com shows 64 days, down 16.67% in a year, which implies about 77 a year earlier. Both say that homes are selling faster than a year ago, even though 49 and 64 days are long compared with markets where homes sell in two weeks. The two measures count different things, and the difference is likely a matter of method.
For a seller, the cost of a public sale in a market like this is mostly time. A house is prepared, listed, shown, discounted and then inspected. A buyer who offers a close date, no financing condition and no repair list changes the arithmetic, since it replaces weeks of showings and a price cut with a single number. Whether that number is better than the open-market result is the owner's judgment to make, and a seller should compare.
The fall in listings also cuts two ways. Fewer homes for sale means a seller faces less direct competition than a year ago, which helps. Yet the share of homes with price drops is still more than a third, which says that many sellers who listed did not get their first price. The honest reading is that the market rewards a realistic opening price and punishes an optimistic one, and that a seller who is unsure about the right number can reduce the risk by taking a firm offer.
Sources as cited. Year-earlier values and differences are computed from the published percentages.
Who owns, who rents and who is away in Rockledge?
Ownership is the rule, with a large seasonal fringe. Of 16,989 occupied homes, 13,098 are owner-occupied, 77.1%, and 3,891 are rented, 22.9%. Of 19,671 units, 2,682 are vacant, 13.6%, and of those 1,536 are held for seasonal use, 491 are for rent, 116 are rented and not yet occupied, 59 are for sale only, 67 are sold and not yet occupied and 413 are vacant for other reasons. Seasonal homes are 57.3% of the vacant units, computed here.
Owners are fairly recent. Of 13,098 owner households, 323 moved in during 2023 or later and 1,939 between 2020 and 2022, so 17.3% moved in since 2020. Another 4,832, 36.9%, moved in between 2010 and 2019, 3,106, 23.7%, between 2000 and 2009, 1,973, 15.1%, in the 1990s and 925, 7.1%, before 1990. In all, 54.2% arrived since 2010, so many owners bought at post-2010 prices and carry a mortgage from that time.
Homes are mid-sized. Of 13,098 owner households, 71, or 0.5%, live in a home with no bedroom, 119, or 0.9%, in a one-bedroom, 1,412, or 10.8%, in a two-bedroom, 6,551, or 50.0%, in a three-bedroom, 4,296, or 32.8%, in a four-bedroom and 649, or 5.0%, in one with five or more bedrooms. So 87.8% live in a home with three or more bedrooms.
Costs are heavier for some. Of 7,818 owners with a mortgage, 7,749 with a computed figure, 2,609, or 33.7%, spent 30% or more of income on housing, and 1,044, or 13.5%, spent half or more. Among the 5,280 owners without a mortgage, 5,220 with a computed figure, 406, or 7.8%, spent 30% or more, and 232, or 4.4%, spent half or more, which reflects property taxes, insurance and upkeep. A third of owners with a mortgage are cost-burdened, and that is a reason some will want a quick, certain sale.
Renters move often. Of 3,891 renter households, 386 moved in during 2023 or later and 1,394 between 2020 and 2022, so 45.7% moved in since 2020, and 1,889, 48.5%, moved in between 2010 and 2019. Realtor.com shows 112 rental properties, down 14.29% in a year, which implies about 131 a year earlier, and a median rent of $2,150, up 2.38%. The Census median rent is $1,755, so the listed rent is 22.5% higher, computed here. Among renters with a computed figure, 53.9% spent 30% or more of income on rent and 33.5% spent half or more.
Put together, a typical owner is a household that arrived in the last fifteen years, lives in a three- or four-bedroom home and carries a mortgage that takes about a third of income in many cases. Some owners are away part of the year and keep the home for the winter or the family. For those owners, a sale on a date that suits them, without strangers walking through an empty house, is often worth more than a few days of extra exposure.
Source: U.S. Census Bureau, American Community Survey 2020-2024 five-year estimates, tables B25003, B25004, B25038, B25042, B25064, B25070 and B25091, via Census Reporter; Realtor.com for the rental count. Shares are computed here.
How old are Rockledge homes, and what does the newer stock mean for a seller?
The stock is newer than in most older towns. Of 19,671 units, 603, or 3.1%, were built before 1940, 270, or 1.4%, in the 1940s, 730, or 3.7%, in the 1950s, 2,706, or 13.8%, in the 1960s and 979, or 5.0%, in the 1970s. Another 3,148, or 16.0%, were built in the 1980s, 3,070, or 15.6%, in the 1990s and 5,838, or 29.7%, in the 2000s, the largest decade. Since 2010 the count is 1,685, or 8.6%, in the 2010s and 642, or 3.3%, in 2020 or later. The median build year is 1995, and 26.9% were built before 1980.
Newer does not mean worry-free. Homes built from the 1980s to the 2000s, 61.3% of the stock, are now between twenty and forty-five years old. Roofs, air conditioning units, water heaters and windows reach the end of their life in that span, and in a Florida climate they work hard. An inspector may find nothing alarming and still list several items that a buyer will ask to have fixed or priced in. That is an inference from the age of the stock and not a finding from any source here.
Most homes are detached. Of 19,671 units, 14,110, or 71.7%, are detached houses, 857, or 4.4%, are attached, 493, or 2.5%, are in buildings of two to four units and 3,597, or 18.3%, are in buildings of five or more. A further 614, or 3.1%, are mobile homes. A seller of a detached house in a community of similar houses competes with many near copies, which is why a price above the neighbors' recent sales is quickly noticed.
The population is mixed in age. Of 41,008 people counted, 6,211, or 15.1%, are under 18, 3,610, or 8.8%, are 18 to 24, 4,669, or 11.4%, are 25 to 34, 4,639, or 11.3%, are 35 to 44, 11,569, or 28.2%, are 45 to 64 and 10,310, or 25.1%, are 65 or older. The share who are 65 or older is a quarter of the population, and many in that group own a home outright or carry a small mortgage.
An owner in the older groups often holds most of their wealth in the house. A household that is retiring, moving closer to family or giving up a second home may weigh a sale, and the timing is the owner's choice. A seller in that position often wants a date that fits a move, privacy while the decision is made and a price that needs no repairs first. Those are the things a private buyer can offer.
Condition is the last piece. A home that has been kept up, with a newer roof, a modern cooling system and updated wiring, loses little to an inspector, and a home that has been put off for years can lose a great deal. A seller who is unsure what an inspection would find may prefer an offer from a buyer who has already priced the home as it stands. That does not make the home worth less. It moves the cost of repair from a negotiation to the price. Readers comparing markets can also read the Summerland Key brief and the Cape Coral brief.
Source: U.S. Census Bureau, American Community Survey 2020-2024 five-year estimates, tables B01001, B25004, B25024 and B25034, via Census Reporter. Shares are computed here.
What should a Rockledge owner ask, and what does a private sale change?
Five questions are worth asking. Is my price based on closed sales of homes like mine, and not on a median that mixes large and small homes? What will the buyer's inspector find in a home of this age? What do taxes, insurance and upkeep cost me per month while the home is on the market? Do I want a public process with showings? What will the fees be?
Fees are simple arithmetic, and no rate is assumed here. Each 1% of a $450,000 sale is $4,500, of a $725,000 sale is $7,250 and of a $1,200,000 sale is $12,000. Three percent is $13,500, $21,750 and $36,000, and five percent is $22,500, $36,250 and $60,000. A seller can put their own quoted costs into those rows. On the Redfin median of $389,831, 1% is $3,898, 3% is $11,695 and 5% is $19,492.
A private sale has no showings and no neighbors talking about it, which is the first benefit. For a household in a place where a home can sit for seven to nine weeks and a third of listings cut their price, a quiet transaction has plain appeal. The second benefit is a closing date that fits the seller, which helps an owner who needs time to find the next home or to wind down a second residence.
The third and fourth benefits are no commission costs and no closing costs, and the fifth is no inspection repairs. In a postal area where a large part of the stock is twenty to forty-five years old, an inspector will find work, so the fifth is worth pricing. An owner should set an offer beside what the same home would net after preparation, after fees, after price cuts and after the cost of time.
Maison Off-Market buys luxury homes and estates directly from their owners and speaks only to sellers. It does not say that a private sale always beats a public listing, and in a market where some homes still sell above list, an owner is right to compare carefully. If you would like a private, no-obligation offer for a home in Rockledge, call 401-219-4207 or use the contact form on this site.
Sources as cited. Fee illustrations are arithmetic only and assume no commission rate.
Methodology and limitations
Each page's date, title and place were read before use. The Redfin page is for the three months ending August 2026. The Realtor.com page is for September 2026, and its columns are month over month and year over year. The Zillow page states that it was updated on April 30, 2026, so it is several months older than the others and is used only as a rough check. Only established data publishers and the Census are cited. The Census figures are five-year estimates for the postal area that the sheet lists for Rockledge. Percent changes were taken as printed, and ratios, sums, fee figures and year-earlier values are this brief's arithmetic.
Conclusion
The record for Rockledge is a flat price near $0.39M, homes that sell in seven to nine weeks and below list on average, active listings that have fallen by more than a quarter in a year and a stock in which two homes in five were built since 2000. The useful number for an owner is a closed sale of a comparable home, and a private buyer can price the home in front of them and close on the owner's schedule.
Frequently Asked Questions
What is the median home price in Rockledge?
Redfin shows a median sale price of $389,831 for the postal area for the three months ending August 2026, and Realtor.com shows a median sold price of $385,000 for September 2026.
How long do homes take to sell in Rockledge?
Redfin shows a median of 49 days on market, and Realtor.com shows 64 days.
Are Rockledge homes selling below asking?
On average, yes. Redfin shows a sale-to-list ratio of 97.6%, and 13.0% of homes sold above list.
How old are Rockledge homes?
The Census counts 8,165 of 19,671 housing units in the postal area, 41.5%, as built since 2000, with a median build year of 1995.
Can I sell my home in Rockledge privately?
Yes. Maison Off-Market buys luxury homes and estates directly from their owners with no showings, flexible closing dates, no commission costs, no closing costs and no inspections or repairs. Call 401-219-4207 or use the contact form.
Compare your options before committing. Request a written private offer for your property, with no obligation, then weigh it against your listing plan.
Sources
- Realtor.com, 32955 housing market, 2026. 32955 Housing Market Data. https://www.realtor.com/local/market/florida/zipcode-32955.
- Redfin, 32955 housing market, 2026. 32955 Housing Market Trends. https://www.redfin.com/zipcode/32955/housing-market.
- Zillow, Rockledge home values, 2026. Rockledge, FL Housing Market. https://www.zillow.com/home-values/13560/rockledge-fl/.
Related research

Seller Guide · October 6, 2026
How to Prepare Point Pleasant Beach Rental Records Before Selling
Separate rental approval, income history and booked stays before comparing sale terms.

Seller Guide · October 6, 2026
How to Prepare Rumson Flood and Waterfront Records Before Selling
Separate flood disclosure, elevation, repairs and waterfront rights before comparing sale terms.

Seller Guide · October 6, 2026
How to Prepare Sarasota Condo Inspection and Reserve Records Before Selling
Separate building condition, reserve funding and resale documents before comparing sale terms.