Market Brief · by Aidan Sowa · October 5, 2026
Why Does a Summerland Key Home Take So Long to Sell When Prices Keep Rising? Reading Redfin, Realtor.com, the Seasonal Count and the Mobile Homes
Reading Redfin, Realtor.com, the Seasonal Count and the Mobile Homes for Summerland Key, FL, with each source dated and its limits noted, for owners weighing a listing against a direct sale.
Why does a Summerland Key home take so long to sell when prices keep rising? The pages show a market in which the price rises and the pace slows. Redfin's page for the postal area that includes Summerland Key, for the three months ending August 2026, shows a median sale price of $1,099,524, up 10.0%, with homes taking a median of 147 days to sell against 126 a year earlier, and selling about 5% below list on average. Realtor.com's page for the same area, for September 2026, shows a median listing price of $1,270,000, 196 active listings and a median of 106 days on market.
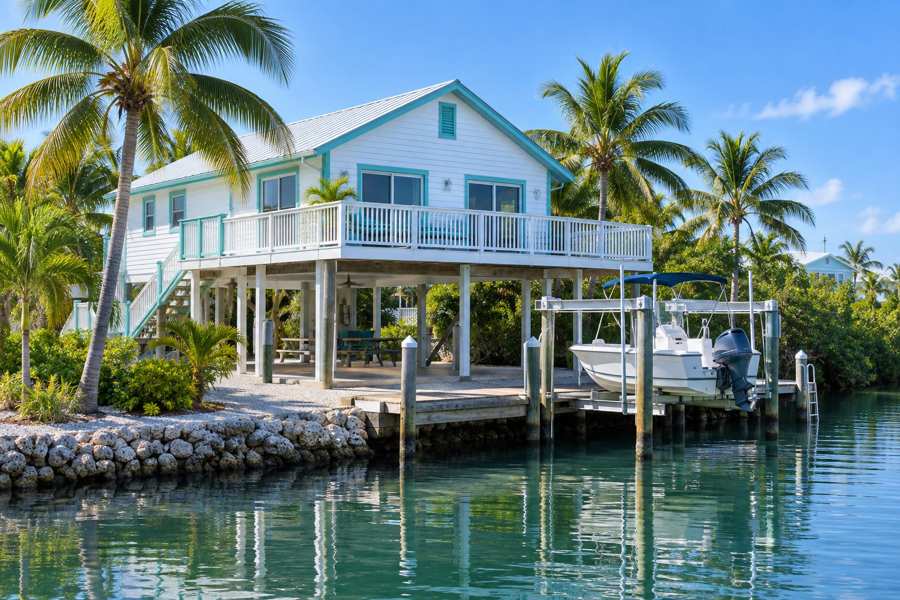
The Census shows why the market behaves this way. In the postal area, 1,937 of 4,757 housing units, 40.7%, are vacant, and 1,508 of them, 31.7% of all units, are held for seasonal, recreational or occasional use. Only 2,820 units are occupied as a main home. A house here competes for buyers who want a winter home and buyers who want a year-round one, and many of the homes are mobile homes, boats and small houses on pilings.
Maison Off-Market speaks only to sellers, and this brief is for an owner in Summerland Key. It uses the name from the sheet and the Census postal area that the sheet lists for it. Every figure is dated and linked, the arithmetic is shown, and inferences are labeled.
Key Findings
- Redfin's page for the postal area, for the three months ending August 2026, showed a median sale price of $1,099,524, up 10.0% from the same period last year, $771 per square foot, down 7.4%, 64 homes sold in August against 59 a year earlier, and a median of 147 days on market against 126. The sale-to-list ratio was 94.8%, up 2.3 points, and 3.2% of homes sold above list. Redfin's Compete Score was 11 out of 100, not very competitive: multiple offers are rare, the average home sold about 5% below list and went pending in around 135 days, and hot homes sold about 1% below list in around 51 days (Redfin, 33042 housing market).
- Realtor.com's page for the postal area, for September 2026, showed a median listing price of $1,270,000, up 4.21% in a year, a median sold price of $1,000,000, up 22.01% in a year but down 31.51% from the month before, $902 per square foot, up 1.69%, 196 active listings, down 3.92% in a year, a median of 106 days on market, up 23.03%, 21 rental properties, up 212.50%, and a median rent of $4,800 per month, down 3.03%. Homes sold for 96% of the asking price, 4.44% below on average, and the page calls the market cool and balanced (Realtor.com, 33042 housing market).
- Zillow's page for Summerland Key showed a home value index of $1,068,585, down 2.1% over the past year, with text dated April 30, 2026, so it is the oldest of the three sources (Zillow, Summerland Key home values).
- In the Census postal area, 4,757 housing units were counted, 2,820 were occupied, 2,332 by owners and 488 by renters, 1,937 were vacant, 1,508 of them held for seasonal use, the median build year was 1990, the median owner value was $856,500, plus or minus $47,643, the median household income was $103,041 and the median rent was $2,271 per month (U.S. Census Bureau, American Community Survey 2020-2024 five-year estimates, via Census Reporter).
- Of 6,441 people counted, 29.6% are 65 or older and 15.2% are under 18. Of owners with a mortgage, 55.4% spent 30% or more of income on housing and 27.2% spent half or more. Of renters with a computed figure, 63.4% spent 30% or more of income on rent (U.S. Census Bureau, American Community Survey 2020-2024 five-year estimates, tables B01001, B25091 and B25070).
Why do Summerland Key prices rise while sales slow?
The price figures and the pace figures point in different directions. Redfin's median of $1,099,524 is up 10.0%, which implies about $999,567 a year earlier, and its per-foot price of $771 is down 7.4%, which implies about $833. Homes took 147 days to sell against 126, and the average home sold about 5% below list. A median that rises while homes sell slowly and at a discount is a sign of a changing mix, and larger or better-placed homes are probably selling, which is an inference.
The sources differ on level. Redfin's median sale price is $1,099,524, Realtor.com's sold median is $1,000,000, 9.1% below Redfin's, and Realtor.com's listing median of $1,270,000 is 15.5% above it, computed here. The Zillow index of $1,068,585 is 2.8% below Redfin's median and 15.9% below Realtor.com's listing median, computed here. The listing median is 27.0% above the sold median on Realtor.com, a gap that agrees with the discount that Redfin reports.
Realtor.com's sold median needs care. Its $1,000,000 is up 22.01% in a year, which implies about $819,605, and down 31.51% from the month before, which would imply about $1,460,067 a month earlier. A swing of that size in a month is the sign of a thin sample, and with 196 active listings but only about 64 sales a month, a single month's median can move a great deal. This brief reports the figure as printed and does not rely on it.
Per-foot prices agree better. Redfin shows $771, down 7.4%, and Realtor.com shows $902 for listings, up 1.69%, which implies about $887 a year earlier. A listing price per foot above a sold price per foot is normal, and the gap here is about 17%, computed here, which again matches the discount to list.
The Census owner value of $856,500, plus or minus $47,643, is 22.1% below the Redfin median, computed here, and is 8.3 times the Census median household income of $103,041. The Census income reflects year-round residents, and many buyers here are not local earners. Prices are set partly by buyers from elsewhere, which is one reason that local income and local prices drift apart.
A practical check is a short list of closed sales. Pick homes of a similar type, whether a house on pilings, a concrete block house or a mobile home, with similar frontage, water access and age, sold in the last several months, and note the sale price, the days on market and how far the price fell from the first ask. In the Keys a canal that opens to deep water can be worth far more than a dead-end one, so five or six sales of true comparables tell an owner more than a published median does.
| Source | Figure | What it measures |
|---|---|---|
| Census Reporter | $856,500 | Median owner value |
| Realtor.com | $1,000,000, up 22.01% | Median sold price, September 2026, thin sample |
| Zillow | $1,068,585, down 2.1% | Home value index, April 2026 |
| Redfin | $1,099,524, up 10.0% | Median sale price, three months to August 2026 |
| Realtor.com | $1,270,000, up 4.21% | Median listing price, September 2026 |
Sources as cited. Ratios and year-earlier values in this section are computed from the published figures and percentages.
How slow is Summerland Key, and how large is the discount to list?
Redfin rates the postal area not very competitive, with a score of 11 out of 100. Multiple offers are rare. The average home sold about 5% below list and went pending in around 135 days, and hot homes sold about 1% below list in around 51 days. On a $1,099,524 sale, 5% is about $54,976, computed here.
The pace is slow. Redfin shows a median of 147 days on market against 126 a year earlier, a rise of 21 days. Realtor.com shows 106 days, up 23.03%, which implies about 86 days a year earlier. The sources differ on the level, and they agree on the direction: it takes longer to sell a house than it did a year ago, and the hottest homes are the exception.
Few homes sell above the ask. Redfin shows a sale-to-list ratio of 94.8%, up 2.3 points, with 3.2% of homes selling above list. Realtor.com shows 96%, 4.44% below the ask on average. A seller who counts on a bidding war is unlikely to see one, and a seller who lists at the listing median is asking well above what homes bring.
Supply is large against sales. Realtor.com shows 196 active listings, down 3.92% in a year, which implies about 204, and Redfin counted 64 sales in August, up from 59, a rise of 8.5%, computed here and shown by Redfin as 8.1%. So 196 listings are about 3.1 times a month of sales, computed here, and an inference because the two sources count different periods. A buyer has many houses to choose from and no reason to hurry.
For a seller, the practical cost is time. A house that takes 147 days costs about five months of taxes, insurance, utilities and upkeep, and in the Keys the insurance and the flood coverage are large. A buyer who offers a close date, no financing condition and no repair list changes the arithmetic. A seller can compare such an offer with a list price less the usual discount, less fees, less the cost of time.
Season matters here more than most pages admit. A house that comes to market in the winter meets visitors who are in town and ready to look, and one that comes to market in late summer meets fewer buyers and the worry of storm season. The pages do not break sales out by month, so this is an inference from the Census count of seasonal homes and not a measured pattern, but an owner who cannot choose the season may prefer an offer that does not depend on it.
Sources as cited. Year-earlier values and differences are computed from the published percentages.
How many Summerland Key homes are empty, seasonal or mobile?
Vacancy is high. Of 4,757 housing units, 2,820, or 59.3%, are occupied and 1,937, or 40.7%, are vacant. Of the vacant units, 1,508, or 77.9%, are held for seasonal, recreational or occasional use, which is 31.7% of all units. Another 208, or 10.7% of vacant units, are for rent, 169, or 8.7%, are vacant for other reasons and 52, or 2.7%, are for sale only. In a place where many owners come for the winter and leave in summer, the Census counts those homes as vacant.
The housing types are unusual. Of 4,757 units, 4,000, or 84.1%, are detached houses, 105, or 2.2%, are attached, 166, or 3.5%, are in buildings of two to four units and 20, or 0.4%, are in larger buildings. Mobile homes make up 375 units, 7.9%, and boats, recreational vehicles and similar make up 91 units, 1.9%. Nearly one unit in ten is not a conventional house, and a seller of one faces a narrower pool of lenders and insurers.
Ownership is stable. Of 2,332 owner households, 86 moved in during 2023 or later and 291 between 2020 and 2022, so 16.2% moved in since 2020. Another 1,078, 46.2%, moved in between 2010 and 2019, 395, 16.9%, between 2000 and 2009, 301, 12.9%, in the 1990s and 181, 7.8%, before 1990. In all, 62.4% arrived since 2010, so many owners are relative newcomers.
Homes are small to mid-sized. Of 2,332 owner households, 15, or 0.6%, live in a studio, 230, or 9.9%, in a one-bedroom, 913, or 39.2%, in a two-bedroom, 975, or 41.8%, in a three-bedroom, 179, or 7.7%, in a four-bedroom and 20, or 0.9%, in one with five or more bedrooms, so 50.3% live in a home with three or more bedrooms. Among the 488 renter households, 71.5% live in a home with two bedrooms or fewer.
Renters are few and turn over. Of 488 renter households, 29 moved in during 2023 or later and 170 between 2020 and 2022, so 40.8% moved in since 2020, and 202, 41.4%, moved in between 2010 and 2019. Realtor.com shows 21 rental properties, up 212.50%, which implies about 7 a year earlier, and a median rent of $4,800, down 3.03%. The Census median rent of $2,271, plus or minus $180, is 47.3% of the listing rent, computed here. Asking rents on new listings run far above what sitting tenants pay.
A rental or seasonal owner faces one more step. Bookings already taken, deposits held and any local rules on short stays pass to the buyer or end with the sale, and they need to be settled before closing. A buyer who wants the house for personal use will want vacant possession on a date, and a buyer who wants income will want the booking records. Having both ready lets the seller answer quickly.
Source: U.S. Census Bureau, American Community Survey 2020-2024 five-year estimates, tables B25003, B25004, B25024, B25038, B25042 and B25064, via Census Reporter; Realtor.com for the rental count. Shares are computed here.
What does the age of Summerland Key homes mean for insurance and inspection?
Most homes are newer than in most of Florida. Of 4,757 units, 1,440, or 30.3%, were built in the 1980s, 1,015, or 21.3%, in the 1990s, 694, or 14.6%, in the 2000s, 673, or 14.1%, in the 1970s and 571, or 12.0%, in the 2010s. Only 956 units, 20.1%, were built before 1980, and 1,346, 28.3%, since 2000. The median build year is 1990. Many older homes in the Keys were lost to storms, and the stock that remains was built under later codes, which is an inference.
Newer building does not remove the risk. A house in the Lower Keys faces wind, salt, flood and a long list of rules on elevation, and a buyer's inspector looks at the roof, the openings, the pilings or slab, the electrical system and the elevation certificate. Insurance is a major cost, and a buyer's offer often depends on a quote. A seller whose house has a recent roof, impact windows and a clean certificate is in a stronger position.
Costs are heavy for owners with a mortgage. Of 996 owners with a mortgage, 977 with a computed figure, 541, or 55.4%, spent 30% or more of income on housing, and 266, or 27.2%, spent half or more. Among the 1,336 owners without a mortgage, 259, or 19.4%, spent 30% or more, and 143, or 10.7%, spent half or more, which reflects insurance and taxes on a home owned outright. Of the 456 renters with a computed figure, 289, or 63.4%, spent 30% or more, and 146, or 32.0%, spent half or more.
The population is older. Of 6,441 people counted, 1,905, or 29.6%, are 65 or older, 1,967, or 30.5%, are 45 to 64, 660, or 10.2%, are 35 to 44, 664, or 10.3%, are 25 to 34, 268, or 4.2%, are 18 to 24 and 977, or 15.2%, are under 18. About 60.1% are 45 or older. Many owners are retired or near retirement, and some are weighing a move closer to family or to care.
For an owner who comes only for the winter, the question is different. A house that is used for a few months a year still has to be insured, kept up and taxed all year, and a hurricane season without a resident adds worry. An owner whose use has fallen may find that a sale on a chosen date, without a summer of showings, is the simplest way out. A private buyer can offer exactly that.
Taken together, a typical year-round owner here is a household that arrived in the last fifteen years, owns a two- or three-bedroom home built in the 1980s or 1990s and pays insurance and taxes that rise every year. Such an owner is not forced to sell, so timing and certainty drive the decision. A move on a fixed date, without a season of showings and without a list of repairs from a buyer's inspector, has real value, and the offer can be weighed against what a public sale would net. Readers comparing markets can also read the Coral Gables brief and the Rockledge brief.
Source: U.S. Census Bureau, American Community Survey 2020-2024 five-year estimates, tables B01001, B25034, B25070 and B25091, via Census Reporter. Shares are computed here.
What should a Summerland Key owner ask, and what does a private sale change?
Five questions are worth asking. Is my price based on closed sales of homes like mine, and not on a listing median that sits about a quarter above the sold one? What will a buyer's insurer and inspector say about this house? What does it cost to keep the house through a slow sale? Who is the buyer, a resident, a second-home owner or an investor? What will the fees be?
Fees are simple arithmetic, and no rate is assumed here. Each 1% of a $450,000 sale is $4,500, of a $725,000 sale is $7,250 and of a $1,200,000 sale is $12,000. Three percent is $13,500, $21,750 and $36,000, and five percent is $22,500, $36,250 and $60,000. A seller can put their own quoted costs into those rows. On the Redfin median of $1,099,524, 1% is $10,995, 3% is $32,986 and 5% is $54,976.
A private sale has no showings and no neighbors talking about it, which is the first benefit. For an owner who lives elsewhere, there is a practical side: no open houses, no staging and no need to be on the island when a buyer calls. The second benefit is a closing date that fits the seller, which helps an owner who wants to close before storm season.
The third and fourth benefits are no commission costs and no closing costs, and the fifth is no inspection repairs. In a place where insurance and elevation questions can stall a sale, a buyer who takes the house as it stands, with no repair list, can save the seller months. An owner should set an offer beside what the same house would net after the usual discount, after fees and after the cost of time.
Maison Off-Market buys luxury homes and estates directly from their owners and speaks only to sellers. It does not say that a private sale always beats a public listing, and in a market where the average home sells about 5% below list, an owner is right to compare. If you would like a private, no-obligation offer for a home in Summerland Key, call 401-219-4207 or use the contact form on this site.
Sources as cited. Fee illustrations are arithmetic only and assume no commission rate.
Methodology and limitations
Each page's date, title and place were read before use. The Redfin page is for the three months ending August 2026. The Realtor.com page is for September 2026, and its sold median, which fell 31.51% from the month before, is reported as printed and not relied on. The Zillow page text is dated April 30, 2026 and is the oldest source. Only established data publishers and the Census are cited. The Census figures are five-year estimates for the postal area that the sheet lists for Summerland Key. Percent changes were taken as printed, and ratios, sums, fee figures and year-earlier values are this brief's arithmetic.
Conclusion
The record for Summerland Key is a level of about $1.0M to $1.1M, homes that sell about 5% below list after about five months, a stock in which about one home in three is held for seasonal use and housing that is mostly newer than 1980. The useful number for an owner is a closed sale of a comparable home, and a private buyer can price the home in front of them and close on the owner's schedule.
Frequently Asked Questions
What is the median home price in Summerland Key?
Redfin shows a median sale price of $1,099,524 for the postal area for the three months ending August 2026, and Realtor.com shows a listing median of $1,270,000 for September 2026.
How long do homes take to sell in Summerland Key?
Redfin shows a median of 147 days on market, and Realtor.com shows 106 days.
How many Summerland Key homes are seasonal?
The Census counts 1,508 of 4,757 housing units in the postal area as held for seasonal, recreational or occasional use, 31.7%.
Do homes in Summerland Key sell above asking?
Rarely. Redfin shows a sale-to-list ratio of 94.8%, with 3.2% of homes selling above list.
Can I sell my home in Summerland Key privately?
Yes. Maison Off-Market buys luxury homes and estates directly from their owners with no showings, flexible closing dates, no commission costs, no closing costs and no inspections or repairs. Call 401-219-4207 or use the contact form.
Compare your options before committing. Request a written private offer for your property, with no obligation, then weigh it against your listing plan.
Sources
- Redfin, 33042 housing market, 2026. 33042 Housing Market Trends. https://www.redfin.com/zipcode/33042/housing-market.
- Realtor.com, 33042 housing market, 2026. 33042 Housing Market Data. https://www.realtor.com/local/market/florida/zipcode-33042.
- Zillow, Summerland Key home values, 2026. Summerland Key, FL Housing Market. https://www.zillow.com/home-values/54612/cudjoe-key-fl/.
Related research

Seller Guide · October 6, 2026
How to Prepare Point Pleasant Beach Rental Records Before Selling
Separate rental approval, income history and booked stays before comparing sale terms.

Seller Guide · October 6, 2026
How to Prepare Rumson Flood and Waterfront Records Before Selling
Separate flood disclosure, elevation, repairs and waterfront rights before comparing sale terms.

Seller Guide · October 6, 2026
How to Prepare Sarasota Condo Inspection and Reserve Records Before Selling
Separate building condition, reserve funding and resale documents before comparing sale terms.