Market Brief · by Aidan Sowa · October 5, 2026
Who Is Right About Sedgefield, the Value, the Sale or the Listing? Reading a Rising Home Value and a Falling Sold Price
Reading a Rising Home Value and a Falling Sold Price for Sedgefield, NC, with each source dated and its limits noted, for owners weighing a listing against a direct sale.
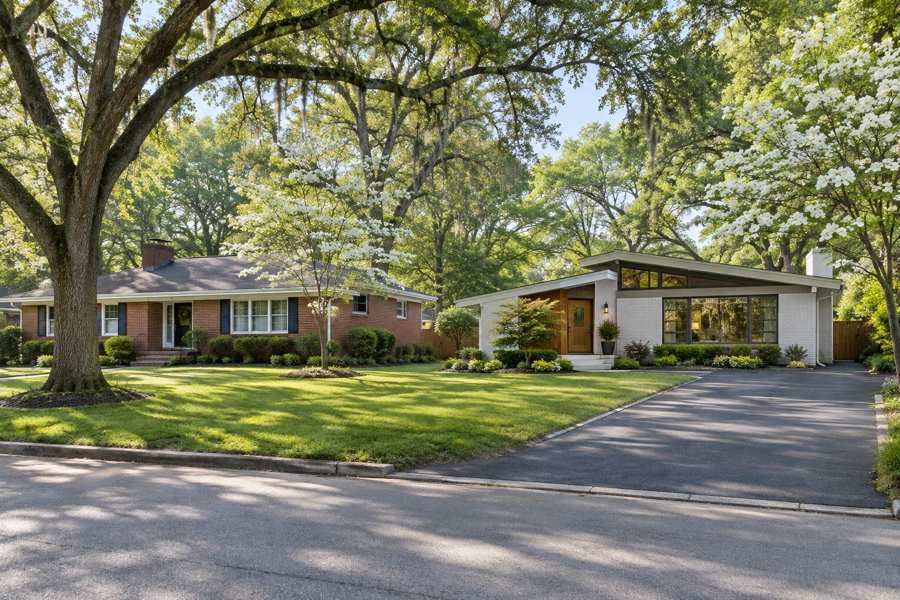
Sedgefield, a neighborhood just south of uptown Charlotte, is one of those places where two reasonable pages describe different markets. Zillow, updated August 31, 2026, says the value of a Sedgefield home is $704,198, up 5.3% on the year. Realtor.com says the median sold price is $950,625, down 4.94% on the year, while the median listing price is $939,000, up 11.45%.
The direction of the three figures differs and so does the level. The sold median is $246,427 above the Zillow value, which is 35% of the Zillow figure. A seller who reads Zillow would think that prices are rising and that the home is worth about $700,000. A seller who reads Realtor.com would see that homes that sold went for much more and that the price is slipping, while owners who list are asking for more than they were.
This brief reads the two pages with the Census profile of the postal area that includes Sedgefield and with a Realtor.com series for the Charlotte area. It asks why a value, a sold price and a listing price can move in three directions, what the page says about rentals, and what a private sale changes.
Key Findings
- Zillow reported an average Sedgefield home value of $704,198, up 5.3% over the past year, updated August 31, 2026 (Zillow, Sedgefield).
- Realtor.com reported a Sedgefield median listing price of $939,000 (up 11.45%), a median sold price of $950,625 (down 4.94%), $424 per square foot (down 4.93%), 30 active listings (up 42.86%), a median of 29 days on market (up 38.10%), 99 rental properties (up 56.25%) and a median rent of $1,941 a month (up 8.56%), with a sale-to-list ratio of 97% in May 2026 (Realtor.com, Sedgefield).
- In the Census postal area, 6,657 of 12,793 occupied homes (52.0%) are rented, 5,955 of 13,943 housing units (42.7%) were built before 1980 and median household income is $101,873 (U.S. Census Bureau, 2020-2024).
- In the Charlotte-Concord-Gastonia area the median days on market rose from 47 in May 2026 to 64 in September (Realtor.com, days on market).
- The Charlotte area had 8,851 active listings in March 2026 and 11,221 in July (Realtor.com, active listings).
Why can a value rise while a sold price falls?
A home value, in the sense Zillow uses, is an estimate of what a typical home in an area would be worth. It is built from a model that draws on sales and listings across the area and smooths them over time. A sold price is a fact about homes that closed in a month. The two can part ways for a good while, and for good reasons.
The first is the mix. If the homes that sold this year were larger or better placed than last year's, the sold median rises or holds even when no single house gained. If they were smaller, it falls. A fall of 4.94% in the sold median may say more about which homes sold than about what homes are worth.
The second is the sample. Sedgefield has 30 homes for sale and a median wait of 29 days, so the number of closings in a month is in the tens. A median of a few dozen sales swings with its members, and the page does not state how many closed.
The third is the area. Zillow's Sedgefield and Realtor.com's Sedgefield may not cover the same streets. A boundary that takes in more of the older, smaller homes pulls the typical value down, and one that takes in newer larger homes on the edge pulls it up.
A seller who needs a number should treat the three figures as a range, from a value near $700,000 to sold and listed medians near $940,000 to $950,000, and then ask what homes of the same size and condition on the same streets sold for in the last few months. That list, and not any median, is the evidence that a buyer will use.
There is also a simple check an owner can make. Look up three homes of about the same size on the same street that sold in the last six months, note the prices per square foot and compare them with the page's $424. If the three agree with each other and differ from the page, trust the three. If they scatter, the neighborhood is too mixed for any one figure, which is itself a useful finding.
| Measure | Figure | Change on the year |
|---|---|---|
| Zillow home value (updated August 31) | $704,198 | Up 5.3% |
| Realtor.com median sold price | $950,625 | Down 4.94% |
| Realtor.com median listing price | $939,000 | Up 11.45% |
| Realtor.com price per square foot | $424 | Down 4.93% |
Sources: Zillow and Realtor.com pages as cited. The $246,427 and 35% figures are this brief's arithmetic. Commercial content; not independently verified.
What does it mean when listings rise and sales fall?
Asking prices rose 11.45% while the sold price fell 4.94%. The gap between the two kinds of price has therefore widened. Working back from the published changes, a year ago the listing median was near $842,000 and the sold median near $1,000,000, so homes then sold well above the typical ask. Now the two are nearly level. The calculation is only an illustration of the changes, and the two figures may not describe the same homes.
More telling is the sale-to-list ratio of 97% and the note that homes sold 2.63% below the asking price on average in May 2026. On a home listed at $939,000, 2.63% is about $24,700. The ratio says that the typical seller received a little less than the ask, not a premium.
Supply moved the same way. The page reports 30 active listings, up 42.86% on the year and up 200% on three years, so the count is three times what it was three years ago. The wait of 29 days is up 38.10% on the year, and the page calls the market balanced. Fewer buyers per home, and a longer wait, is the shape of a market that has moved from the seller's side toward the middle.
These are small counts, and 30 listings in a neighborhood is not much. But the three figures agree on direction: more homes for sale, a longer wait, and sales a little under ask.
Source: Realtor.com page as cited. The $842,000, $1,000,000 and $24,700 figures are this brief's arithmetic from the published changes and ratio. Commercial content; not independently verified.
Which of the three Sedgefield figures should an owner trust?
None should be trusted alone, and each is useful for a different question. The Zillow value answers the question of what a typical home in the area might be worth, and it moves slowly because it is smoothed. The sold median answers what the homes that closed went for, and it moves with the mix of homes. The listing median answers what owners are asking, and it moves with the sentiment of sellers.
An owner who wants to know what a buyer will pay should weight the sold median most, since it records actual deals, and then adjust for the home's size, age and condition. An owner who wants to know how the market is moving should look at the listing counts, the wait and the share of listings that are cut. An owner who wants a rough sense of wealth can look at the Zillow figure, with the caution that it is an estimate.
The three together say that Sedgefield is a market where asking prices are firm, sales are a little below the asks, supply is up and the wait is longer. They do not say what any one house will fetch. For that, the best evidence is a short list of recent sales of similar homes nearby, and the best test is an offer.
It is worth remembering that all three come from companies that earn money when homes are listed and sold. That does not make the figures wrong, but it is a reason to read them as descriptions and not as promises.
An owner can also ask a simple question of each page: what would I have to believe for this figure to be my home's price? To believe $704,198, the home would need to be of average size and condition in an area that includes many smaller houses and rentals. To believe $950,625, it would need to resemble the homes that happened to close this period. To believe $939,000, a buyer would have to pay what other owners hope for. Each belief can be tested against a few real sales, and none should be accepted before it is.
Sources: Zillow and Realtor.com pages as cited. The reasoning is this brief's and not a finding. Commercial content; not independently verified.
What do the Census numbers say about Sedgefield homes?
The Census profile covers the postal area that includes Sedgefield, which also takes in neighboring areas. It counts 24,331 people and 13,943 housing units, of which 12,793 are occupied and 1,150 are vacant, a vacancy rate of 8.2%. Owners live in 6,136 homes (48.0% of those occupied) and renters in 6,657 (52.0%). Median household income is $101,873 and median gross rent is $1,710 a month.
More than half of the occupied homes are rented. That fits the Realtor.com figure of 99 rental properties, up 56.25% on the year and 468% over three years. A neighborhood where more than half of households rent has many homes owned by investors, and a share of the sales are investor sales. Investors price a home by what it will rent for and what it will cost to repair, and a seller who is selling to one should expect those questions.
Owners estimate the median home at $623,000, with a margin of error of $50,200, or 8.1%. That sits below the Zillow value of $704,198 by 12% and below the sold median by 34%, which is a reminder that the Census figure is an average of owner estimates over five years and that the postal area is wider than the neighborhood.
The housing is mixed in age. The median year built is 1989. The largest single group is 4,064 homes (29.1%) built in the 2010s, and another 623 (4.5%) since 2020. The older group is also large: 2,170 (15.6%) from the 1950s, 1,488 (10.7%) from the 1960s, and 5,955 (42.7%) before 1980.
| Indicator | Value | Note |
|---|---|---|
| Population | 24,331 | Whole postal area |
| Housing units | 13,943 | All units |
| Renter-occupied homes | 6,657 | 52.0% of occupied |
| Built before 1980 | 5,955 | 42.7% of all units |
| Median household income | $101,873 | Estimate |
| Median gross rent | $1,710 | Per month |
| Owner-estimated median value | $623,000 | Margin of error $50,200 |
| Median year built | 1989 | Estimate |
Source: U.S. Census Bureau, American Community Survey 2020-2024 five-year estimates. The 12% and 34% figures are this brief's arithmetic.
What does a $1,941 rent say about the price?
Realtor.com reports a median rent of $1,941 a month in Sedgefield, up 8.56% on the year. A year of that rent is $23,292. Against the Zillow value of $704,198, that is 3.3% a year, and against the sold median of $950,625 it is 2.5%. The Census median rent for the postal area is $1,710, so the page's figure is 14% higher.
A gross rent of 2.5% to 3.3% of the price, before taxes, insurance, repairs, vacancy and management, is thin. A buyer at these prices who rents the home out is relying on more than the rent. The sources here do not give loan rates or the costs of ownership in Charlotte and I do not estimate them.
The 99 rentals, up 56.25% in a year, say that many owners have chosen to rent their homes. That is a choice an owner makes when a sale does not look attractive, and it increases the supply of rentals and puts some pressure on rents. It is also a choice that carries repairs, tenants and months without income.
An owner who would rather not be a landlord has a simpler alternative in a direct sale, which ends the costs on a date the owner sets.
Sources: Realtor.com page, Zillow and U.S. Census Bureau as cited. The $23,292, 3.3%, 2.5% and 14% figures are this brief's arithmetic. Commercial content; not independently verified.
What does a seller owe a buyer who finds problems in an older house?
In a postal area where 42.7% of homes predate 1980 and 15.6% were built in the 1950s, a buyer's inspection of a typical older house is likely to find items. A roof near the end of its life, an old electrical panel, a heating system of an earlier decade, galvanized or cast iron pipes, and drainage that sends water toward the foundation are common examples. None of the pages used here measures them in Sedgefield, and I do not estimate their cost.
What a seller owes depends on the contract and on state rules about disclosure, and I do not give legal advice. As a matter of practice, the findings of an inspection become the basis for a request to lower the price, to credit the buyer at closing or to repair before closing. A seller who is not ready for the request may lose weeks, and a buyer who is not satisfied may leave.
A seller who has the inspection done first knows what a buyer will find. That costs money and time, and the result may be a list that the seller then has to decide about. A seller who sells to a buyer who takes the home as it is avoids the step, with the price set to reflect the condition.
The same point applies to rentals. A house with a history of tenants has wear that is not always visible, such as damage behind appliances, worn flooring and older fixtures. An owner who has been a landlord for years may find that selling is easier without the repairs that a buyer will ask for.
Source: U.S. Census Bureau as cited. The reasoning about inspections is this brief's and not a measured finding, and nothing here is legal advice.
What does the Charlotte series show about the wider market?
The Charlotte-Concord-Gastonia series from Realtor.com, published by the Federal Reserve Bank of St. Louis, covers a region with a median listing price near $430,000, less than half of Sedgefield's. It cannot describe the neighborhood. It shows the climate.
Median days on market rose from 47 in May to 51 in June, 57 in July, 61 in August and 64 in September, a rise of 17 days or 36% in four months. Active listings climbed from 8,851 in March to 9,740 in April, 10,375 in May, 10,952 in June and 11,221 in July, a gain of 27%. New listings fell from 5,250 in April to 4,106 in July, a fall of 22% (Realtor.com, new listings).
Listings with a price reduction rose from 4,406 in April to 5,370 in July, an increase of 22% (Realtor.com, price reduced listings). The median listing price was $440,000 in June and $429,000 in August (Realtor.com, median listing price).
Fewer new listings and more cuts, with a longer wait, is the pattern of a region where buyers have gained time. Sedgefield's own wait of 29 days is shorter than the regional 64, which shows that the neighborhood is faster than the region, though the page says it too is slowing. Readers comparing markets can also read the North Hills brief and the Madison Park brief.
Sources: Realtor.com series on FRED as cited. The 36%, 27%, 22% and 22% figures are this brief's arithmetic. Commercial content; not independently verified.
What does a private sale change in a neighborhood where half the homes are rented?
Privacy is the first change. A listing in a neighborhood of 13,943 housing units with 30 for sale puts the home in front of neighbors and investors alike, and the days on market and any cuts become public. A private sale involves no showings and no talk among neighbors about the sale.
A flexible closing date is the second. An owner who is moving, or who is selling an inherited house or a rental after a tenant leaves, can choose a date that suits the plan. No commission and no closing costs are the third and fourth. On a home at $950,000, each 1% is $9,500, and I do not state a rate because none of the sources here gives one.
Avoiding inspections and repairs is the fifth, and in a neighborhood where 42.7% of the homes predate 1980 and 52% of households rent, it carries weight. A rental house that has had several tenants often has wear that an inspector will list, and a seller who sells as is does not have to repair it or credit the buyer.
A public listing may still produce a better price for a renovated home on a good street, and the pages above do not rule it out. They show that listings and waits are rising, that homes sold near 97% of the ask and that three figures that should agree do not.
Before accepting any route, an owner should ask three questions of every buyer and agent. What are the specific sales behind your number, with addresses and dates? What does your offer depend on, and what happens if the loan, the appraisal or the inspection goes wrong? And what will I receive at closing after every charge? In a neighborhood where a value, a sold price and a listing price disagree by a quarter of a million dollars, the answers to those questions are firmer than any median, and a seller who has them in writing can compare offers on equal terms.
Timing deserves a word as well. The regional wait has risen from 47 to 64 days in four months, and the neighborhood's own wait has risen too. A seller who plans to list in a few months should expect the wait to be at least what it is now, and should weigh that against an offer that can close on a date already chosen.
Sources: Realtor.com page and U.S. Census Bureau as cited. The $9,500 figure is this brief's arithmetic for 1% of $950,000. The reasoning about owners is this brief's and not a measured finding.
Methodology and limitations
Values, prices, price per square foot, days on market, listing counts, sale-to-list ratio and rents for Sedgefield come from two commercial pages, a national home-value site updated August 31, 2026 and a national listing site whose text refers to May 2026. They were not independently verified and may use different boundaries.
Age, tenure, vacancy, income, rent and owner-estimated value come from the American Community Survey 2020-2024 five-year estimates for the postal-code area that includes Sedgefield, which is larger than the neighborhood. Shares are calculated from published counts, and owner-estimated value carries a margin of error.
Days on market, active and new listings, median listing price and price reduced counts are Realtor.com series published by the Federal Reserve Bank of St. Louis for the Charlotte-Concord-Gastonia metropolitan area. They describe the region and not the neighborhood. The brief makes no forecast and values no home.
Conclusion
The Sedgefield record shows a value of $704,198, a sold median of $950,625 and a listing median of $939,000 moving in different directions, a rental stock that has grown by more than half in a year and a region where the wait has lengthened by a third.
It does not fix a price for any one home. The choice between a public listing and a private sale comes down to whether an owner would rather compete in that market or take privacy, a flexible closing date, no commission, no closing costs and no inspections or repairs. To see what a direct offer would look like for your home, use the contact form on this page.
Frequently Asked Questions
What is the median home price in Sedgefield?
Realtor.com reports a median sold price of $950,625 and a median listing price of $939,000, while Zillow reports an average home value of $704,198.
Are Sedgefield prices rising or falling?
The pages disagree: Zillow says up 5.3%, the Realtor.com sold median is down 4.94% and the listing median is up 11.45%.
How long do Sedgefield homes take to sell?
Realtor.com reports a median of 29 days, up 38.10% on the year.
Does the Charlotte data describe Sedgefield?
No. It covers a large metropolitan area with a much lower median listing price and shows direction only.
Does a private sale always beat a public listing?
No. A public listing can attract competing bids. A private sale offers privacy, a flexible closing date, no commission, no closing costs and no inspections or repairs.
Compare your options before committing. Request a written private offer for your property, with no obligation, then weigh it against your listing plan.
Sources
- Zillow, 2026. Sedgefield, Charlotte, NC Housing Market. https://www.zillow.com/home-values/276557/sedgefield-charlotte-nc/.
- Realtor.com, 2026. Sedgefield Neighborhood of Charlotte, NC Housing Market. https://www.realtor.com/local/market/north-carolina/charlotte/sedgefield.
- U.S. Census Bureau, 2026. American Community Survey 2020-2024 five-year estimates, the Sedgefield area (via Census Reporter). https://censusreporter.org/profiles/86000US28209-28209/.
- Realtor.com, 2026. Housing Inventory: Median Days on Market in Charlotte-Concord-Gastonia, NC-SC (CBSA). https://fred.stlouisfed.org/series/MEDDAYONMAR16740.
- Realtor.com, 2026. Housing Inventory: Active Listing Count in Charlotte-Concord-Gastonia, NC-SC (CBSA). https://fred.stlouisfed.org/series/ACTLISCOU16740.
- Realtor.com, 2026. Housing Inventory: New Listing Count in Charlotte-Concord-Gastonia, NC-SC (CBSA). https://fred.stlouisfed.org/series/NEWLISCOU16740.
- Realtor.com, 2026. Housing Inventory: Price Reduced Count in Charlotte-Concord-Gastonia, NC-SC (CBSA). https://fred.stlouisfed.org/series/PRIREDCOU16740.
- Realtor.com, 2026. Housing Inventory: Median Listing Price in Charlotte-Concord-Gastonia, NC-SC (CBSA). https://fred.stlouisfed.org/series/MEDLISPRI16740.
Related research

Seller Guide · October 6, 2026
How to Prepare Point Pleasant Beach Rental Records Before Selling
Separate rental approval, income history and booked stays before comparing sale terms.

Seller Guide · October 6, 2026
How to Prepare Rumson Flood and Waterfront Records Before Selling
Separate flood disclosure, elevation, repairs and waterfront rights before comparing sale terms.

Seller Guide · October 6, 2026
How to Prepare Sarasota Condo Inspection and Reserve Records Before Selling
Separate building condition, reserve funding and resale documents before comparing sale terms.