Market Brief · by Aidan Sowa · October 5, 2026
Which of North Hills' Markets Is Your House In? Reading the Rising Median, the Falling Square Foot and the Tower Rezoning
Reading the Rising Median, the Falling Square Foot and the Tower Rezoning for North Hills, NC, with each source dated and its limits noted, for owners weighing a listing against a direct sale.
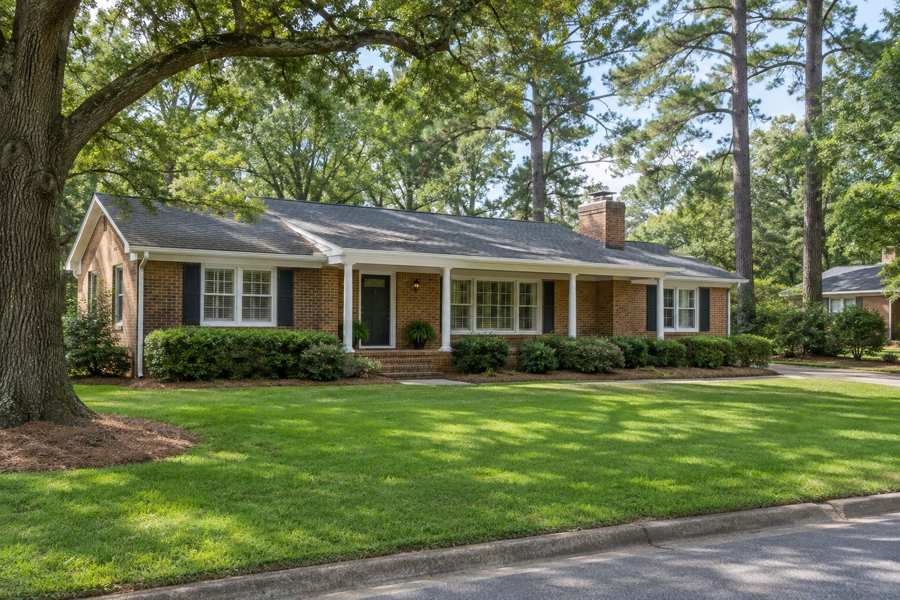
An owner in North Hills who looks up the median home price in 2026 will find several answers. One source says $575,000 for the first quarter. Another says $835,000 for the three months ending in May. A third says $919,000 as of February, and a fourth says $924,656 for April. A Raleigh brokerage wrote in September that none of those numbers is wrong, because the neighborhood is not one market. It is a set of markets sharing a map.
This brief takes that claim seriously. It reads the broker's breakdown of the four product types, the same writer's warning that a median can rise while the price per square foot falls, the January 2026 rezoning that allows taller towers near the neighborhood's retail core, the Census profile of the postal area that includes North Hills, and the Realtor.com series for the Raleigh metropolitan area.
The limits come first. The Census figures cover a postal area that is wider than the neighborhood. The broker's ranges and the news about development are commentary and have not been independently verified. The Realtor.com series cover the whole metropolitan area. Nothing here prices a house.
Key Findings
- A Raleigh broker wrote in September 2026 that North Hills medians ranged from $575,000 to $924,656 in different public sources for the same year, and that condominiums, townhomes, established single-family homes and teardown lots trade in separate ranges (DuBois, September 2026).
- The same article reported that in one snapshot the North Hills median sale price rose 10.4% year over year while the median price per square foot fell 5.5%, and it attributed the gap to a change in the mix of homes that sold.
- In the Census postal area, 9,355 of 20,140 housing units (46.4%) were built before 1980, and the median year built is 1982 (U.S. Census Bureau, 2020-2024).
- The Raleigh metropolitan median days on market rose from 44 in April 2026 to 54 in July (Realtor.com, days on market).
- Active listings in the Raleigh metropolitan area rose from 5,126 in April to 6,024 in August, while new listings fell from 2,980 to 2,220 (Realtor.com, active listings).
Why can four medians all be right?
The September article starts from the confusion. Four sources, one year, one stretch of Midtown Raleigh, and four medians: $575,000, $835,000, $919,000 and $924,656. The writer says none is wrong, and the reason is that North Hills is landlocked and fully built out, stitched together from housing that ranges from 1950s brick ranches to towers still under construction. A single median blending all of that tells you almost nothing about what a specific home is worth.
The sources differ in period and in the set of homes they count. One covers the first quarter and another the three months ending in May. One may include condominiums and another may leave out new construction. The article does not say which is which, and this brief does not guess. What the owner can take from the spread is that the number depends on who is counting and on which homes were counted that month.
Consider how the same neighborhood can produce a low median in one report. If a quarter happens to be heavy with condominium closings, at $300,000 to $385,000 each, the median falls toward the condominium range. If the next quarter is heavy with custom homes on rebuilt lots, the median jumps. Neither quarter says anything about the value of the house on St. Albans that did not sell in either one. The median moves with the mix, and the mix moves with the calendar, the interest rate and the pace of construction.
A spread that wide has a practical use. Before an owner reacts to a median in a news story, a portal or a letter from a neighbor, the first question is what was in it. A median of $575,000 that is built from condominiums and townhomes says nothing about a brick ranch on a quarter acre, and a median of $924,656 that is built from custom infill says nothing about a one-bedroom condominium.
The same logic runs in reverse for a buyer. A buyer who sees $575,000 and hopes for a house in that range will find condominiums. A buyer who sees $924,656 and brings a budget of $600,000 will find a lot with a teardown. The seller who understands which of the four markets the buyer is in has a clearer idea of what the buyer will accept.
Source: Autumn DuBois, September 10, 2026. Medians quoted are the article's statements about other sources and were not independently verified.
What are the four markets?
The article sets out four product types with ranges for 2026, based on the range reported across current listings and closed sales. Condominiums run from roughly $300,000 to $385,000, with a mandatory association, exterior maintenance and amenities included, and often the only entry point under $400,000. Townhomes run from roughly $565,000 to $775,000, mostly newer construction in communities built out between 2018 and 2022. Established single-family homes run from roughly $775,000 to $1.09 million, original 1950s and 1960s construction, sometimes renovated, on lots that predate the shopping district.
The fourth market is the teardown-to-custom product. The article gives $425,000 to $575,000 for the lot and $850,000 to $2.2 million to build, and says that the land, not the house, is what is being purchased. It adds that recent closed sales within the footprint have ranged from the mid-$600,000s to more than $7 million. That is a spread of more than ten to one inside a few square miles.
The writer names the streets that sit in each market. St. Albans has tree-lined blocks of brick ranches and a long-running Fourth of July parade. Anderson Heights has renovated mid-century houses and townhomes reachable by pedestrian paths. Bedford at North Hills is where custom infill has replaced older lots one at a time. An owner can tell which market they are in by asking what the buyer next door paid for, and what the buyer plans to do with it.
Two practical points follow from the four ranges. First, the condominium range of $300,000 to $385,000 and the established single-family range of $775,000 to $1.09 million do not overlap, so a buyer is choosing a product before choosing a price. Second, the townhome range of $565,000 to $775,000 sits between them and is built mainly from newer construction, which means that a buyer who is stretching from a condominium budget is more likely to move to a townhome than to an older house. That tells a single-family seller where the competition is not.
For a seller of an established house, the teardown market is the competitor that matters. If the lot is worth $425,000 to $575,000 and a new house costs $850,000 or more, the buyer who intends to build is looking at a total of $1.3 million or more. The price that buyer will pay for an old house is the finished price less the cost of building, which is a different calculation from the one a family makes who intends to move in.
| Product type | Reported 2026 range | What is being bought |
|---|---|---|
| Condominiums | $300,000 to $385,000 | Association, exterior upkeep and amenities |
| Townhomes | $565,000 to $775,000 | Newer construction, 2018 to 2022 |
| Established single-family | $775,000 to $1.09 million | 1950s and 1960s houses, some renovated |
| Teardown lots | $425,000 to $575,000 plus $850,000 to $2.2 million to build | The land |
Source: Autumn DuBois, September 10, 2026. Brokerage content, not independently verified.
How can the price rise while the square foot falls?
The article's most useful warning is about composition. In one recent snapshot, it reports, the North Hills median sale price rose 10.4% from a year earlier, and in the same window the median price per square foot fell 5.5%. Both statements are true. The explanation is that if more of the closings were larger custom homes or bigger lots, and fewer were smaller condominiums or townhomes, the median price climbs even as the value per square foot softens.
The article places this next to the city as a whole. Raleigh's price per square foot fell roughly 3.4% over a comparable stretch, so the 5.5% decline in North Hills is not a sign that the neighborhood is losing ground faster. It is a sign that the mix of what sold shifted more here than citywide. A median is a statement about the homes that closed, and not about any one home.
The practical conclusion is the one the article draws. The number to use is the median for the owner's product type, on the owner's side of the neighborhood, closed in the last 90 days. A seller of a 1,400 square foot townhome has no use for a median built from teardown sales, and a buyer of a condominium is misled by it. The same applies to an owner who is trying to decide whether to list now or later: if the mix is shifting, last quarter's median is not a clean guide to next quarter's.
There is a simple check an owner can run with the numbers in the article. If a house of 2,000 square feet sold at $1,000,000, the price per square foot was $500. If the median price rises 10.4% and the price per square foot falls 5.5%, then the typical home that sold had to be larger by a factor of about 1.17, since 1.104 divided by 0.945 is 1.168. That is arithmetic on the article's figures, not a measurement, but it shows how big the shift in the mix must have been.
Source: Autumn DuBois, September 10, 2026. The size ratio is calculated from the article's stated percentages and is illustrative only.
What do the towers do to the comparison set?
The article says the comparison problem is about to get harder. In January 2026, it reports, the Raleigh City Council voted 6 to 2 to approve a rezoning that touches more than 11 acres across nine properties near Six Forks Road, Lassiter Mill Road, Rowan Street and The Circle at North Hills. It allows buildings as tall as 37 stories in districts that had been capped at 5, 12 or 20 stories depending on the parcel. The tallest residential building now standing in North Hills, it says, is a 36-story tower at 377 feet.
The developer behind two decades of growth broke ground in January 2026 on a six-story, 332-unit apartment building with 6,000 square feet of ground-level retail at St. Albans Drive and Hardimont Road. That is part of a 28-acre expansion of the innovation district that the developer and a partner acquired for $72 million. Filed plans in the same expansion include 207 units of housing for residents 55 and older and 387 apartments above two levels of parking, according to the article. The approvals included at least 10,000 square feet of open space, a $400,000 contribution to the fire department and $40,000 toward the city's affordable housing fund.
For an owner on a street of 1950s brick ranches, this is neither good nor bad news by itself. More density can raise the value of nearby land, because a lot near towers and shops is more useful to a builder. It can also bring construction noise, traffic and a change in the feel of the block. The article notes that infrastructure has not always kept pace with growth, and says more density changes the comparable-sales pool for years, unevenly by block.
The point for a seller is timing and certainty. A house next to a site that has been rezoned has a different future from one that has not, and buyers who build will price that future. A private buyer who purchases homes off the market has usually thought about it already. An owner who is unsure how the rezoning affects a particular block can ask the city's planning office, or ask the buyer what they assume.
Source: Autumn DuBois, September 10, 2026, reporting Raleigh City Council action and developer filings. Not independently verified.
Who lives in the postal area, and how old are the homes?
The postal area has 35,573 residents and 20,140 housing units, of which 17,592 are occupied. Owners live in 8,767 homes (49.8% of occupied) and renters in 8,825 (50.2%). The other 2,548 units, 12.7% of the total, have no usual resident. Median household income is $83,065, and median gross rent is $1,474 a month, or $17,688 a year, which is 21.3% of the median income.
Owners estimate the median home at $471,200, with a margin of error of $20,367, about 4.3%. That is far below the $775,000 to $1.09 million that the article reports for established single-family homes, and below even its condominium and townhome ranges. The postal area is wider than the neighborhood and includes older, smaller homes and apartments, and owner-estimated values are reported over several years, so they trail asking prices. Half the occupied homes are rented, and a tenant is one more reason that a house may sit empty for a time before a sale.
By age, the 1970s are the largest decade with 4,378 units (21.7%), followed by the 1960s with 3,922 (19.5%) and the 1980s with 3,465 (17.2%). Since 2020, 793 units (3.9%) have been built. Pre-1980 homes number 9,355, or 46.4%, and the median year built is 1982. The 1950s account for only 946 units, about 4.7%, even though the article calls the 1950s and 1960s ranches the heart of the established market. The postal area is mostly a stock of the 1960s to 1980s.
A stock of that age is at the point where roofs, windows and mechanical systems come due. A buyer who inspects a house from 1965 or 1975 will find items, and each item becomes a credit or a delay. An owner who sells as is, to a buyer who does not inspect, avoids that round.
| Indicator | Value | Note |
|---|---|---|
| Population | 35,573 | Whole postal area |
| Housing units | 20,140 | All units |
| Owner-occupied homes | 8,767 | 49.8% of occupied |
| Renter-occupied homes | 8,825 | 50.2% of occupied |
| No usual resident | 2,548 | 12.7% of all units |
| Median household income | $83,065 | Estimate |
| Median gross rent | $1,474 | Monthly |
| Owner-estimated median value | $471,200 | Margin of error $20,367 |
Source: U.S. Census Bureau, American Community Survey 2020-2024 five-year estimates, tables B01003, B19013, B25003, B25034, B25064 and B25077.
What does the Raleigh metro clock say?
Realtor.com publishes listing series for the Raleigh metropolitan area through the Federal Reserve Bank of St. Louis. They show direction and not the level for one neighborhood. The median days on market was 46 in March, 44 in April, 46 in May, 50 in June and 54 in July. That is ten days longer in three months.
Active listings rose every month from April, when there were 5,126, to May at 5,593, June at 5,788, July at 5,964 and August at 6,024. New listings moved the other way: 2,980 in April, 2,916 in May, 2,670 in June, 2,456 in July and 2,220 in August (Realtor.com, new listings). More homes were sitting and fewer were arriving, which is what a slowing market looks like from the supply side.
The median listing price eased from $457,500 in May to $457,000 in June, $450,000 in July and August and $445,000 in September (Realtor.com, median listing price). The count of listings with a price reduction rose from 2,242 in April to 2,824 in July and 2,716 in August (Realtor.com, price reduced listings). That is a count and not a share, but it rose while active listings rose more slowly, which fits a market in which more sellers were adjusting.
The metro median listing price of $445,000 sits below even the lowest of the neighborhood's townhome ranges, which is a reminder that the neighborhood is a premium pocket in a larger market. The direction is still informative. A slower clock and more inventory metro-wide are the setting for a North Hills seller, even if the neighborhood's own clock differs. Readers comparing markets can also read the North Raleigh brief and the Sedgefield brief.
Source: Realtor.com via FRED, Housing Inventory: Median Days on Market, Active Listing Count, New Listing Count, Median Listing Price and Price Reduced Count, Raleigh, NC (CBSA). The days on market series ends in July 2026, the count series in August 2026 and the listing price series in September 2026.
What would a private sale change in North Hills?
A direct sale to a buyer who purchases homes off the market changes five things for the seller. There are no showings and no neighbors talking about you selling, which is the privacy benefit on a street where the neighbors have known each other for decades. The closing date can be flexible, giving time to find a new home. There are no commission costs and no closing costs for the seller. And there are no inspections or repairs, which matters for a house from the 1960s or 1970s.
The fee benefit needs no assumed rate. For every 1% of a sale price that would otherwise go to fees, a sale at $400,000 keeps $4,000, a sale at $925,000 keeps $9,250 and a sale at $1,090,000 keeps $10,900. An owner can set whatever percentage applies against a private offer and compare the two on net proceeds.
The teardown market gives the private buyer a reason to pay for a house as is. A builder who plans to demolish does not care about the kitchen, and so repairs and staging are money the seller spends for no return. An owner of an established house should ask whether the likely buyer is a family or a builder, and price the preparation accordingly.
The trade-off is the usual one. A public listing can bring competing bids, and in a neighborhood with four markets one of them may produce a strong bid. A private sale brings one offer, on a date the seller chooses. An owner who values privacy, a settled date and freedom from repairs may prefer it. The choice belongs to the owner.
Source: calculation from stated prices; no commission rate or closing cost is assumed.
Methodology and limitations
Age, tenure, vacancy, income, rent, population and owner-estimated value come from the American Community Survey 2020-2024 five-year estimates for the postal-code area that includes North Hills. The area is wider than the neighborhood. Shares are calculated from published counts, and owner-estimated value carries a stated margin of error.
Days on market, active listings, new listings, median listing price and price reduced counts are Realtor.com series published by the Federal Reserve Bank of St. Louis for the Raleigh metropolitan area. Listing prices are asking prices and not sale prices.
The broker article is commentary. Its product ranges, medians, rezoning details and developer filings were not independently verified. The size ratio is arithmetic on stated percentages. The brief makes no forecast and does not estimate what any particular home would sell for.
Conclusion
The public record supports a short list for a North Hills owner. Four medians in one year reflect four product types, a median can rise while the price per square foot falls, a rezoning for towers will change the comparison set on nearby blocks, and the metropolitan clock slowed through the summer of 2026.
It does not support a price for any one house, and it does not support a forecast. The choice between a public listing and a private sale comes down to how much an owner values a possible higher price against privacy, a flexible closing date, no commission, no closing costs and no inspections or repairs.
Frequently Asked Questions
Why are there so many different medians for North Hills?
The neighborhood mixes condominiums, townhomes, established houses and teardown lots, and each source counts a different period and set of homes.
Can the median price rise while the price per square foot falls?
Yes. If larger homes make up more of the closings, the median price climbs even as the price per square foot softens.
What did the 2026 rezoning change?
According to the broker's article, it allows buildings as tall as 37 stories on nine properties that had lower caps.
Does the metro listing data describe North Hills?
No. It covers the Raleigh metropolitan area and shows direction only.
Does a private sale always beat a public listing?
No. A public listing can attract competing bids. A private sale offers privacy, a flexible closing date, no commission, no closing costs and no inspections or repairs, in exchange for a single offer.
Compare your options before committing. Request a written private offer for your property, with no obligation, then weigh it against your listing plan.
Sources
- Autumn DuBois, 2026. North Hills Doesn't Have One Housing Market. It Has Four Of Them.. https://duboispropertygroup.com/blog/north-hills-doesnt-have-one-housing-market-it-has-four-of-them.
- U.S. Census Bureau, 2026. American Community Survey 2020-2024 five-year estimates, the North Hills area (via Census Reporter). https://censusreporter.org/profiles/86000US27609-27609/.
- Realtor.com, 2026. Housing Inventory: Median Days on Market in Raleigh, NC (CBSA). https://fred.stlouisfed.org/series/MEDDAYONMAR39580.
- Realtor.com, 2026. Housing Inventory: Active Listing Count in Raleigh, NC (CBSA). https://fred.stlouisfed.org/series/ACTLISCOU39580.
- Realtor.com, 2026. Housing Inventory: New Listing Count in Raleigh, NC (CBSA). https://fred.stlouisfed.org/series/NEWLISCOU39580.
- Realtor.com, 2026. Housing Inventory: Median Listing Price in Raleigh, NC (CBSA). https://fred.stlouisfed.org/series/MEDLISPRI39580.
- Realtor.com, 2026. Housing Inventory: Price Reduced Count in Raleigh, NC (CBSA). https://fred.stlouisfed.org/series/PRIREDCOU39580.
Related research

Seller Guide · October 6, 2026
How to Prepare Point Pleasant Beach Rental Records Before Selling
Separate rental approval, income history and booked stays before comparing sale terms.

Seller Guide · October 6, 2026
How to Prepare Rumson Flood and Waterfront Records Before Selling
Separate flood disclosure, elevation, repairs and waterfront rights before comparing sale terms.

Seller Guide · October 6, 2026
How to Prepare Sarasota Condo Inspection and Reserve Records Before Selling
Separate building condition, reserve funding and resale documents before comparing sale terms.