Market Brief · by Aidan Sowa · October 5, 2026
What Is a Madison Park House Worth When Its Market Page Stopped Updating? Reading a Median From May of Two Years Ago and a Median From September
Reading a Median From May of Two Years Ago and a Median From September for Madison Park, NC, with each source dated and its limits noted, for owners weighing a listing against a direct sale.
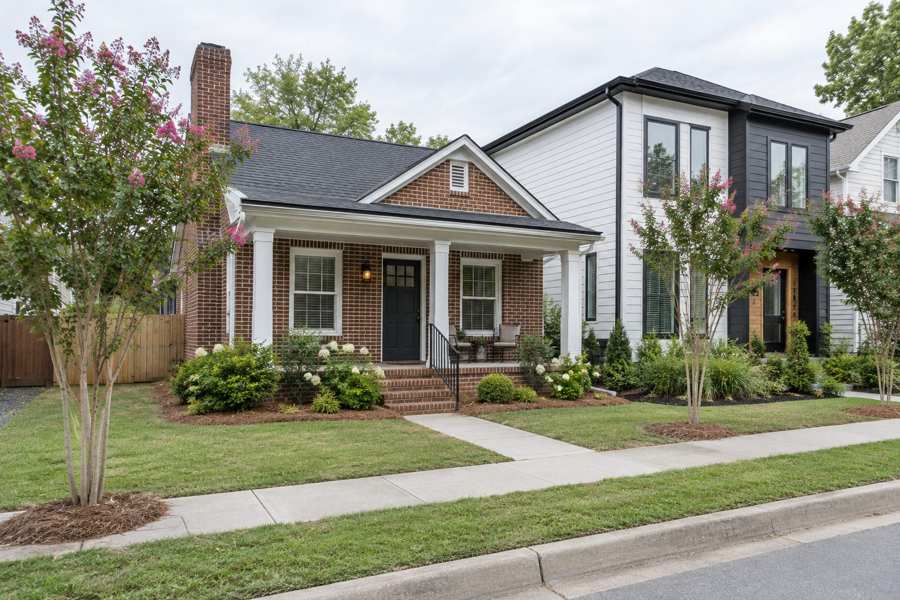
Search for Madison Park, Charlotte, and the first page that appears may be one that stopped in May 2024. A brokerage page for the neighborhood still reads, in its present tense, that Madison Park is very competitive, that the median sale price was $620,000, up 9.5%, that the price per square foot was $411, up 26.1%, and that homes took 31 days to sell. The text says May 2024.
A Realtor.com page with indicators as of September 2026 gives a median sold price of $530,000, down 5.36% on the year and down 16.14% on the month, a price per square foot of $285, down 8.35%, and a median of 52 days on the market, up 41.89%. The median listing price is $483,000, down 12.09%.
The gap between the two is $90,000, which is 14.5% of the older figure, and the price per square foot is 31% lower. Part of it is time, since 28 months separate the pages. Part of it may be a real fall. This brief reads the pages together with the Census profile of the postal area that includes Madison Park and a Realtor.com series for the Charlotte area, and asks what an owner can responsibly conclude. It then sets out what a private sale changes.
Key Findings
- A brokerage page whose text describes May 2024 reported a Madison Park median sale price of $620,000 (up 9.5%), $411 per square foot (up 26.1%), 31 days on market against 29 and 38 homes sold against 40, and called the market very competitive (Redfin, Madison Park). The text I read is more than two years old.
- Realtor.com, with indicators as of September 2026, reported a median listing price of $483,000 (down 12.09% on the year), a median sold price of $530,000 (down 5.36%), $285 per square foot (down 8.35%), 35 active listings (up 20.69%), a median of 52 days on market (up 41.89%), 118 rental properties and a median rent of $1,591 a month (down 1.85%), with a sale-to-list ratio of 100% (Realtor.com, Madison Park).
- In the Census postal area, 4,687 of 13,943 housing units (33.6%) were built since 2010, owners occupy 6,136 of 12,793 occupied homes (48.0%) and the owner-estimated median value is $623,000 (U.S. Census Bureau, 2020-2024).
- In the Charlotte-Concord-Gastonia area the median days on market rose from 47 in May 2026 to 64 in September (Realtor.com, days on market).
- The Charlotte area had 8,851 active listings in March 2026 and 11,221 in July (Realtor.com, active listings).
What does it mean when a page is two years old?
A page that carries a figure and a date is honest, and a page that carries a figure in the present tense and a date in small print is easy to misread. The Madison Park page I read describes May 2024 in its own text, and so $620,000 is a price from that month. Its claim that the market is very competitive describes that month too.
The risk for a seller is plain. An owner who sees $620,000 and $411 a foot may price a home by them, and a buyer who sees the 2026 figures of $530,000 and $285 will not agree. The listing sits, the wait grows and the price is cut. The cost of the old number is the days spent finding out that it was old.
There is a second risk for those who rely on summaries. A summary of search results can say that the median is $620,000 and up 9.5% without saying that the date is May 2024. This brief states the date each time for that reason.
Check the date of a page before reading any figure from it. If the date is not shown, look for a month and year in the text, and if none appears, treat the page as undated.
| Measure | May 2024 page | September 2026 page |
|---|---|---|
| Median sale price | $620,000 (up 9.5%) | $530,000 (down 5.36%) |
| Price per square foot | $411 (up 26.1%) | $285 (down 8.35%) |
| Days on market | 31 (29 a year earlier) | 52 (up 41.89%) |
| Homes sold or listed | 38 sold in the month | 35 active listings |
| Market label | Very competitive | Sale-to-list ratio of 100% |
Sources: Redfin and Realtor.com pages as cited. Commercial content; not independently verified.
How much has the price really changed?
Between May 2024 and September 2026, the median sale price on the two pages fell by $90,000, from $620,000 to $530,000, a fall of 14.5%. The price per square foot fell from $411 to $285, a fall of 31%. The wait rose from 31 days to 52, an increase of 21 days or 68%.
These comparisons join two sources with different methods, boundaries and sample sizes, and a median of a few dozen sales moves with the sales. A fall of 14.5% is therefore a signal and not a measurement. The Realtor.com page offers a check. It reports a median sold price down 5.36% on the year, which puts the figure a year ago near $560,000, and its listing median is down 12.09% on the year, which puts last year's listing median near $549,400. If those are right, prices were already below the May 2024 page a year ago.
The monthly change on the page is down 16.14%, which means the median sold price in the prior month was about $632,000. A fall of that size in a month is a sign of a small sample, and the figure should not be read as a trend.
The safest reading is that Madison Park prices are lower than the older page shows, probably by something between 5% and 15%, with a wide margin for error. A seller who wants a closer figure needs recent sales of similar homes nearby.
It is worth saying what this comparison cannot do. It cannot tell an owner whether prices have stopped falling, since the newest page gives one month and a monthly fall of 16.14% followed by a rebound is as likely as a continued slide. It cannot say whether the older page was ever typical, since a median of 38 sales in a month can be pulled by a few large houses. And it cannot say what any one home is worth. What it can do is show that the figure still circulating is out of date, which is reason enough to ask for a fresh comparison before setting a price.
Sources: Redfin and Realtor.com pages as cited. The $90,000, 14.5%, 31%, 68%, $560,000, $549,400 and $632,000 figures are this brief's arithmetic from the published numbers. Commercial content; not independently verified.
How do old pages stay at the top of a search?
A page that has been linked for years collects the signals that search engines read as authority. It stays near the top long after its figures stop updating. A brokerage may also leave a neighborhood page alone when the number of sales in the area is too small to calculate a new median each month, and the last figure remains on the page.
The effect is that the page most likely to be read is not always the page most likely to be right. An owner who searches for the neighborhood and clicks the first result may get a snapshot of a market that no longer exists. The same happens to a buyer, and to an agent who copies a figure into a listing presentation.
The remedy is slow and dull. Read the date. Compare two sources. Look at the count of sales. If the sources disagree by more than 10%, look for a reason before choosing one. This brief found the disagreement by placing the two pages side by side, and found its cause in the dates.
There is a gain in this for a seller. An owner who knows that the old figure is stale can set expectations before a buyer does, and can answer an offer that is below the old number with the reason.
Sources: Redfin and Realtor.com pages as cited. The reasoning about search and pages is this brief's and not a finding. Commercial content; not independently verified.
What do 35 listings and 52 days tell a seller?
The Realtor.com page reports 35 active listings, up 20.69% on the year, so a year earlier there were about 29. The median wait is 52 days, up 41.89%, so a year earlier it was about 37 days. The sale-to-list ratio is 100%, which means that homes sold at about the asking price on average.
The page also contains its own tension. It describes the supply of 35 listings as tight, though the count is up by a fifth, and it labels the market warm, though the median listing price is down by 12%. A page that is built from templates can say two things that do not fit together, and a reader should hold the figures and not the labels.
A ratio of 100% with a wait of 52 days is the pattern of homes that are priced to the market and wait for the right buyer. It differs from the pattern in which homes are listed high and cut. The page does not give the share of listings with a cut, and the Charlotte series, below, does so for the region.
For an owner, this says that a home priced to the market will probably sell near its ask, after a wait of about two months. A home priced above the market will wait longer. In both cases the seller pays for the time.
Source: Realtor.com page as cited. The 29-listing and 37-day figures are this brief's arithmetic from the published changes. Commercial content; not independently verified.
What should a seller of a 1950s house prepare for?
In the postal area, 2,170 homes (15.6%) were built in the 1950s and 1,488 (10.7%) in the 1960s. Madison Park's older brick houses belong to those decades. A house of that age often has original or old wiring, a heating system that has been replaced once or twice, a roof of an unknown age and plumbing that may include older materials. I have no source for the condition of Madison Park homes, so this is a general point and not a finding.
A buyer's inspector reads these items and a buyer's agent turns them into a request. The request may be for a lower price, for a credit at closing or for repairs. Each has a cost to the seller, in money or in time. A seller who knows the age of the roof, the heating and the panel, and who has any records of past work, can answer the request quickly.
A seller of an older house in a neighborhood with new building next door should also expect a buyer who values the lot more than the house. Builders and investors read the lot, the zoning and the cost of tearing down and building, and they value the house at little. For such a buyer, the price depends on the land, and an inspection matters less.
A sale to a buyer who purchases as is meets that case directly. The seller does not repair, does not host showings and does not wait for an inspection report, and the price is agreed once.
Source: U.S. Census Bureau as cited. The points about older houses are this brief's general reasoning and not findings about Madison Park.
What does the Census say about homes around Madison Park?
The Census profile describes the postal area that includes Madison Park. It counts 24,331 people and 13,943 housing units, of which 12,793 are occupied and 1,150 are vacant, a vacancy rate of 8.2%. Owners live in 6,136 homes (48.0%) and renters in 6,657 (52.0%). Median household income is $101,873 and median gross rent is $1,710 a month.
New building stands out. Of all housing units, 4,064 (29.1%) were built in the 2010s and 623 (4.5%) since 2020, so 4,687 (33.6%) are less than sixteen years old. The median year built is 1989. Madison Park's modest brick homes of the 1950s and 1960s sit among them, and the postal area has 3,658 homes (26.2%) from those two decades.
Owners estimate the median home at $623,000, with a margin of error of $50,200, or 8.1%. That is 18% above the $530,000 median sold price on the Realtor.com page, which is unusual, since owner estimates normally trail the market. The postal area includes more expensive neighborhoods than Madison Park, which is the likely reason, though the pages do not say.
The owner-estimated value is 6.1 times the median household income. A neighborhood where more than half of households rent, and a third of homes are new, draws investors and builders, and a seller of an older house may find that the likeliest buyer is one of them.
| Indicator | Value | Note |
|---|---|---|
| Population | 24,331 | Whole postal area |
| Housing units | 13,943 | All units |
| Built since 2010 | 4,687 | 33.6% of all units |
| Owner-occupied homes | 6,136 | 48.0% of occupied |
| Median household income | $101,873 | Estimate |
| Median gross rent | $1,710 | Per month |
| Owner-estimated median value | $623,000 | Margin of error $50,200 |
| Median year built | 1989 | Estimate |
Source: U.S. Census Bureau, American Community Survey 2020-2024 five-year estimates. The 3,658, 26.2%, 18% and 6.1 figures are this brief's arithmetic.
What does a median rent of $1,591 say about holding the home?
Realtor.com reports a median rent of $1,591 a month in Madison Park, down 1.85% on the year, from 118 rental properties, a number that fell 12.82% on the month and is up 16.57% on the year. A year of that rent is $19,092. Against the median sold price of $530,000, that is 3.6% a year before taxes, insurance, repairs, vacancy and management. The Census median rent for the postal area is $1,710, so the page's figure is 7% lower.
The rent is falling while the number of rentals grows. That is the pattern of a rental market with more supply than demand, and it speaks to an owner who thinks of renting a home instead of selling it. A landlord in such a market may wait longer for a tenant and may have to cut the rent. The sources here do not give vacancy for rentals or the cost of upkeep, and I do not estimate them.
Half of the occupied homes in the postal area are rented, 52.0%, and a third of the housing is new. A landlord with an older house competes with new rentals that need less repair. That is a reason for some owners to sell instead.
An owner who wants to leave a rental house behind, or who has inherited one, has a direct way to do it. A sale to a buyer who takes the house as it is ends the costs on a date the owner chooses.
Sources: Realtor.com page and U.S. Census Bureau as cited. The $19,092, 3.6% and 7% figures are this brief's arithmetic. Commercial content; not independently verified.
What does the Charlotte series say about the climate?
The Charlotte-Concord-Gastonia series from Realtor.com, published by the Federal Reserve Bank of St. Louis, covers the whole region, with a median listing price near $430,000. Madison Park's listing median of $483,000 is 12% above it. The series cannot describe the neighborhood, and gives direction.
Median days on market rose from 47 in May to 51 in June, 57 in July, 61 in August and 64 in September, which is 17 days or 36%. Active listings rose from 8,851 in March to 11,221 in July, a gain of 27%. Listings with a price reduction rose from 4,406 in April to 5,370 in July (Realtor.com, price reduced listings), an increase of 22%, so that in July about 48% of the 11,221 active listings carried a reduction, if the two series count the same homes, which they are not promised to do.
A region where the wait grows by a third in four months and nearly half of listings are cut is a region where buyers have the upper hand. Madison Park's 52 days are shorter than the regional 64, but the page shows the same direction.
The conclusion for a seller is that the older page's picture of a very competitive market belongs to an earlier time. Readers comparing markets can also read the Sedgefield brief and the Providence Plantation brief.
Sources: Realtor.com series on FRED as cited. The 12%, 36%, 27%, 22% and 48% figures are this brief's arithmetic. Commercial content; not independently verified.
What does a private sale change when the numbers are stale or thin?
A private sale does not depend on which page is right. A buyer who buys directly looks at the home and offers a price, and the seller can accept or refuse. There is no listing to go stale and no median to defend.
Privacy is the first change, with no showings and no talk among neighbors about the sale. A flexible closing date is the second. No commission and no closing costs are the third and fourth. On a home at $530,000, each 1% is $5,300, and I do not state a rate because no source here gives one. Avoiding inspections and repairs is the fifth, and in an area where 42.7% of homes predate 1980 it matters.
A public listing can still be right for a renovated home on a good street, where buyers may compete. The pages above do not rule that out. They show that prices are probably below the figures that an old page still displays, that supply and waits are rising and that an owner who plans around a stale number pays for it in time.
Whatever the route, an owner should write down the lowest net amount that would be acceptable, after every charge, before looking at any offer. Offers in a market with stale and thin data will vary widely, and a number set in advance protects against being pulled toward whichever figure a buyer chooses to quote. Ask each buyer to put the price, the closing date and every condition in writing, and compare the offers on what the seller would receive and when.
It also helps to ask a buyer what they know about the street. A buyer who has bought nearby recently, or who owns rentals in the area, may have a clearer view of what homes are worth than any page, and may pay for the certainty of a quick, quiet sale. A buyer who has seen only a median is a weaker guide.
Sources: Realtor.com page and U.S. Census Bureau as cited. The $5,300 figure is this brief's arithmetic for 1% of $530,000. The reasoning about owners is this brief's and not a measured finding.
Methodology and limitations
Prices, price per square foot, days on market, listing counts, sale-to-list ratio and rents for Madison Park come from two commercial pages: a brokerage page whose text describes May 2024 and a national listing site with indicators as of September 2026. They were not independently verified, and the first is out of date.
Age, tenure, vacancy, income, rent and owner-estimated value come from the American Community Survey 2020-2024 five-year estimates for the postal-code area that includes Madison Park, which is larger than the neighborhood. Shares are calculated from published counts, and owner-estimated value carries a margin of error.
Days on market, active listings and price reduced counts are Realtor.com series published by the Federal Reserve Bank of St. Louis for the Charlotte-Concord-Gastonia metropolitan area. They describe the region and not the neighborhood. The brief makes no forecast and values no home.
Conclusion
The Madison Park record shows a page that stopped at May 2024 with a $620,000 median, a 2026 page with $530,000 and $285 a foot, a wait that has lengthened to 52 days and a region in which waits and cuts are rising.
It does not fix a price for any one home. The choice between a public listing and a private sale comes down to whether an owner would rather compete in that market or take privacy, a flexible closing date, no commission, no closing costs and no inspections or repairs. To see what a direct offer would look like for your home, use the contact form on this page.
Frequently Asked Questions
What is the median home price in Madison Park, Charlotte?
Realtor.com reports a median sold price of $530,000 as of September 2026. An older brokerage page shows $620,000 for May 2024.
Why do the pages differ?
One describes May 2024 and the other September 2026, and prices appear to have fallen in between, though the sales behind each are few.
How long do Madison Park homes take to sell?
Realtor.com reports a median of 52 days, up 41.89% on the year.
Does the Charlotte data describe Madison Park?
No. It covers a large metropolitan area with a lower median listing price and shows direction only.
Does a private sale always beat a public listing?
No. A public listing can attract competing bids. A private sale offers privacy, a flexible closing date, no commission, no closing costs and no inspections or repairs.
Compare your options before committing. Request a written private offer for your property, with no obligation, then weigh it against your listing plan.
Sources
- Redfin, 2024. Madison Park, NC Housing Market. https://www.redfin.com/neighborhood/50563/NC/Charlotte/Madison-Park/housing-market.
- Realtor.com, 2026. Madison Park Neighborhood of Charlotte, NC Housing Market. https://www.realtor.com/local/market/north-carolina/charlotte/madison-park.
- U.S. Census Bureau, 2026. American Community Survey 2020-2024 five-year estimates, the Madison Park area (via Census Reporter). https://censusreporter.org/profiles/86000US28209-28209/.
- Realtor.com, 2026. Housing Inventory: Median Days on Market in Charlotte-Concord-Gastonia, NC-SC (CBSA). https://fred.stlouisfed.org/series/MEDDAYONMAR16740.
- Realtor.com, 2026. Housing Inventory: Active Listing Count in Charlotte-Concord-Gastonia, NC-SC (CBSA). https://fred.stlouisfed.org/series/ACTLISCOU16740.
- Realtor.com, 2026. Housing Inventory: Price Reduced Count in Charlotte-Concord-Gastonia, NC-SC (CBSA). https://fred.stlouisfed.org/series/PRIREDCOU16740.
Related research

Seller Guide · October 6, 2026
How to Prepare Point Pleasant Beach Rental Records Before Selling
Separate rental approval, income history and booked stays before comparing sale terms.

Seller Guide · October 6, 2026
How to Prepare Rumson Flood and Waterfront Records Before Selling
Separate flood disclosure, elevation, repairs and waterfront rights before comparing sale terms.

Seller Guide · October 6, 2026
How to Prepare Sarasota Condo Inspection and Reserve Records Before Selling
Separate building condition, reserve funding and resale documents before comparing sale terms.