Market Brief · by Aidan Sowa · October 5, 2026
Which Providence Plantation Homes Are in a Named Neighborhood? Reading Homes for Sale and Those Named by Neighborhood
Reading Homes for Sale and Those Named by Neighborhood for Providence Plantation, NC, with each source dated and its limits noted, for owners weighing a listing against a direct sale.
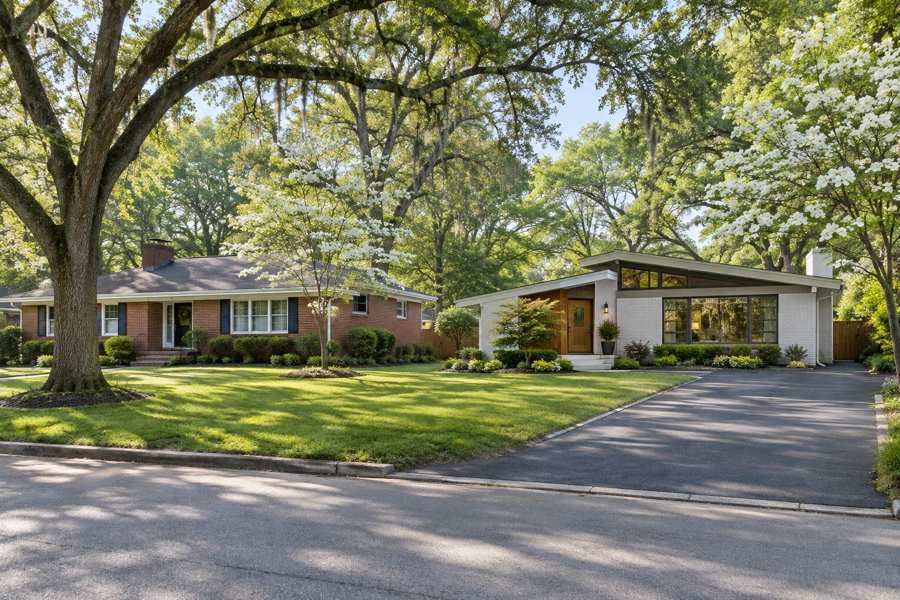
How many homes are for sale in Providence Plantation? Realtor.com says 35. How much does the typical one cost? It says $925,000, which is 7.03% less than a month earlier and 10.78% more than a year earlier. Its median sold price is $917,500, and its sale-to-list ratio is 100%, so homes sell for about what they are asked. On those lines the page calls the neighborhood a hot, seller's market. Yet the median wait is 53 days, which is 43.24% longer than a year before.
A market that moves in two directions at once is usually a market with too few homes to say. A median of 35 homes can swing by $70,000 in a month because one or two houses entered or left the list. The same page lists fifteen neighborhoods inside Providence Plantation, and the homes for sale in all of them add up to 15. The other 20 homes, 57.1% of the 35, belong to none of them.
This brief reads that page beside the Redfin page for the postal area, the Census profile and the Realtor.com series for the Charlotte region. It asks what a median of 35 homes can tell an owner, what the postal area adds and what a private sale changes for a seller who would rather not rely on a hot label.
Key Findings
- Realtor.com reported, as of September 2026, a median listing price of $925,000 (down 7.03% on the month and up 10.78% on the year), a median sold price of $917,500 (down 1.87% and up 6.69%), $274 per square foot (down 7.28% and up 0.60%), 35 active listings (down 11.43% and down 6.06%) and a median of 53 days on market (up 9.28% and up 43.24%). The table headers on that page read MoM Change and 1Y Change (Realtor.com, Providence Plantation).
- The same page gave a sale-to-list ratio of 100%, called the neighborhood a seller's market and a hot market, and showed seven rentals, up 150% on the month. It showed no median rent for the neighborhood.
- Redfin reported, for the postal area that includes Providence Plantation, a median sale price of $700,000 over the three months to May 2026 (up 11.1% on the year), $279 per square foot (down 1.9%), 36 days on market against 34 a year earlier and 152 homes sold in May against 157. It called the area very competitive (Redfin, postal area).
- In the same postal area, 12,148 of 12,548 housing units are occupied, only 400 (3.2%) are vacant, owners hold 9,335 of the occupied homes (76.8%), the median year built is 1992 and the owner-estimated median home value is $589,500 (U.S. Census Bureau, 2020-2024).
- In the Charlotte-Concord-Gastonia area the median days on market rose from 47 in May 2026 to 64 in September (Realtor.com, days on market).
Can a median of 35 homes be trusted?
It can describe the 35, and it says much less about the next one. A median is the middle of a list. With 35 homes, it is the eighteenth, and moving two or three homes from the top of the list to the bottom changes it noticeably. The Realtor.com page shows how large the change can be: the median listing price fell 7.03% in a month, which means it was about $995,000 in August and $925,000 in September, a change of about $70,000 that is arithmetic from the stated percentage.
The other measures on the page jump in a similar way. The median price per square foot fell 7.28% in the month while the median sold price fell only 1.87%. The count of active listings fell 11.43%, which is four or five homes. The number of rentals rose 150%, which is from about three to seven. None of these is a trend. Each is what happens when a few homes enter or leave a small count.
The year on year figures are steadier, though they rest on the same small base. The median listing price is up 10.78% on the year, which implies a median of about $835,000 a year earlier, and the median sold price is up 6.69%, which implies about $860,000. The wait rose from about 37 days to 53. These suggest a neighborhood that is moving up in price and slowing in pace, and that is not the picture a label of hot gives.
An owner should read the page as a sketch. A median of 35 homes says that the typical home listed here is priced in the high $800,000s to low $900,000s, and that a home takes about seven or eight weeks to sell. It does not say what the house two doors down fetched, and the neighborhood has too few sales in any month for a median of sales to be firm.
| Indicator | Level | 1 month change | 1 year change |
|---|---|---|---|
| Median listing price | $925,000 | -7.03% | 10.78% |
| Median sold price | $917,500 | -1.87% | 6.69% |
| Price per square foot | $274 | -7.28% | 0.60% |
| Active listings | 35 | -11.43% | -6.06% |
| Median days on market | 53 | 9.28% | 43.24% |
| Rentals | 7 | 150% | 0% |
Source: Realtor.com page as cited. The $995,000, $70,000, $835,000, $860,000 and 37 day figures are this brief's arithmetic from the stated changes. Commercial content; not independently verified.
Which neighborhood inside Providence Plantation has the homes for sale?
The Realtor.com page lists fifteen neighborhoods in and around Providence Plantation. Tara at Providence Plantation has four homes for sale. Camelot has three, down 25%. Brettonwood at Providence Plantation, Lakeside Acres and Providence Plantation South have two each. Hemlock Pines and Providence Forest have one each. The other eight, among them Drayton Hall, Gilbert Grove, Hampton Oaks, Linden Oaks and Whitemore, have none.
The seven rows with homes add up to 15, and the headline count is 35. The 20 homes in the gap, 57.1% of the total, are not assigned to any of these neighborhoods in the data. The likeliest reason is that listings are tied to a subdivision only when the listing names one, and many do not. A second is that the headline covers a wider area than the table. The page does not say which.
For an owner, the useful fact is how few homes sit in any one subdivision. The biggest has four. A buyer who wants Camelot sees three homes, and a buyer who wants Whitemore sees none. A seller in a small subdivision does not compete with the whole neighborhood. The seller competes with the two or three homes that a buyer might compare, and those are the ones a page like this cannot list.
The page also shows two homes for rent, one in Lakeside Acres and one in McKee Plantation, against the seven rentals in the headline. It is the same pattern, with the table showing less than the total.
Source: Realtor.com page as cited. The 15, 20 and 57.1% figures are this brief's arithmetic. The explanation of the gap is this brief's reasoning and not a statement of the page. Commercial content; not independently verified.
What does the postal area add?
The Realtor.com page also gives figures for the postal area that includes Providence Plantation. Its median listing price is $785,000 at $279 per square foot, with a median rent of $1,667 a month. It has 160 homes for sale, up 6.25% on the year, and 154 for rent, down 5.78% on the month. Its median days on market is 53, up 29.27% on the year. The 35 homes in Providence Plantation are 21.9% of the 160.
The neighborhood's listing median of $925,000 is $140,000, or 17.8%, above the postal area median of $785,000. The price per square foot tells another story: $274 for the neighborhood against $279 for the area. The neighborhood's homes are dearer in total and not in each foot, which points to larger homes. A rough division gives a typical listing of about 3,380 square feet against about 2,810 for the area, though that is a ratio of medians and not a measured size.
Redfin's page for the same postal area is the sharpest contrast. It puts the median sale price at $700,000 for the three months to May 2026, up 11.1%, and the wait at 36 days against 34. It calls the area very competitive and says that homes sell in about 35 days. The Realtor.com wait for the same area is 53 days. The two companies count different things, in different months, and an owner who hears 35 days from one and 53 from another is hearing about the same place.
The gap between $700,000 and $917,500 should not be read as a gap between the postal area and the neighborhood. The first covers three months in a larger area, and the second covers one month in the neighborhood. A fair reading is that the larger area sells in the $700,000s and the neighborhood sells in the $900,000s, and that the second reflects larger homes in a small number of sales.
| Measure | Providence Plantation | Postal area |
|---|---|---|
| Median listing price | $925,000 | $785,000 |
| Price per square foot | $274 | $279 |
| Homes for sale | 35 | 160 |
| Median days on market | 53 | 53 |
| Rentals | 7 | 154 |
Source: Realtor.com and Redfin pages as cited. The 21.9%, $140,000, 17.8% and square foot figures are this brief's arithmetic. The square foot figures are a ratio of medians and not a measurement. Commercial content; not independently verified.
Is a hot, seller's market what the numbers show?
The Realtor.com page uses three labels. It calls the neighborhood a hot market on its Hotness Index, a seller's market for September 2026 and a place where supply is limited. The evidence given is a sale-to-list ratio of 100% and 35 homes for sale. Homes sell for about their asking price, and there are fewer homes than buyers.
The same page shows the wait up 43.24% on the year, which is not what a market gaining heat looks like. A rise from about 37 days to 53 means homes are taking more than four additional weeks in total, and four extra weeks is a month of carrying costs for the seller. The label hot rests on the Hotness Index, which compares the area with others, and 53 days is still a quick sale in many places.
The numbers are better described as a firm market that is slowing. Sellers are still getting asking price, which is why the sale-to-list ratio stands at 100%. Listing prices are rising on the year, and sales prices are rising more slowly. Meanwhile the time to sell is lengthening. That is a market in which a well priced home sells and an overpriced home waits.
For a seller, the practical lesson is about price. If asking price and sale price are the same, the sale price depends on getting the asking price right. An owner who lists high in a market that sells at 100% of list may wait the extra weeks that the data show are growing.
Source: Realtor.com page as cited. The interpretation is this brief's reasoning. Commercial content; not independently verified.
What does the Census add about who lives here?
In the postal area that includes Providence Plantation, 12,148 of 12,548 homes are occupied, so only 400, or 3.2%, are vacant. That is a tight market in the plainest sense: almost every home has someone in it. Owners hold 9,335 of the occupied homes, 76.8%, and renters 2,813, 23.2%. The population is 32,448, or about 2.67 per occupied home, and the median household income is $131,667.
The stock is mostly from the 1980s and 1990s. The Census counts 3,814 homes from the 1990s (30.4%), 2,984 from the 1980s (23.8%), 1,828 from the 2000s (14.6%), 1,213 from the 2010s (9.7%) and 340 since 2020 (2.7%). Only 2,369 homes, 18.9%, date from before 1980, and the median year built is 1992. It is a mature suburban stock, and most of it is 25 to 45 years old.
For owners of those homes, age matters at inspection. A roof, a heating system or a set of windows from the 1990s may be reaching the end of its useful life, and a buyer's inspector will list them. Avoiding inspections and repairs is one of the five benefits of selling off the market, and it matters most for homes of this age.
The owner-estimated median home value in the Census is $589,500, with a margin of error of $17,867. The Realtor.com sold median for the neighborhood is $917,500, which is $328,000 or 55.6% above the Census figure, and the postal area listing median is $785,000, $195,500 or 33.2% above it. The Census value is an average of what owners thought between 2020 and 2024 across the whole area, and the pages cover recent months in specific places. A gap of this kind is what rising prices produce, and not proof of any particular price.
Source: U.S. Census Bureau, American Community Survey 2020-2024, and Realtor.com as cited. Shares and gaps are this brief's arithmetic.
What does the Charlotte series add?
The neighborhood figures end in September. The Charlotte-Concord-Gastonia series describe the whole region and do not describe Providence Plantation. They are useful as a backdrop.
The median days on market in the region rose from 47 in May 2026 to 51 in June, 57 in July, 61 in August and 64 in September. That is a rise of 17 days, or 36.2%, in four months. Active listings rose from 8,851 in March to 11,221 in July (Realtor.com, active listings), a gain of 2,370 or 26.8%, while new listings fell from 5,004 in May to 4,106 in July (Realtor.com, new listings), a fall of 17.9%.
Homes with a price cut rose from 4,406 in April to 5,244 in August (Realtor.com, price reduced listings), a gain of 838 or 19.0%. In July, 5,370 of the 11,221 active homes carried a cut, 47.9%. The regional median listing price was $429,000 in August, close to the $429,750 of April (Realtor.com, median listing price). The neighborhood median of $925,000 is 2.16 times the regional figure.
The picture is a region in which stock is growing, waits are lengthening and almost half of the unsold homes carry a cut, while the median asking price has not moved. Providence Plantation sits at the top of the price range, and the wait of 53 days there is not far from the regional 64. The neighborhood is firmer than the region and moves the same way.
Source: Realtor.com series published by the Federal Reserve Bank of St. Louis as cited. The 17 day, 36.2%, 2,370, 26.8%, 17.9%, 838, 19.0%, 47.9% and 2.16 figures are this brief's arithmetic. The comparison with the neighborhood is this brief's reasoning.
What should an owner ask before accepting any offer?
Whether an offer is public or private, an owner can compare it with a short list of questions. What is the price, and is any part of it contingent on an inspection, a loan or the sale of another home? What will I receive at closing after every charge? On what date will the sale close, and can the date move? Who pays for any repair a buyer asks for? What is the buyer's evidence that the money is there?
For a home in a small subdivision, there are a few more. Are there association dues or special assessments, and who pays them up to closing? Is the offer the same if the inspection finds a problem with a roof or a heating system from the 1990s? What happens if the buyer's appraisal comes in below the price, a risk in a market where prices have been rising?
The comparison should include the cost of waiting. At 53 days, a home carries taxes, insurance and upkeep for seven or eight weeks before it is under contract, and the sale then takes a month to close. A fixed date and a known price remove the uncertainty, and some owners value that as much as the price. Readers comparing markets can also read the Madison Park brief and the Matthews Edge brief.
Source: this brief's general reasoning. The 53 day figure is from Realtor.com as cited. Commercial content; not independently verified.
What does a private sale change?
Maison Off-Market buys homes directly from their owners. It does not list a home, hold showings or put a home on a public listing. For a Providence Plantation owner, the five benefits are plain. There are no showings and no neighbors talking about the sale. The closing date can be flexible, which gives time to find a new home. There are no commission costs and no closing costs for the seller, and there are no inspections and repairs.
A little arithmetic shows what that is worth. Each 1% of a $917,500 sale is $9,175. A seller who gives up 3% gives up $27,525, and one who gives up 5% gives up $45,875. This brief does not claim that those are the costs of any sale, since the real figures depend on the agreement the seller signs. It shows how quickly a percentage becomes a sum.
The trade is that a private buyer may offer a price that differs from what a public sale could bring. That is why the useful comparison is the price after every cost and every week of waiting, set against a closing date the seller picks. A public sale may fetch more or less. A private offer tells an owner the number before any of that begins.
Maison Off-Market speaks only to sellers. An owner who wants to know what a direct offer would look like can use the contact form below, or call 401-219-4207, and ask for a figure with no showings, no listing and no obligation.
Source: Maison Off-Market. The fee figures are this brief's arithmetic and not claims about any sale.
Methodology and limitations
Prices, price per square foot, days on market, listing and rental counts, and the neighborhood and postal-area tables for Providence Plantation come from two commercial pages: a national listing site page dated September 2026 and a national brokerage page for the postal area with figures to May 2026. They are not independently verified, and a median of 35 homes is a small sample.
Age, tenure, vacancy, income, rent and owner-estimated value come from the American Community Survey 2020-2024 five-year estimates for the postal-code area that includes Providence Plantation. Shares are calculated from published counts, and owner-estimated value carries a margin of error.
Days on market, active and new listings, median listing price and price reduced counts are Realtor.com series published by the Federal Reserve Bank of St. Louis for the Charlotte-Concord-Gastonia metropolitan area. They describe the region and not the neighborhood. The brief makes no forecast and values no home.
Conclusion
The Providence Plantation record shows 35 homes for sale, a listing median that fell 7% in a month and rose 10.8% in a year, a sale-to-list ratio of 100%, a wait that rose 43% and a tight Census vacancy rate of 3.2%. It shows a firm market with a small sample, and a hot label on a slowing pace.
It does not fix a price for any one home. The choice between a public listing and a private sale comes down to whether an owner would rather compete in that market or take privacy, a flexible closing date, no commission, no closing costs and no inspections or repairs. To see what a direct offer would look like for your home, use the contact form below or call 401-219-4207.
Frequently Asked Questions
What is the median home price in Providence Plantation?
Realtor.com reports a median listing price of $925,000 and a median sold price of $917,500 for September 2026. Both rest on a small number of homes.
How long do Providence Plantation homes take to sell?
Realtor.com reports a median of 53 days on market, up 43.24% on the year.
Is Providence Plantation a seller's market?
Realtor.com calls it a hot, seller's market with a sale-to-list ratio of 100%, though the wait is rising.
Why does the neighborhood table show fewer homes than the total?
The neighborhoods shown add up to 15 of 35 homes for sale. The page does not say why, and the likeliest reason is that many listings are not assigned to a named subdivision.
Does a private sale always beat a public listing?
No. A public listing can attract competing bids. A private sale offers privacy, a flexible closing date, no commission, no closing costs and no inspections or repairs.
Compare your options before committing. Request a written private offer for your property, with no obligation, then weigh it against your listing plan.
Sources
- Realtor.com, 2026. Providence Plantation Neighborhood of Charlotte, NC Housing Market. https://www.realtor.com/local/market/north-carolina/charlotte/providence-plantation.
- Redfin, 2026. Housing Market Trends for the Postal Area Including Providence Plantation. https://www.redfin.com/zipcode/28270/housing-market.
- U.S. Census Bureau, 2026. American Community Survey 2020-2024 five-year estimates, the Providence Plantation area (via Census Reporter). https://censusreporter.org/profiles/86000US28270-28270/.
- Realtor.com, 2026. Housing Inventory: Median Days on Market in Charlotte-Concord-Gastonia, NC-SC (CBSA). https://fred.stlouisfed.org/series/MEDDAYONMAR16740.
- Realtor.com, 2026. Housing Inventory: Active Listing Count in Charlotte-Concord-Gastonia, NC-SC (CBSA). https://fred.stlouisfed.org/series/ACTLISCOU16740.
- Realtor.com, 2026. Housing Inventory: New Listing Count in Charlotte-Concord-Gastonia, NC-SC (CBSA). https://fred.stlouisfed.org/series/NEWLISCOU16740.
- Realtor.com, 2026. Housing Inventory: Price Reduced Count in Charlotte-Concord-Gastonia, NC-SC (CBSA). https://fred.stlouisfed.org/series/PRIREDCOU16740.
- Realtor.com, 2026. Housing Inventory: Median Listing Price in Charlotte-Concord-Gastonia, NC-SC (CBSA). https://fred.stlouisfed.org/series/MEDLISPRI16740.
Related research

Seller Guide · October 6, 2026
How to Prepare Point Pleasant Beach Rental Records Before Selling
Separate rental approval, income history and booked stays before comparing sale terms.

Seller Guide · October 6, 2026
How to Prepare Rumson Flood and Waterfront Records Before Selling
Separate flood disclosure, elevation, repairs and waterfront rights before comparing sale terms.

Seller Guide · October 6, 2026
How to Prepare Sarasota Condo Inspection and Reserve Records Before Selling
Separate building condition, reserve funding and resale documents before comparing sale terms.