Market Brief · by Aidan Sowa · October 5, 2026
What Is the Matthews Edge Market When Many Homes Name No Neighborhood? Reading a Falling Listing Median and a Rising Sold Median
Reading a Falling Listing Median and a Rising Sold Median for Matthews Edge, NC, with each source dated and its limits noted, for owners weighing a listing against a direct sale.
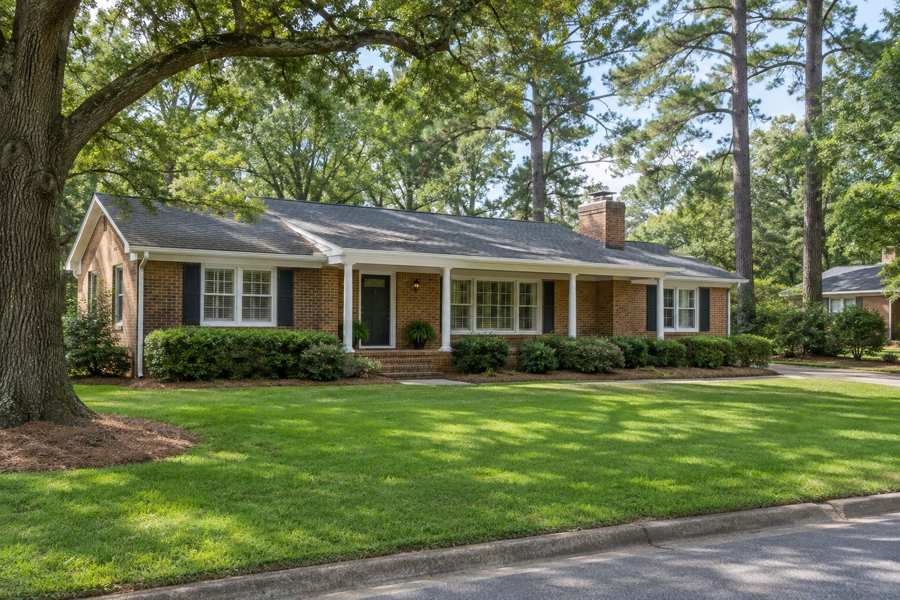
Is a home on the Matthews edge worth more than the asking price? On one Realtor.com line it looks that way. The median sold price in Matthews is $550,000, and the median listing price is $520,000, so the typical home sold for $30,000 more than the typical home was listed for. A year earlier the order was reversed. The listing median has fallen 11.11% in a year and the sold median has risen 2.33%.
The explanation is not that buyers pay more than they are asked. The two medians are for different groups of homes. The homes that sold are not the homes that are listed, and a market that sells its larger homes first leaves a smaller, cheaper pool on the list. This brief looks at what that means, and at a Redfin page for a later month that puts the typical sale at $495,000.
There is a third oddity. Realtor.com counts 221 homes for sale in Matthews, then lists fifteen neighborhoods. The homes for sale in all fifteen add up to 49. The other 172 homes, 77.8% of the total, belong to no neighborhood the table names. The brief reads these pages with the Census profile of the postal area that adjoins Matthews and with the Realtor.com series for the Charlotte region, and asks what a private sale changes.
Key Findings
- Realtor.com reported, as of May 2026, a median listing price of $520,000 for Matthews (down 11.11% on the year and down 14.91% on three years), a median sold price of $550,000 (up 2.33% and up 3.58%), $237 per square foot (down 2.07% and up 6.76%), 221 active listings (up 10.14% and up 62.57%) and a median of 28 days on market (down 12.50% and down 6.67%). The table headers on that page read 1Y Change and 3Y Change (Realtor.com, Matthews).
- The same Realtor.com page gave a sale-to-list ratio of 99%, with homes selling 1.12% below the asking price on average, and called May 2026 a hot, seller's market. It counted 456 rentals (up 83.43% on the year and up 920.31% on three years) at a median rent of $1,617 a month (down 0.68% and down 25.66%).
- Redfin reported, for the three months to August 2026, a median sale price of $495,000 in Matthews (down 3.9% on the year), $240 per square foot (down 4.2%), 44 days on market against 36 a year earlier and 95 homes sold in August against 104. It called the market somewhat competitive, with homes receiving about two offers on average (Redfin, Matthews).
- In the Charlotte postal area next to Matthews, 12,148 of 12,548 housing units are occupied, owners hold 9,335 of the occupied homes (76.8%), renters hold 2,813 (23.2%), the median household income is $131,667 and the owner-estimated median home value is $589,500 (U.S. Census Bureau, 2020-2024).
- In the Charlotte-Concord-Gastonia area the median days on market rose from 47 in May 2026 to 64 in September (Realtor.com, days on market).
How can homes sell for more than the typical asking price?
They can when the sold median and the listing median describe different homes. The listing median is the middle price of every home currently on the market, and it includes homes that have sat for months, homes that are priced to be negotiated and homes that never sell. The sold median is the middle price of the homes that closed in the month, and a month in which the larger and better located homes closed will pull it up.
The changes over time show this pattern. A listing median of $520,000 that is down 11.11% on the year implies a median of about $585,000 a year earlier. A sold median of $550,000 that is up 2.33% implies about $537,500. A year ago, then, the typical listing was $47,500 above the typical sale. Now it is $30,000 below. These implied figures are arithmetic from the stated changes and not numbers from the page.
Both moves can be true together if the unsold homes have become cheaper on average while the homes that sold have not. One reading is that sellers of the larger homes have found buyers and left, and that new listings are skewed toward smaller homes and townhomes. The page also shows the number of listings up 10.14%, so the supply has grown at the same time, and it is likelier to have grown at the lower end.
The price per square foot gives a small check. It is $237 on the page, down 2.07% on the year, so the cost of a foot of floor space barely moved while both medians did. Prices that hold steady per foot while totals shift usually mean that the size of the homes in the data changed, which is what the mix explanation predicts.
For an owner, the lesson is not to price a home off the listing median. A home that is priced at the median of the list competes with a pool that has changed in make-up, and a sale at the sold median is possible only if the home looks like the ones that sold.
| Indicator | Level | 1Y change | 3Y change |
|---|---|---|---|
| Median listing price | $520,000 | -11.11% | -14.91% |
| Median sold price | $550,000 | 2.33% | 3.58% |
| Price per square foot | $237 | -2.07% | 6.76% |
| Active listings | 221 | 10.14% | 62.57% |
| Median days on market | 28 | -12.50% | -6.67% |
| Rentals | 456 | 83.43% | 920.31% |
| Median rent | $1,617 a month | -0.68% | -25.66% |
Source: Realtor.com page as cited. The $585,000, $537,500, $47,500 and $30,000 figures are this brief's arithmetic from the stated changes. The explanation of the mix is this brief's reasoning and not a statement of the page. Commercial content; not independently verified.
Which sale median should a Matthews edge owner believe?
Redfin's median for the three months to August 2026 is $495,000, down 3.9% on the year, which implies about $515,100 a year earlier. Realtor.com's figure for May 2026 is $550,000, up 2.33%. The gap is $55,000, or 10.0% of the larger figure, and the two moves point in opposite directions.
The months differ by three months, the periods differ, since one covers a single month and the other three, and the companies draw the boundary of Matthews differently. None of those is a mistake. Together they show that a number for a town is not a number for a street. The price per square foot is closer: $240 on Redfin and $237 on Realtor.com, a difference of $3. The similar price per foot with a different median points again to the mix of homes.
Redfin's other figures are clearer. The wait is 44 days against 36 a year earlier, which is 8 days or 22.2% more, and 95 homes sold in August against 104, which is 8.7% fewer. Homes sold for about 1% below list and received about two offers on average. These are not the numbers of a hot market. They are the numbers of a market that is still working but has slowed since the spring.
The wait on Realtor.com's page was 28 days in May. If the Redfin figure of 44 is the later one, the town added 16 days in three months. That is a guess about two different measures, and the pages do not prove it. An owner should take it as a reason to ask for a recent month and a clear definition.
Source: Redfin and Realtor.com pages as cited. The $515,100, $55,000, 10.0%, 22.2%, 8.7% and 16 day figures are this brief's arithmetic. The comparison of 28 and 44 days is this brief's inference across different measures. Commercial content; not independently verified.
Where are the 172 homes that the neighborhood table cannot place?
Realtor.com counts 221 homes for sale in Matthews. Its table by neighborhood lists fifteen places. Springwater has eight, The Heathers six, and Brightmoor and Wood Hollow four each. Bellasera Villas, Hampton Green, Matthews Estates, Shannamara and Southwoods have three each, and Avington, Crestdale Crossing, Eastwood Forest, Fairfax Woods, Greylock and Kimbrell Acres have two each. The fifteen rows add up to 49.
That leaves 172 homes, 77.8% of the total, that sit in no named neighborhood. The page does not say why. The likeliest reason is that a listing appears in a neighborhood row only when it names a subdivision, and many do not. A seller in one of the fifteen can see how many homes compete nearby. A seller anywhere else cannot.
The percentages need the same care. Matthews Estates shows a rise of 200% on three homes. Wood Hollow shows a fall of 40% on four. Avington shows 100% on two. Counts this small move by a house or two, and the percentages are noise. The Heathers, with six, is the only row besides Springwater with more than four homes.
The rental side is even thinner. The page counts 456 rentals, up 83.43% on the year, which implies about 249 a year earlier, and the named neighborhoods hold only 12 of them, 2.6%. Crestdale Crossing has five and Wood Hollow four. There are more than twice as many rentals as homes for sale, 456 to 221, and the table says nothing about where they are.
Source: Realtor.com page as cited. The 49, 172, 77.8%, 249, 12 and 2.6% figures are this brief's arithmetic. The explanation of the gap is this brief's reasoning and not a statement of the page. Commercial content; not independently verified.
What do the neighbors say about the edge?
The Realtor.com page for Matthews also shows the postal areas around it. The postal area that holds most of the town has a median listing price of $500,000 at $246 per square foot, with 210 homes for sale, 455 rentals, a median rent of $1,525 and a wait of 28 days. The next postal area over, with only 11 homes for sale, has a median listing price of $619,000 at $236 per foot and a wait of 33 days.
The Charlotte postal area on the other side of the edge is a different market. Its median listing price is $764,500 at $283 per square foot, with 187 homes for sale (up 4%), 160 rentals and a wait of 31 days. That is $244,500, or 47.0%, above the Matthews median of $520,000, with a wait only three days longer. Crossing the edge means a different price range, and the wait is much the same.
Price per foot is the steadiest comparison. It runs from $236 to $246 in the two Matthews areas and $283 on the Charlotte side, a premium of about 15% to 20% on a foot of floor area. The premium on the whole price is far bigger, which suggests that the homes on the Charlotte side are larger.
For an owner on the edge, the practical point is that buyers compare across it. A buyer who cannot afford the Charlotte side looks at Matthews, and one who wants a larger home does the reverse. A home near the line competes in two markets, and its price depends on which of them its buyers are coming from.
| Area | Median listing price | Price per sq ft | Homes for sale | Median days |
|---|---|---|---|---|
| Matthews, main postal area | $500,000 | $246 | 210 | 28 |
| Matthews, second postal area | $619,000 | $236 | 11 | 33 |
| Charlotte side of the edge | $764,500 | $283 | 187 | 31 |
Source: Realtor.com page as cited. The $244,500, 47.0% and premium figures are this brief's arithmetic. The explanation about home size is this brief's reasoning. Commercial content; not independently verified.
What does the Census add about the Charlotte side of the edge?
The Census postal area used for this brief is on the Charlotte side. It holds 12,548 homes, of which 12,148 are occupied and only 400, 3.2%, are vacant. Owners live in 9,335 of them and renters in 2,813, 23.2%. The population is 32,448, or about 2.67 per occupied home, and the median household income is $131,667. This is a tight, family sized market where almost every home is lived in.
Rent shows a gap with Matthews. The Census median gross rent for the area is $1,763 a month. Realtor.com's median asking rent in Matthews is $1,617, which is $146 or 8.3% below it. Asking rents in Matthews have also fallen 25.66% over three years, though the number of rentals has grown by 920.31%, from about 45 to 456. A flood of new rental listings has pulled the asking figure down, a pattern that usually means new apartments or build-to-rent homes came to the market.
The homes are mostly from the 1980s and 1990s. The Census counts 2,984 from the 1980s and 3,814 from the 1990s, together 6,798 or 54.2%, with 3,381 (26.9%) from 2000 or later and 2,369 (18.9%) from before 1980. The median year built is 1992. A home from the 1980s or 1990s is 30 to 45 years old, and its roof, systems and windows are at an age that inspectors notice.
The owner-estimated median value in the Census is $589,500, with a margin of error of $17,867. That is $39,500, or 7.2%, above the Realtor.com sold median for Matthews of $550,000, and it is $94,500 or 19.1% above the Redfin figure of $495,000. The surveys cover different places and periods. The comparison only shows that owners on the Charlotte side believe their homes are worth more than the typical Matthews sale.
Source: U.S. Census Bureau, American Community Survey 2020-2024, Realtor.com and Redfin as cited. Shares and gaps are this brief's arithmetic. The explanation of falling asking rents is this brief's reasoning.
What does the Charlotte series add?
The town figures stop in the spring and summer. The Charlotte-Concord-Gastonia series are regional and run to the autumn. They do not describe Matthews, but they show the direction of the area around it.
Active listings in the region rose from 9,740 in April 2026 to 11,221 in July (Realtor.com, active listings), a gain of 1,481 or 15.2%, while new listings fell from 5,250 in April to 4,106 in July (Realtor.com, new listings), a fall of 1,144 or 21.8%. Stock grew while new supply shrank, which means that homes were not selling as fast as they came on.
The regional median listing price was $439,000 in May, which is $81,000 or 18.5% below the Matthews figure of $520,000 for the same month (Realtor.com, median listing price). Homes with a price cut were 4,764 in May and 5,244 in August (Realtor.com, price reduced listings), a gain of 10.1%. In May the regional median wait was 47 days, so Matthews at 28 days was 19 days, or 40%, quicker than the region.
By September the regional wait was 64 days, up 17 days in four months. If Matthews followed it, the town is no longer 28 days. The Redfin figure of 44 days for the three months to August fits that idea, but it measures something else, so the pages cannot settle it. They do show that the spring advantage was shrinking.
Source: Realtor.com series published by the Federal Reserve Bank of St. Louis as cited. The 1,481, 15.2%, 1,144, 21.8%, $81,000, 18.5%, 10.1%, 19 day and 40% figures are this brief's arithmetic. The inference about Matthews is this brief's and is not a figure from any page.
What should an owner ask before accepting any offer?
Whether an offer is public or private, a seller can test it with a few plain questions. What is the price, and is any part of it conditional on an inspection, a loan or the sale of another home? What will I take home after every charge? When will the sale close, and can that date move? Who pays for any repair the buyer asks for? What proof is there that the money exists?
On the edge of two markets, a few more matter. Which county and which school assignment does the address carry, since buyers on either side of a line pay for different things? Are there association dues or a special assessment? If the buyer's appraisal comes in under the price, who covers the gap? Each of these can end a sale after weeks of work.
The comparison should include the cost of waiting. At the Redfin figure of 44 days, a home carries taxes, insurance and upkeep for more than six weeks before an offer is accepted, and the sale then takes a month to close. A fixed date and a known price remove the uncertainty, and some owners value that as much as the price. Readers comparing markets can also read the Providence Plantation brief and the Cotswold brief.
Source: this brief's general reasoning. The 44 day figure is from Redfin as cited. Commercial content; not independently verified.
What does a private sale change?
Maison Off-Market buys homes directly from their owners. It does not list a home, hold showings or put a home on a public listing. For an owner on the Matthews edge, the five benefits are plain. There are no showings and no neighbors talking about the sale. The closing date can be flexible, which gives time to find a new home. There are no commission costs and no closing costs for the seller, and there are no inspections and repairs.
A little arithmetic shows what that is worth. Each 1% of a $550,000 sale is $5,500. A seller who gives up 3% gives up $16,500, and one who gives up 5% gives up $27,500. This brief does not claim that those are the costs of any sale, since the real figures depend on the agreement the seller signs. It shows how quickly a percentage becomes a sum.
The trade is that a private buyer may offer a price that differs from what a public sale could bring. The useful comparison is the price after every cost and every week of waiting, set against a closing date the seller picks. A public sale may fetch more or less. A private offer tells an owner the number before any of that begins.
Maison Off-Market speaks only to sellers. An owner who wants to know what a direct offer would look like can use the contact form below, or call 401-219-4207, and ask for a figure with no showings, no listing and no obligation.
Source: Maison Off-Market. The fee figures are this brief's arithmetic and not claims about any sale.
Methodology and limitations
Prices, price per square foot, days on market, listing and rental counts, and the neighborhood and postal-area tables for Matthews come from two commercial pages: a national listing site page dated May 2026 and a national brokerage page with figures to August 2026. They cover different months and are not independently verified. The edge itself has no published boundary, so the brief uses the town of Matthews and the postal area next to it.
Age, tenure, vacancy, income, rent and owner-estimated value come from the American Community Survey 2020-2024 five-year estimates for the postal-code area on the Charlotte side of the edge. Shares are calculated from published counts, and owner-estimated value carries a margin of error.
Days on market, active and new listings, median listing price and price reduced counts are Realtor.com series published by the Federal Reserve Bank of St. Louis for the Charlotte-Concord-Gastonia metropolitan area. They describe the region and not the town. The brief makes no forecast and values no home.
Conclusion
The Matthews edge record shows a listing median down 11% and a sold median up 2% on the same page, a sale median of $495,000 on another, 172 homes for sale in no named neighborhood, a Census vacancy rate of 3.2% and a region where the wait is lengthening.
It does not fix a price for any one home. The choice between a public listing and a private sale comes down to whether an owner would rather compete in that market or take privacy, a flexible closing date, no commission, no closing costs and no inspections or repairs. To see what a direct offer would look like for your home, use the contact form below or call 401-219-4207.
Frequently Asked Questions
What is the median home price in Matthews?
Realtor.com reports a median sold price of $550,000 for May 2026 and a median listing price of $520,000. Redfin reports a median sale price of $495,000 for the three months to August 2026.
How long do Matthews homes take to sell?
Realtor.com reports a median of 28 days for May 2026, and Redfin reports 44 days for the three months to August 2026.
Is Matthews a seller's market?
Realtor.com called May 2026 a hot, seller's market with homes selling 1.12% below asking. Redfin called the market somewhat competitive.
Why does the neighborhood table show fewer homes than the total?
The fifteen neighborhoods shown add up to 49 of 221 homes for sale. The page does not say why, and the likeliest reason is that many listings are not assigned to a named subdivision.
Does a private sale always beat a public listing?
No. A public listing can attract competing bids. A private sale offers privacy, a flexible closing date, no commission, no closing costs and no inspections or repairs.
Compare your options before committing. Request a written private offer for your property, with no obligation, then weigh it against your listing plan.
Sources
- Realtor.com, 2026. Matthews, NC Housing Market and Rental Trends. https://www.realtor.com/local/market/north-carolina/mecklenburg-county/matthews.
- Redfin, 2026. Matthews Housing Market. https://www.redfin.com/city/10672/NC/Matthews/housing-market.
- U.S. Census Bureau, 2026. American Community Survey 2020-2024 five-year estimates, the Matthews Edge area (via Census Reporter). https://censusreporter.org/profiles/86000US28270-28270/.
- Realtor.com, 2026. Housing Inventory: Median Days on Market in Charlotte-Concord-Gastonia, NC-SC (CBSA). https://fred.stlouisfed.org/series/MEDDAYONMAR16740.
- Realtor.com, 2026. Housing Inventory: Active Listing Count in Charlotte-Concord-Gastonia, NC-SC (CBSA). https://fred.stlouisfed.org/series/ACTLISCOU16740.
- Realtor.com, 2026. Housing Inventory: New Listing Count in Charlotte-Concord-Gastonia, NC-SC (CBSA). https://fred.stlouisfed.org/series/NEWLISCOU16740.
- Realtor.com, 2026. Housing Inventory: Median Listing Price in Charlotte-Concord-Gastonia, NC-SC (CBSA). https://fred.stlouisfed.org/series/MEDLISPRI16740.
- Realtor.com, 2026. Housing Inventory: Price Reduced Count in Charlotte-Concord-Gastonia, NC-SC (CBSA). https://fred.stlouisfed.org/series/PRIREDCOU16740.
Related research

Seller Guide · October 6, 2026
How to Prepare Point Pleasant Beach Rental Records Before Selling
Separate rental approval, income history and booked stays before comparing sale terms.

Seller Guide · October 6, 2026
How to Prepare Rumson Flood and Waterfront Records Before Selling
Separate flood disclosure, elevation, repairs and waterfront rights before comparing sale terms.

Seller Guide · October 6, 2026
How to Prepare Sarasota Condo Inspection and Reserve Records Before Selling
Separate building condition, reserve funding and resale documents before comparing sale terms.