Market Brief · by Aidan Sowa · October 5, 2026
Which Oak Forest Median Is the Real One? Reading Many Sources and a High Listing Median
Reading Many Sources and a High Listing Median for Oak Forest, TX, with each source dated and its limits noted, for owners weighing a listing against a direct sale.
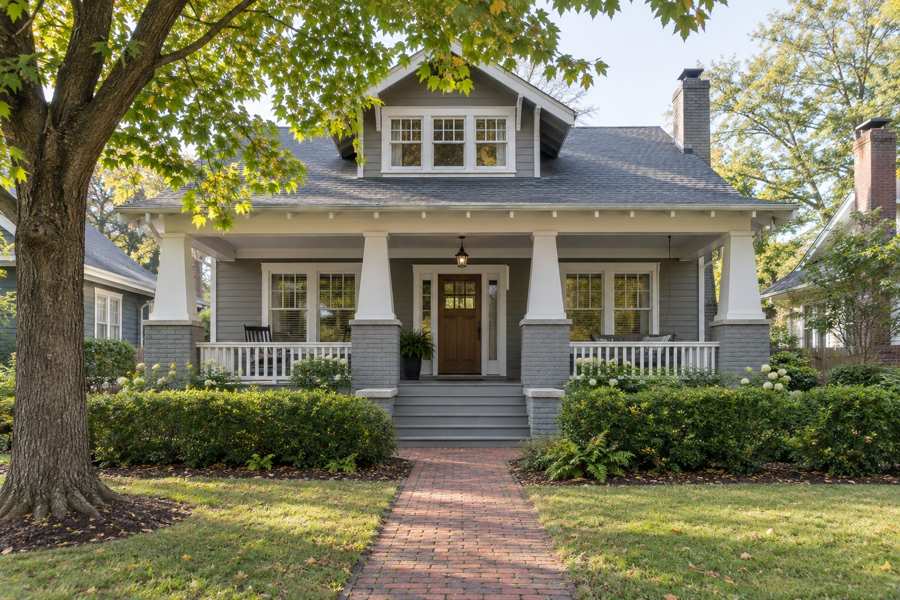
Is the Oak Forest median $476,652, $517,000, $573,050, $631,250 or $815,000? A seller who reads five public pages about this north Houston neighborhood in the same week will come away with all five. Zillow's home value index says $476,652. A brokerage market update for single-family homes says a median sales price of $517,000. Redfin says $573,050. Realtor.com says $631,250. A local blog that quotes Redfin's March figure says $815,000. The highest is 1.71 times the lowest, and each one is called the Oak Forest price.
The gap between asking and selling is just as wide on one page. Realtor.com shows a median listing price of $925,000 for Oak Forest and a median sold price of $631,250, so the typical home on the market is listed at 1.47 times the typical home that sold. The same page says homes sold for 3.96% below the asking price in September 2026 and calls it a buyer's market. Neither figure is wrong. They measure different homes at different moments.
Maison Off-Market buys luxury homes and estates directly from their owners and speaks only to sellers. We do not estimate what any home is worth, and nothing here is a valuation. This brief sets the five medians side by side, shows what each one counts, and gives the one number a seller can use every time: what a percentage of a price means in dollars. Every figure is attributed, every calculation is this brief's own arithmetic and every inference is labeled as one.
Key Findings
- Realtor.com, with indicators as of September 2026, showed a median listing price of $925,000 (up 10.78% on the year), a median sold price of $631,250 (up 19.22%), $332 per square foot (down 3.02%), 123 active listings (down 24.56%), a median of 35 days on market and a median rent of $2,725 (Realtor.com, Oak Forest market data).
- Redfin, for the combined Oak Forest and Garden Oaks area, showed a median sale price of $573,050 for the three months to May 2026 (up 10.8%), $325 per square foot, 36 days on market against 32 a year earlier, 225 homes sold in May against 207, a sale-to-list ratio of 98.5% and 30.7% of homes with a price drop (Redfin, Oak Forest and Garden Oaks housing market).
- A brokerage market update for Oak Forest single-family homes in the second quarter of 2026 showed a median sales price of $517,000 (up 6%), 31 average days on market (down 24%), 158 closed sales (up 5%) and 196 homes in inventory (down 9%) (Sotheby's International Realty, Oak Forest market update).
- Zillow's index for the combined area was $476,652, up 1.4% on the year, with homes going pending in around 15 days, as updated on May 31, 2026 (Zillow, Oak Forest and Garden Oaks home values).
- A local blog dated September 29, 2026 quoted Redfin for an Oak Forest all-types median of about $815,000 in March 2026 (up 35.8% on the year) after a January median near $920,000, with about 85 days on market against 54 a year earlier (Houston Heights Life, fall market watch).
- The Census shows a postal area with 31,031 residents, a median household income of $127,017, a median owner-occupied home value of $584,600 and 67.5% of occupied homes lived in by their owners (Census Reporter, American Community Survey profile).
Why do five sources give five different Oak Forest medians?
The first reason is that they do not describe the same place. Redfin and Zillow publish one area called Oak Forest and Garden Oaks. Realtor.com publishes Oak Forest on its own page and also a combined row on the same page. The brokerage update covers Oak Forest single-family homes. The blog mixes Redfin's Oak Forest figure with Garden Oaks and Timbergrove. A median of one set of homes cannot be compared with a median of a different set, and a seller who does so is comparing boundaries.
The second reason is that they do not describe the same homes. Zillow's figure is an index of estimated values across all homes, which is an estimate and not a sale. The brokerage's $517,000 counts single-family closings only. Redfin's $573,050 counts all home types, including townhouses and condominiums. Realtor.com's $631,250 is for homes sold in a month, and the monthly figure rose 16.09% in a month, which is the kind of move that appears when a small number of sales changes character. That reading is an inference, since the page does not give the count behind it.
The third reason is that they do not describe the same dates. Zillow's update is from the end of May. Redfin's is for the three months to May. The brokerage figure is for the second quarter. The blog's $815,000 is a March figure for one month. Realtor.com's is September. Six months separate the oldest from the newest, and a seller reading them together is looking at a market in motion without a fixed frame.
Put together, the five figures are not five opinions about one number. They are five measurements of five things, and the right response is to ask which one resembles your own home. Nobody should be reassured or alarmed by a single one of them. A useful habit is to write the figure down together with its source, its date and its home types, and to throw away any number that arrives without those three things. That habit alone removes most of the confusion in the table above, because it turns five competing prices into five labeled facts. It also makes the next conversation shorter. When a buyer, an agent or a neighbor quotes a median, you can ask which of the labeled facts it matches and which it does not.
| Source | Figure | What it covers |
|---|---|---|
| Zillow | $476,652 | Home value index, combined area, May 2026 |
| Sotheby's update | $517,000 median sales price | Single-family closings, second quarter 2026 |
| Redfin | $573,050 median sale price | All home types, combined area, three months to May 2026 |
| Realtor.com | $631,250 median sold price | Oak Forest, September 2026 |
| Local blog quoting Redfin | About $815,000 | All types, March 2026 |
Source: the five pages as cited. The 1.71 times figure is this brief's arithmetic ($815,000 divided by $476,652). Commercial content; not independently verified.
What does a $925,000 listing median against a $631,250 sold median mean?
Realtor.com's Oak Forest page gives two medians that sit 47% apart. The median listing price is $925,000 and the median sold price is $631,250. The ratio, $925,000 divided by $631,250, is 1.47. The page does not claim that homes list at 1.47 times what they sell for, and it would be wrong to read it that way. The homes now for sale are one group and the homes that sold last month are another, and the for-sale group may include bigger or newer houses.
A second part of the same page supports that reading. The median price per square foot is $332, down 3.02% on the year, while the median sold price is up 19.22%. If the price per square foot fell while the total price rose, the homes that sold were probably larger or had more finish, which is this brief's inference and is not stated on the page. It is a reason not to read a rising median as a rising price for the same house. A homeowner who hears that the neighborhood is up 19% should not conclude that their own home is worth 19% more than a year ago. It may be, or it may not. The figure measures what changed in the mix of homes that closed, and the mix can change for reasons unrelated to any one house.
The page does say that homes sold for 3.96% below the asking price in September, a sale-to-list ratio of 96%. Redfin's page for the combined area, in May, shows a ratio of 98.5% and says 16.5% of homes sold above their list price. The two ratios differ by 2.5 points, and they come from different months, different areas and different home mixes. Both say the typical sale closed within a few percent of the asking price.
For a seller, the figure that matters is not the gap between two medians. It is how far the final price of homes like yours lands from the first price they were offered at. On a $631,250 sale, 3.96% is $24,998. On a $925,000 sale it is $36,630. The arithmetic is simple, and it is the cost of an ask that was too hopeful.
How long do Oak Forest homes take to sell?
The pages disagree here too. Realtor.com shows a median of 35 days for Oak Forest in September, up 18.33% in a month and down 8.97% on the year. On the same page, the combined Oak Forest and Garden Oaks row shows 42 days, and the postal area row shows 37. Redfin shows 36 days for the three months to May against 32 a year earlier. The brokerage shows 31 average days in the second quarter, down 24% on the year. Zillow says homes go pending in around 15 days.
The blog's figure is the outlier. It quotes about 85 days for Oak Forest in March 2026, up from 54 a year earlier, and a single month of data in a neighborhood is not a trend, as the blog itself says. A second local post, written for sellers in the neighborhood, says that homes zoned to the neighborhood elementary school have had contract timelines of under three weeks (HAR.com, Oak Forest and Garden Oaks home values). The same post says the neighborhood covers roughly 5,500 homes in 18 sections and that the metro has about 4.9 months of supply.
These are different clocks. Days on market counts from listing to a contract or a sale, depending on the source. Zillow's 15 days is the time to pending, which ends at a contract. The brokerage's 31 is described as the time from listing until a seller accepts an offer and signs a contract. Redfin's 36 counts the median homes. A seller reading 15 and 85 side by side has two measures with no common definition.
What the five agree on is direction, and the direction is mixed. Realtor.com shows days on market slightly lower than a year earlier. Redfin shows them four days higher. The brokerage shows them lower by almost a quarter. The blog shows them higher by 31. There is no single answer, and that is the answer.
What does the Census say about incomes, values and tenure?
The Census profile for the postal area gives a median household income of $127,017, a median gross rent of $1,293 and a median owner-occupied home value of $584,600 with a margin of error of $34,661. The home value is 4.6 times the income, which is this brief's arithmetic. The Realtor.com sold median of $631,250 is 5.0 times the income. Both are comparisons of a neighborhood price with an area-wide income, so they describe affordability for an average household and not for any one buyer.
The Census value, an owner's own estimate across the postal area, sits between the brokerage's $517,000 and Redfin's $573,050 on one side and Realtor.com's $631,250 on the other. It is 14% above the brokerage figure and 2% above Redfin's, which are this brief's calculations. It is not a sale price, and it covers condominiums and townhouses as well as houses.
Tenure shows a neighborhood that is mostly lived in by its owners. Of 12,521 occupied homes, 8,452 are owner-occupied (67.5%) and 4,069 are rented (32.5%). The vacancy rate is 9.5%, or 1,310 of 13,831 homes. Realtor.com's median rent for Oak Forest is $2,725, which is 2.1 times the Census median gross rent of $1,293. The Census figure covers every rental in the postal area, including apartments, so the two are not like for like.
The housing stock is mid-century at its core. The median year built is 1967. The 1950s is the largest decade with 3,296 homes, and the 1960s follows with 2,652. A second peak appears in the 2010s, at 2,656, which shows a large amount of newer building on the same streets. Homes built before 1980 are 62.7% of the total. The neighborhood is old and new together, and that explains much of why one median does not describe it.
What do the Harris County series add?
Realtor.com publishes county series through the Federal Reserve Bank of St. Louis, and these are free to read. The Harris County median days on market was 47 from April to June and 50 in August (Realtor.com, days on market). Active listings rose from 16,773 in March to 18,656 in July, up 11.2% (Realtor.com, active listings). The county median listing price moved from $326,666 in February to $335,000 in June, up 2.6% (Realtor.com, median listing price).
The count of listings with a price reduction rose from 5,014 in April to 6,056 in August (Realtor.com, price reduced count), up 20.8%. In July the count was 5,966 against 18,656 active listings, which is 32.0%. All of these percentages are this brief's arithmetic. The county share of listings with a reduction, near a third, is close to the 30.7% of Oak Forest and Garden Oaks homes that Redfin shows with a price drop.
The county's median listing price of $335,000 is 36% of the Oak Forest median listing price of $925,000 on Realtor.com. That is a reminder that the neighborhood is a high-priced pocket of a large county, and a county series says little about a home here other than the direction of the market around it. Rising inventory and rising reductions mean that sellers in the county face more competition than they did in spring.
These are county figures, not Oak Forest figures. The series titles were checked on their series pages. Readers comparing markets can also read the Spring Branch East brief and the Garden Oaks brief.
Source: Realtor.com series published by the Federal Reserve Bank of St. Louis as cited. The 11.2%, 2.6%, 20.8%, 32.0% and 36% are this brief's arithmetic. The series names were checked against the series pages.
What should an owner ask, and what does a private sale change?
Ask which area a number covers and which homes. Ask whether it is a sale price, a listing price or an estimate, and which month it describes. A seller who is quoted $815,000 by one person and $517,000 by another should ask each for the sample, the boundary, the home types and the date before reacting.
A private sale changes how a home reaches a buyer. With Maison Off-Market there are no showings and no neighbors talking about a sale, the closing date can be flexible so that an owner has time to find a new home, there are no commission costs, there are no closing costs and there are no inspections or repairs. For an owner of a ranch home from the 1950s or 1960s, the last of those may matter most, because a buyer's inspection of an older house tends to produce a list. This brief does not claim that a private sale always brings a higher price than a public listing.
Fee arithmetic shows why the commission point matters, without assuming any rate. Each 1% of a sale price is $5,170 at $517,000, $6,312.50 at $631,250 and $8,150 at $815,000. At 3% those amounts are $15,510, $18,937.50 and $24,450. At 5% they are $25,850, $31,562.50 and $40,750. These are illustrations of what a percentage means on each of the figures in this brief, and they are not a statement of what any agent charges or what any sale would cost.
Timing is the other thing an owner controls. A public listing starts a clock that buyers can see, and the pages above show days on market anywhere from 15 to 85 depending on the source. A private sale lets the owner pick the closing date instead, which matters most to people who need to find the next home first. We are not saying that a longer timeline is a bad thing. We are saying that it should be a choice and not a surprise. If you are weighing a sale of an Oak Forest home, one conversation costs nothing and obliges you to nothing. We ask about the home, the timing you would like and what you would need from a buyer, and we say plainly whether a private sale fits.
If you would like a private, no-obligation offer for an Oak Forest home, call 401-219-4207 or use the contact form on this site.
Methodology and limitations
Prices, days on market, sale-to-list ratios and counts come from Realtor.com's neighborhood page with indicators as of September 2026, Redfin's neighborhood page for the three months to May 2026, a brokerage market update for the second quarter of 2026, Zillow's value index page updated May 31, 2026 and a local blog post dated September 29, 2026 that quotes Redfin. The sources cover different areas, home types and periods, and most are commercial pages, so they are not independent of each other.
Census figures come from the American Community Survey 2020-2024 five-year estimates for the postal area, through Census Reporter. County series are Realtor.com data published by the Federal Reserve Bank of St. Louis for Harris County, Texas, and the series titles were checked on the series pages. Percentages, gaps, ratios and fee amounts are this brief's own arithmetic and are labeled as such. Where a reading goes beyond what a page says, it is called an inference. No agent names, contact details or street addresses from the pages are reproduced.
Conclusion
The Oak Forest record shows five medians from $476,652 to $815,000, a listing median of $925,000 against a sold median of $631,250, days on market from 15 to 85 depending on the clock, and a postal area where 62.7% of homes were built before 1980 and 67.5% of occupied homes are owner-occupied. The numbers differ because the areas, the homes, the months and the definitions differ.
It does not fix a price for any one home. The choice between a public listing and a private sale comes down to whether an owner would rather meet showings, price drops and a public clock, or sell quietly on a date that suits them. Maison Off-Market speaks only to sellers, and a conversation costs nothing.
Frequently Asked Questions
What is the median home price in Oak Forest, Houston?
It depends on the source. Realtor.com shows a median sold price of $631,250 for September 2026. Redfin shows $573,050 for the combined Oak Forest and Garden Oaks area to May. A brokerage update shows $517,000 for single-family homes in the second quarter. Zillow shows an index value of $476,652.
How long do homes take to sell in Oak Forest?
Realtor.com shows a median of 35 days in September 2026. Redfin shows 36 days to May. A brokerage shows 31 average days in the second quarter. A local blog quoting Redfin shows about 85 days for March. The sources use different clocks and months.
Do Oak Forest homes sell below the asking price?
Realtor.com shows homes sold 3.96% below the asking price in September 2026. Redfin shows a sale-to-list ratio of 98.5% in May for the combined area, with 16.5% of homes selling above list.
What does the Census say about Oak Forest?
The postal area has a median household income of $127,017, a median owner-occupied home value of $584,600, a median year built of 1967 and 67.5% of occupied homes lived in by their owners.
What is the difference between a private sale and a public listing?
A private sale with Maison Off-Market has no showings, a flexible closing date, no commission costs, no closing costs and no inspections or repairs. A public listing exposes the home to a wider group of buyers. This brief does not claim either always gets a higher price.
Compare your options before committing. Request a written private offer for your property, with no obligation, then weigh it against your listing plan.
Sources
- Realtor.com, 2026. Oak Forest Neighborhood of Houston, TX Housing Market. https://www.realtor.com/local/market/texas/houston/oak-forest.
- Redfin, 2026. Oak Forest-Garden Oaks, Houston Housing Market. https://www.redfin.com/neighborhood/50425/TX/Houston/Oak-Forest-Garden-Oaks/housing-market.
- Sotheby's International Realty, 2026. Oak Forest Market Update, Greater Houston. https://marketupdates.sothebysrealty.com/marketupdate/houston/greater_houston/oak_forest.
- Zillow, 2026. Oak Forest - Garden Oaks Houston, TX Housing Market. https://www.zillow.com/home-values/403545/oak-forest-garden-oaks-houston-tx/.
- Houston Heights Life, 2026. Market Watch: Garden Oaks, Oak Forest and Timbergrove This Fall. https://houstonheightslife.com/blog/garden-oaks-oak-forest-timbergrove-market-2026/.
- U.S. Census Bureau, 2026. American Community Survey 2020-2024 five-year estimates, the Oak Forest area (via Census Reporter). https://censusreporter.org/profiles/86000US77018-77018/.
- Realtor.com, 2026. Housing Inventory: Median Days on Market in Harris County, TX. https://fred.stlouisfed.org/series/MEDDAYONMAR48201.
- Realtor.com, 2026. Housing Inventory: Active Listing Count in Harris County, TX. https://fred.stlouisfed.org/series/ACTLISCOU48201.
- Realtor.com, 2026. Housing Inventory: Median Listing Price in Harris County, TX. https://fred.stlouisfed.org/series/MEDLISPRI48201.
- Realtor.com, 2026. Housing Inventory: Price Reduced Count in Harris County, TX. https://fred.stlouisfed.org/series/PRIREDCOU48201.
- har.com, 2026. blog 145635 what oak forest and garden oaks home values look like heading into summer. https://www.har.com/blog_145635_what-oak-forest-and-garden-oaks-home-values-look-like-heading-into-summer.
Related research

Seller Guide · October 6, 2026
How to Prepare Point Pleasant Beach Rental Records Before Selling
Separate rental approval, income history and booked stays before comparing sale terms.

Seller Guide · October 6, 2026
How to Prepare Rumson Flood and Waterfront Records Before Selling
Separate flood disclosure, elevation, repairs and waterfront rights before comparing sale terms.

Seller Guide · October 6, 2026
How to Prepare Sarasota Condo Inspection and Reserve Records Before Selling
Separate building condition, reserve funding and resale documents before comparing sale terms.