Market Brief · by Aidan Sowa · October 5, 2026
Did Spring Branch East Prices Rise or Fall? Reading a Redfin Median Sale and a Realtor.com Median Sale
Reading a Redfin Median Sale and a Realtor.com Median Sale for Spring Branch East, TX, with each source dated and its limits noted, for owners weighing a listing against a direct sale.
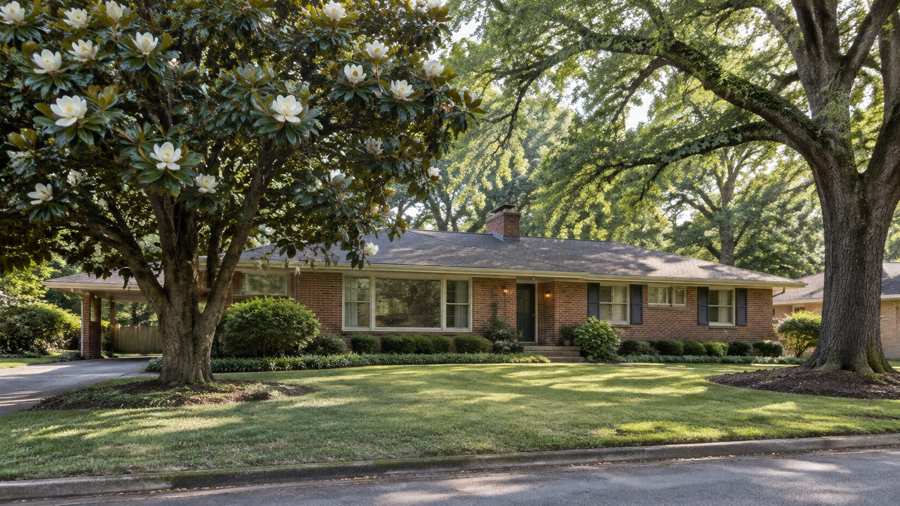
Did Spring Branch East prices rise 35 percent or fall 28 percent? Both statements are in print. Redfin's page for the postal area that includes the neighborhood says that the median sale price in February 2026 was $650,000, up 35.0% on the year. Realtor.com's page for Spring Branch East, with key indicators as of June 2026, says that the median sold price was $439,701, down 28.37%. A builder report that uses Zillow data puts the median sale price at $700,086 for March. All three are medians of real sales.
They can all be true at once, because they cover different months, different areas and different mixes of homes. In a place where one street holds a 1950s bungalow and the next holds a new three-story townhouse, a median can swing by a third when the mix of sales changes, with no change in what any single house is worth. The Realtor.com listing median tells a calmer story: $499,000, up 0.67% on the year. Prices that people ask have barely moved, and prices that people paid have jumped around.
This brief sets the sources side by side, shows where they conflict, adds Census facts about the postal area, notably that 54% of its homes are rented, and adds a Houston area series. It then explains plainly what a private sale changes and what it does not. It does not estimate what any particular house is worth.
Key Findings
- Realtor.com reported, with key indicators as of June 2026, a median listing price of $499,000 for Spring Branch East (up 0.67% on the year and down 0.48% on three years), a median sold price of $439,701 (down 28.37% and down 8.81%) and $239 per square foot (down 1.90% and down 2.03%) (Realtor.com, Spring Branch East housing market).
- The same page reported 229 homes for sale (down 3.80% on the year and up 33.33% on three years), a median of 36 days on market (down 15.56%), 127 rental properties, a median rent of $1,950 (up 20%) and a sale-to-list ratio of 98%, with homes selling an average of 2.03% below asking, and called it a buyer's market.
- Redfin reported, for the postal area in February 2026, a median sale price of $650,000 (up 35.0%), $299 per square foot (up 12.0%), 90 homes sold (down 22.4% from 116), a median of 62 days on market against 43, a sale-to-list ratio of 96.6% and 8.9% of homes sold above list (Redfin, housing market).
- Realtor.com's page for the postal area, with indicators as of March 2026, showed a median listing price of $625,000 (up 4.34%), 316 homes for sale, a median of 39 days on market and a sale-to-list ratio of 97% (Realtor.com, postal area market data).
- A builder report using Zillow data, reviewed in June 2026, gave a typical home value of $616,654 (up 1.4%) for April, a median sale price of $700,086 for March, 14 days to pending, 190 homes for sale and a sale-to-list ratio of 0.980 (BuildersBuddy, Spring Branch report).
- In the Houston area, the median days on market was 49 in May 2026 and 55 in September, and active listings rose from 32,681 in April to 35,920 in August (Realtor.com, days on market; Realtor.com, active listings).
How can a sold median fall 28 percent while the listing median stays flat?
The Realtor.com page shows a median listing price of $499,000 and a median sold price of $439,701. The sold figure is $59,299 below the listing one, which is 11.9% of the listing median. A year earlier the picture was reversed. Working back from the stated changes, the listing median was about $496,000 and the sold median about $614,000, so homes then sold for about 24% more than the typical home was listed for. Today they sell for 12% less.
A listing median and a sold median are taken from different groups. The first describes homes for sale on one day, and the second describes homes that closed in a period. If the closings last year were mostly large, newer or renovated homes and the closings this year were mostly small, older ones, the sold median falls even if every house keeps its value. The page does not give a count of sales, and a neighborhood with a few dozen sales in a period is open to that swing. That reading is this brief's inference.
The price per square foot supports it. It fell only 1.90% over the year, to $239, while the sold median fell 28.37%. If values per foot hardly moved and the price of the typical sale dropped by more than a quarter, the typical home sold must have been much smaller. Dividing the listing median by its price per foot gives about 2,090 square feet. That is a median divided by a median and only a rough guide, but it is a size that matches a mix of older bungalows and newer townhomes.
For an owner, the lesson is that a headline of a 28% fall says almost nothing about the owner's own house. The comparison that matters is the price per foot of the nearest sales of homes like it, from the last six months, matched for lot, age and condition. A bungalow on a 6,000 square foot lot and a three-story townhome on a 2,000 square foot lot are priced by different buyers, and they move differently.
| Source and period | Measure | Value |
|---|---|---|
| Realtor.com, June, neighborhood | Median sold price | $439,701 (down 28.37%) |
| Realtor.com, June, neighborhood | Median listing price | $499,000 (up 0.67%) |
| Redfin, February, postal area | Median sale price | $650,000 (up 35.0%) |
| Zillow via a builder report, March | Median sale price | $700,086 |
| Zillow via a builder report, April | Typical home value | $616,654 (up 1.4%) |
| Census, 2020-2024 | Median value of owner homes | $624,200 |
Source: Realtor.com, Redfin, BuildersBuddy (Zillow data) and the U.S. Census Bureau as cited. The $59,299, the 11.9%, the implied last-year medians of about $496,000 and $614,000, the 24%, the 12% and the size of about 2,090 square feet are this brief's arithmetic from stated figures. The explanation by mix is this brief's inference. Commercial content; not independently verified.
Why do three sources put the median sale at $439,701, $650,000 and $700,086?
The first reason is geography. Realtor.com's $439,701 is for a neighborhood. Redfin's $650,000 and the builder report's $700,086 are for the whole postal area, which also covers other neighborhoods, and the Realtor.com page for the postal area shows named subdivisions such as Monarch Oaks and Spring Oaks that are not part of the Spring Branch East page. The postal area's median home value in the Census, $624,200, sits between the three. A neighborhood median below the area median would be normal if the neighborhood has smaller or older homes.
The second reason is time. Redfin's figure is for February, the builder report's for March and Realtor.com's for June, with charts through May. The months alone are unlikely to explain a gap of $260,385 between $700,086 and $439,701. The lowest figure is 62.8% of the highest.
The third is sample size. Redfin counted 90 sales in February, down 22.4% from 116. A median of 90 sales across a postal area of 18,349 homes is a thin base, and a few large sales can move it. Redfin's own year-on-year changes are large: the median up 35.0% and the price per foot up 12.0%. Taken together they suggest, as this brief infers, that the homes that sold in February were bigger than those of the year before. The builder report itself notes that it has no comparable sales recorded and says its figures should be read as directional. It is a useful warning for the others, and an owner should ask any source how many sales stand behind its median before leaning on it. A median of a few dozen sales says less than one of a few hundred, and a page that does not give the count has hidden the most important fact about its own number.
The Zillow typical value of $616,654 is a different kind of figure. It is an estimate for the middle of the home value range and is not a median of sales. It sits $7,546, or 1.2%, below the Census median value of $624,200. That the two agree so closely suggests that the typical owned home in the postal area is worth about $620,000, and that the lower neighborhood median reflects the mix of homes that closed. That is this brief's reading.
Source: Realtor.com, Redfin, BuildersBuddy and the U.S. Census Bureau as cited. The $260,385, the 62.8%, the $7,546 and the 1.2% are this brief's arithmetic. The explanations are this brief's inferences. The builder report's own caveat is quoted from its page. Commercial content; not independently verified.
Do the days on market agree, from 14 to 62?
No. Realtor.com reports a median of 36 days for the neighborhood in June, down 15.56% on the year, and 39 days for the postal area in March. Redfin reports 62 days for February, up from 43, an increase of 19 days. It also rates the area somewhat competitive, with homes selling in 50 days on average and going pending in about the same time. The builder report gives 14 days to pending for April. The measures run from 14 to 62, a factor of more than four.
The measures are not the same. Days to pending stops when a buyer signs, and days on market runs until closing or removal. A home that goes under contract in 14 days may take another 30 to close. Redfin's own figures show the effect: its competitive homes go pending in about 12 days, and the average home in about 50, while it says the typical home sells for about 3% below list.
The neighborhood rows tell their own story. Shadyvilla has a median of 30 days, up 36.36% on the month and down 58.33% on the year. Pine Terrace has 38 days, up 11.77% on the month and 18.75% on the year. Shadyvilla's year-ago figure would have been about 72 days, so it has more than halved. A single subdivision with 12 homes for sale can change by that much when a few sell. This brief reads the rows as noise.
The Houston area series shows a slower summer: the median days on market was 49 in May, 50 in June and July, 52 in August and 55 in September, a rise of 6 days, or 12.2%. A seller who lists into that market meets a clock that is lengthening slowly, and the posted days in the sources are the days of an earlier month.
Source: Realtor.com, Redfin, BuildersBuddy and the Federal Reserve Bank of St. Louis as cited. The 19 days, the factor of more than four, the implied year-ago figure of about 72 days, the 6 days and the 12.2% are this brief's arithmetic. The reading of the neighborhood rows as noise is this brief's inference. Commercial content; not independently verified.
What does the neighborhood table show, and what do the Census figures say?
The Realtor.com table lists 14 named subdivisions and 44 homes for sale among the 229. Shadyvilla has 12, Pine Terrace 10, Long Point Oaks 6, Craig Woods 4, Melody Oaks and Park at Shady Villa West 3 each, Wellington Court and Whispering Pines Estates 2 each, and two others 1 each. That is 19.2% of the total. Four rows have none. Shadyvilla's median listing price is $663,750 at $271 a foot and Pine Terrace's is $589,900 at $324 a foot. Both are above the neighborhood's $499,000, so the other homes must be cheaper, and the higher price per foot in Pine Terrace on a lower price suggests smaller houses: about 1,820 square feet against about 2,450 in Shadyvilla.
The Census profile for the postal area counts 45,435 people and 18,349 housing units (Census Reporter, Spring Branch area profile). Of the 16,680 occupied homes, 7,665 are owner-occupied, which is 46.0%, and 9,015 are rented, which is 54.0%. Vacancy is 9.1%. The median household income is $74,369, per capita income is $53,780, the median age is 35.2, 41.6% of adults have a bachelor's degree or higher, 35.7% of residents were born abroad, mean travel time is 24.9 minutes and 14.9% moved in the last year.
The stock is mid-century. The median year built is 1977, and 54.9% of units were built before 1980. The 1950s are the largest decade with 3,758 units, or 20.5%, followed by the 1970s with 3,459, or 18.9%. There is also a bulge of new homes: 2,960 built in the 2010s and 679 since 2020, together 3,639 units, or 19.8%. A place with two bulges, one from the 1950s and one from the last 16 years, is a place where older houses are being replaced by newer ones. That is an inference, and the Census does not show demolitions.
The median home value is $624,200, with a margin of error of $53,444, or 8.6%. It is 8.4 times the median household income of $74,369. The median rent in the Census is $1,263, and the Realtor.com median rent of $1,950 is 54.4% above it. The first is an average of five years for all renters and the second is for homes advertised now.
| Neighborhood | Median listing price | Homes for sale | Median days on market |
|---|---|---|---|
| Shadyvilla | $663,750 | 12 | 30 |
| Pine Terrace | $589,900 | 10 | 38 |
| Long Point Oaks | not shown | 6 | not shown |
| Craig Woods | not shown | 4 | not shown |
| Melody Oaks and Park at Shady Villa West | not shown | 3 each | not shown |
| Spring Branch East overall | $499,000 | 229 | 36 |
Source: Realtor.com and the U.S. Census Bureau (American Community Survey 2020-2024, through Census Reporter) as cited. The sum of 44, the 19.2%, the sizes of about 1,820 and 2,450 square feet, the shares, ratios and gaps are this brief's arithmetic. The reading of replacement is this brief's inference. The postal area is not the same as the neighborhood.
What does it mean that 54 percent of the homes are rented?
It means that a large share of the housing is owned by investors and landlords as well as by the people who live in it. The Census counts 9,015 rented homes against 7,665 owner-occupied. The Realtor.com neighborhood page counts 127 rental properties against 229 homes for sale, and its postal-area page showed 180 rentals in March, down 37.04% on the year. The rental counts are small next to 9,015, because most rentals are not on the market at one time.
The renter share matters to a seller in two ways. First, some buyers are investors, and an investor prices a home by its rent. The builder report gives a median rent of $1,492 and a price-to-rent ratio of 39.1, which is $700,086 divided by a year of that rent. Using Realtor.com's rent of $1,950 and the sold median of $439,701 gives a ratio of about 18.8. Both are crude, and they show how far apart the rent and price pictures are.
Second, a market with many renters has an easy alternative to buying, which limits what a buyer will pay for a home that needs work. Poverty is high in the postal area, 20.9% with a margin of 3.8 points, and the median income is $74,369, which is a smaller income than the price of a median home implies. A buyer who needs a mortgage on $439,701 at this income is stretching. That is a general observation and not a statement about any buyer.
For an owner of an older house, such as a 1950s bungalow, the likely buyers are an investor, a builder or a household that plans to rebuild. The BuildersBuddy report describes the area as a high-price, quick-moving infill market in which buyers have budgets for teardowns and remodels. It is a builder's view and is not independent. The point for a seller is that the buyer who sees the most value in a lot is often not the one who walks through the house. Readers comparing markets can also read the Memorial Villages brief and the Oak Forest brief.
Source: U.S. Census Bureau, Realtor.com and BuildersBuddy as cited. The ratios of 39.1 and about 18.8 are this brief's arithmetic. The remarks on buyers are this brief's inferences. The builder report's description is commentary and has not been checked. Commercial content; not independently verified.
What does the Houston area add, and what does a private sale change?
The Houston series come from one source. Active listings rose from 32,681 in April to 35,920 in August, up 9.9%. New listings fell from 11,566 to 9,512, down 17.8% (Realtor.com, new listings). Price reductions rose from 10,104 in May to 11,002 in September, up 8.9% (Realtor.com, price reductions). The regional median listing price eased from $360,000 to $353,995, and the neighborhood's $499,000 is 1.4 times it. More homes, fewer new ones and more cuts describe a market that is slowing.
The fee arithmetic is simple. At the Realtor.com sold median of $439,701, each 1% is about $4,397, so 3% is about $13,191 and 5% is about $21,985. At the Redfin median of $650,000, 1% is $6,500, 3% is $19,500 and 5% is $32,500. These show what each percentage point is worth. They are not a prediction of what any seller would pay.
A public sale of an older house means showings, a buyer's inspection and repair requests, which is a heavy load for a house built in 1977, the Census median year, or earlier. A private sale with Maison Off-Market changes that. There are no showings and no neighbors talking about you selling. The closing date can be flexible, so there is time to find a new home. There are no commission costs, no closing costs, and no inspections or repairs. This brief does not claim that a private sale always yields more than a public one.
If you would like a private, no-obligation offer for a Spring Branch East home, call 401-219-4207 or use the contact form on this site.
Source: Realtor.com series published by the Federal Reserve Bank of St. Louis, and Maison Off-Market, as cited. The 9.9%, 17.8%, 8.9% and 1.4 times and the fee figures are this brief's arithmetic and not claims about any sale. The series name was checked against the series page.
Methodology and limitations
Prices, price per square foot, days on market, listing and rental counts, rents, the sale-to-list ratio and the neighborhood table come from a national listing site page with key indicators as of June 2026 and charts through May. Postal-area figures come from a second page of the same site as of March 2026, from Redfin's page for February 2026 and from a builder report that reproduces Zillow data. The sources cover different periods and areas and are not independent.
Census figures come from the American Community Survey 2020-2024 five-year estimates for the postal area, through Census Reporter. Regional series are Realtor.com data published by the Federal Reserve Bank of St. Louis for the Houston area, and the series name was checked on the series page. Percentages, gaps, ratios and fee amounts are this brief's own arithmetic and are labeled as such. Where a reading goes beyond what a page says, it is called an inference. Commercial pages are not independently verified.
Conclusion
The Spring Branch East record shows a median sold price of $439,701 down 28.37% on one page, $650,000 up 35.0% on another and $700,086 on a third, a listing median that has barely moved, days on market from 14 to 62 depending on the measure, and a postal area in which 54.0% of homes are rented. It describes a market in which the mix of homes sold moves the medians more than prices do.
It does not fix a price for any one home. The choice between a public listing and a private sale comes down to whether an owner would rather meet showings, inspections and repair requests, or sell quietly on a date that suits them. Maison Off-Market speaks only to sellers, and a conversation costs nothing.
Frequently Asked Questions
What is the median home price in Spring Branch East?
It depends on the source. Realtor.com reports a median sold price of $439,701 and a median listing price of $499,000 for June 2026. Redfin reports $650,000 for the postal area in February, and a builder report using Zillow data reports $700,086 for March.
How long do Spring Branch East homes take to sell?
Realtor.com reports a median of 36 days for June. Redfin reports 62 days for February. A builder report using Zillow data reports 14 days to pending for April.
Is Spring Branch East a buyer's market?
Realtor.com calls it a buyer's market for June 2026, with a sale-to-list ratio of 98% and homes selling an average of 2.03% below asking. Redfin reports 96.6% for February.
How many homes in the area are rented?
The Census reports that 54.0% of occupied homes in the postal area that includes Spring Branch East are rented, which is 9,015 of 16,680.
What is the difference between a private sale and a public listing?
A private sale with Maison Off-Market has no showings, a flexible closing date, no commission costs, no closing costs and no inspections or repairs. A public listing exposes the home to a wider group of buyers. This brief does not claim either always gets a higher price.
Compare your options before committing. Request a written private offer for your property, with no obligation, then weigh it against your listing plan.
Sources
- Realtor.com, 2026. Spring Branch East in Houston, TX Housing and Rental Market. https://www.realtor.com/local/market/texas/houston/spring-branch-east.
- Redfin, 2026. Housing Market, Houston, TX. https://www.redfin.com/zipcode/77055/housing-market.
- Realtor.com, 2026. Postal Area Housing Market Data, Houston, TX. https://www.realtor.com/local/market/texas/zipcode-77055.
- BuildersBuddy, 2026. Spring Branch 2026 Builder Report. https://buildersbuddy.org/markets/77055-spring-branch.
- Realtor.com, 2026. Housing Inventory: Median Days on Market in Houston-the Woodlands-Sugar Land, TX (CBSA). https://fred.stlouisfed.org/series/MEDDAYONMAR26420.
- Realtor.com, 2026. Housing Inventory: Active Listing Count in Houston-the Woodlands-Sugar Land, TX (CBSA). https://fred.stlouisfed.org/series/ACTLISCOU26420.
- U.S. Census Bureau, 2026. American Community Survey 2020-2024 five-year estimates, the Spring Branch East area (via Census Reporter). https://censusreporter.org/profiles/86000US77055-77055/.
- Realtor.com, 2026. Housing Inventory: New Listing Count in Houston-the Woodlands-Sugar Land, TX (CBSA). https://fred.stlouisfed.org/series/NEWLISCOU26420.
- Realtor.com, 2026. Housing Inventory: Price Reduced Count in Houston-the Woodlands-Sugar Land, TX (CBSA). https://fred.stlouisfed.org/series/PRIREDCOU26420.
Related research

Seller Guide · October 6, 2026
How to Prepare Point Pleasant Beach Rental Records Before Selling
Separate rental approval, income history and booked stays before comparing sale terms.

Seller Guide · October 6, 2026
How to Prepare Rumson Flood and Waterfront Records Before Selling
Separate flood disclosure, elevation, repairs and waterfront rights before comparing sale terms.

Seller Guide · October 6, 2026
How to Prepare Sarasota Condo Inspection and Reserve Records Before Selling
Separate building condition, reserve funding and resale documents before comparing sale terms.