Market Brief · by Aidan Sowa · October 5, 2026
Does a Garden Oaks Home Sell in Days or in Months? Reading a Listing Median and a Sale Median
Reading a Listing Median and a Sale Median for Garden Oaks, TX, with each source dated and its limits noted, for owners weighing a listing against a direct sale.
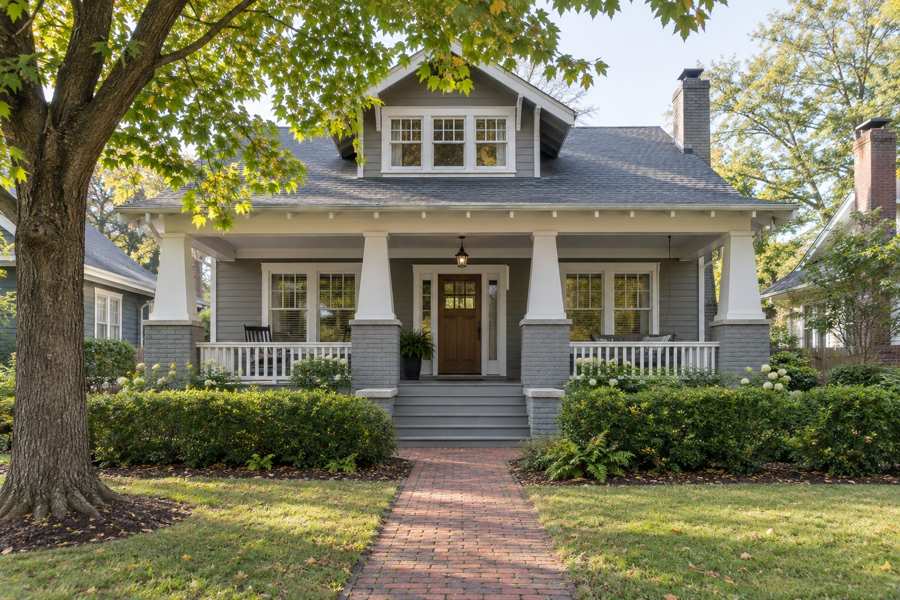
Does a Garden Oaks home sell in 26 days or 127? Two public pages describe this Houston neighborhood in the same year and give answers that differ by a factor of almost five. Realtor.com's neighborhood page shows a median of 26 days on market for homes for sale in June 2026, down 50.94% on the year. A page built on the Houston multiple listing service, updated on October 4, 2026, shows an average of 127 days for homes that sold, up 14 days on the year.
The prices do not agree either. Realtor.com shows a median listing price of $1,447,000, up 44.85% on the year and down 15.63% in a month. The same MLS-based page shows a median sale price of $880,500, up 11.5%. Redfin's figure for the three months to March was about $737,000, down 22.4%. The listing median is 1.64 times the sale median and 1.96 times Redfin's figure. All three are reported as the Garden Oaks price.
Maison Off-Market buys luxury homes and estates directly from their owners and speaks only to sellers. We do not estimate what any home is worth, and nothing here is a valuation. This brief reads what the pages say, shows where they contradict each other and states what a percentage of a price is worth in dollars. Every figure is attributed, every calculation is this brief's own arithmetic and every inference is labeled as one.
Key Findings
- Realtor.com, with indicators as of June 2026, showed a median listing price of $1,447,000 (up 44.85% on the year), $392 per square foot, 48 active listings (down 8.16%), a median of 26 days on market (down 50.94%) and a median rent of $1,940 (Realtor.com, Garden Oaks market data).
- A page built on the HAR multiple listing service, for single-family homes over $125,000, showed on October 4, 2026 a median sale price of $880,500 (up 11.5%), an average of 127 days on market (up 14), September sales up 67%, new pending sales down 67% and 160% more price reductions than a year earlier (Houston Properties, Garden Oaks housing market).
- A local blog dated September 29, 2026 quoted Redfin for a Garden Oaks median sale price of about $737,000 for the three months to March 2026, down 22.4%, at about $385 per square foot and roughly 76 days on market, and quoted HAR for about 44 homes for sale at an average list price near $1.35 million (Houston Heights Life, fall market watch).
- A builder-oriented page for the postal area, using Zillow data reviewed in June 2026, showed a median sale price of $573,100 for March, 26 days to pending, a sale-to-list ratio of 0.976 and 192 homes for sale in April (BuildersBuddy, Garden Oaks and Oak Forest market report).
- A discount brokerage's page for the postal area, from Realtor.com data for July 2026, showed 347 active listings, a median listing price of $514,675 (down 6.4%), an average of $839,186 and 37 days on market (SELL123, Garden Oaks market update).
- The Census shows a postal area with 31,031 residents and 13,831 homes, of which 62.7% were built before 1980, with a median year built of 1967 (Census Reporter, American Community Survey profile).
Why is it 26 days on one page and 127 on another?
The two numbers measure different things. Realtor.com's 26 is a median for homes that are for sale, as reported for June. The other page's 127 is an average for homes that sold, and its method note says it averages the trailing four weeks of a days-on-market graph for sold properties. A median ignores the few homes that sat for a long time, and an average counts them in full. In a neighborhood where a handful of expensive custom homes can sit for months, the gap between the two statistics can be large without either page making a mistake. That explanation is this brief's inference, since neither page publishes the underlying list.
The second difference is timing. One page describes June and the other describes a window that ends in early October. A home that sold in September may have been listed in the spring, and a home listed in June is only counted by the first page if it was still for sale. The windows overlap but do not match.
The third is who counts. The MLS-based page covers single-family homes over $125,000 and excludes lots. The Redfin figure quoted by the blog is for the three months to March and says about 76 days, which sits between the other two. The builder page, using Zillow, says 26 days to pending in April, which matches Realtor.com's 26 and is a different clock again.
A seller reading all four sees 26, 26, 76 and 127 and might conclude that the market is in chaos. That would be the wrong conclusion. It is a market in which the statistic chosen decides the answer, and the first step for any owner is to pick the statistic that matches the question being asked. A better reading is that quick sales and slow sales are both happening, and that the typical figure hides the spread. The 26 days belong to homes that were priced to sell. The 127 days include everything else.
| Source | Price figure | Time figure |
|---|---|---|
| Realtor.com, June | $1,447,000 median listing | 26 days median, for sale |
| MLS-based page, October | $880,500 median sale | 127 days average, sold |
| Redfin via a blog, three months to March | About $737,000 median sale | About 76 days |
| Zillow via a builder page, March and April | $573,100 median sale (postal area) | 26 days to pending |
| Realtor.com via a brokerage, July | $514,675 median listing (postal area) | 37 days |
Source: the pages as cited. The 1.64 and 1.96 times figures are this brief's arithmetic. Commercial content; not independently verified.
Why is the median listing price $1,447,000 when homes sell for $880,500?
Realtor.com's median listing price for Garden Oaks was $1,447,000 in June, up 44.85% on the year and down 15.63% in the month. A swing of that size in a month is a sign of a small sample. The page shows 48 homes for sale, and when 48 homes make up a median, a few new listings at the top of the market can move it by hundreds of thousands of dollars. The page's own price per square foot, $392, moved only 0.66% on the year, which suggests that the homes were not much more expensive per square foot and were probably larger. That is an inference.
The blog adds a clue. It describes Garden Oaks as two markets under one name. Original ranch homes, when priced realistically, still draw steady interest, and the latest new construction sells in a different price range, often with more patience required. HAR's September listing snapshot, quoted by the blog, showed 44 homes for sale with an average list price near $1.35 million, a figure that it says is pulled up by sought-after new builds at the top. A HAR blog post puts Garden Oaks lots at 12,000 to 17,000 square feet, with price per square foot near $400, which is another reason the price of a home here depends on the land under it (HAR.com, Oak Forest and Garden Oaks home values).
The sale side of the market looks quite different. The MLS-based page shows a median sale of $880,500, which is 61% of the Realtor.com listing median. The Redfin figure of about $737,000 is 51% of it. These percentages are this brief's arithmetic. They compare homes listed in one month with homes sold over a longer window, so they are not discounts.
The sale-to-list ratios are the better guide to negotiation. Realtor.com says homes in Garden Oaks sold for approximately the asking price in June. The builder page, using Zillow data for the postal area, shows a ratio of 0.976 in March, which is 2.4% below the ask. Neither number says that sellers got what they asked at the start. A final price that equals the last asking price can still be well below the first one, and none of these pages publishes the share of homes that reduced before selling for Garden Oaks alone. The only reduction figures here are the MLS-based page's 160% rise and the county series.
What does the sub-neighborhood table add up to?
Realtor.com's Garden Oaks page breaks the 48 listings down by named area. Oak Grove has 25, Lowell Heights 14, Blueberry Terrace 7, Garden Home 6, Northmore 5, Oakridge 4, Contemporary Garden Oaks 2, Garden Oaks Court 2, Sunny Hollow 2, Avanzini 1 and Tulane Terrace 1. Those eleven rows add up to 69, which is 21 more than the headline of 48.
The page does not explain the difference. The likeliest reading, which is this brief's inference, is that some of the named areas overlap or extend beyond the neighborhood boundary that the headline uses, so the same listing can be counted more than once or counted in a wider area. The table also gives separate figures for Oak Grove, with a median listing price of $575,000, $263 per square foot and 28 days, and Lowell Heights, at $429,900, $226 per square foot and 65 days. Both are far below the $1,447,000 headline.
That is worth a pause. If two of the named areas have listing medians of $575,000 and $429,900 and the neighborhood headline is $1,447,000, the headline cannot be the typical home in the table. It is the typical home in whatever boundary the headline uses, and that boundary is not published. A seller who reads the headline and assumes it applies to their street should check which of the named areas the street belongs to.
The discount brokerage's page for the postal area adds another layer. It lists Garden Oaks, a second Garden Oaks entry labeled Oak Forest, and Independence Heights as the neighborhoods in the postal area, and gives a median listing price of $514,675 and an average of $839,186. The average is 1.63 times the median, a sign of a skewed distribution with a tail of expensive homes. The ratio is this brief's arithmetic.
What does the Census say about the age of the homes?
The Census profile covers a postal area that includes both Garden Oaks and Oak Forest, so its figures describe a larger group of homes than the neighborhood alone. This brief used the income, value and tenure cuts in the Oak Forest post and uses the age of the stock here. The median year built is 1967. The 1950s is the largest decade, with 3,296 of 13,831 homes, and the 1960s follows with 2,652. Together those two decades are 43.0% of the stock.
A second group is new. 2,656 homes were built in the 2010s and 646 since 2020, which together are 3,302, or 23.9%. That is nearly one home in four built in the last fifteen years or so, in an area where 62.7% of homes are older than 1980. Only 383 homes, or 2.8%, were built before 1940, and 1,313 in the 1940s. A neighborhood page on HAR says Garden Oaks was developed in the 1940s with big lots and traditional, ranch and cottage designs (HAR.com, Garden Oaks neighborhood page). The Census cut shows that most of the postal area's stock came after that.
This helps explain the price spread. A buyer in Garden Oaks may be choosing between an original ranch from the postwar decades and a new house on a rebuilt lot, and the two are not the same product. The median of all sales mixes them, as does the median of all listings. The HAR-based figures count only single-family homes over $125,000, and the Zillow-based page covers a wider set.
Two pages also disagree about the area's people. The discount brokerage's page shows a population of 28,892 and a median household income of $111,524 for the same postal area. The Census Reporter profile shows 31,031 residents. The brokerage does not say which survey year it uses, so the difference is unexplained. Income here would need a vintage before it could be compared. A seller who wants to know how many local households could afford a given price should ask for the survey year first, and then divide a price by the income of that year only.
What do the Harris County series add?
Realtor.com publishes county series through the Federal Reserve Bank of St. Louis. The Harris County median days on market was 47 from April to June and 50 in August, up 6.4% (Realtor.com, days on market). The count of listings with a price reduction was 5,014 in April and 6,056 in August (Realtor.com, price reduced count), up 20.8%. Active listings were 18,656 in July (Realtor.com, active listings), and the county median listing price was $335,000 in June (Realtor.com, median listing price).
The Garden Oaks listing median on Realtor.com is 4.3 times the county's $335,000, and the county figure is 23% of it. The percentages are this brief's arithmetic. Garden Oaks is a high-priced pocket of a county that has 18,656 homes for sale, and the county trend of more reductions and longer waits sits behind the neighborhood's numbers. The MLS-based page says that price reductions in Garden Oaks were up 160% on the year and new pending sales were down 67%. Those are larger moves than the county's, and this brief infers that they may rest on small counts, which the page does not give.
Reading the county and the neighborhood together, the direction is shared and the size is not. This is a county series, so it does not show what any Garden Oaks home would sell for. The series titles were checked on their series pages. Readers comparing markets can also read the Oak Forest brief and the Afton Oaks brief.
Source: Realtor.com series published by the Federal Reserve Bank of St. Louis as cited. The 6.4%, 20.8%, 23% and 4.3 times figures are this brief's arithmetic. The series names were checked against the series pages.
What should an owner ask, and what does a private sale change?
Ask whether a number counts homes for sale or homes that sold, whether it is a median or an average, and how many homes are behind it. Ask which of the named areas your street is in, and which decade your house belongs to. A seller whose home is an original ranch should ask about ranches, and a seller whose home is a new build should ask about new builds.
A private sale changes how a home reaches a buyer. With Maison Off-Market there are no showings and no neighbors talking about a sale, the closing date can be flexible so that an owner has time to find a new home, there are no commission costs, there are no closing costs and there are no inspections or repairs. For an owner of a house built in the 1950s on a large lot, a buyer's inspection can be long, so skipping it may matter most. This brief does not claim that a private sale always brings a higher price than a public listing.
Fee arithmetic shows why the commission point matters, without assuming any rate. Each 1% of a sale price is $7,370 at $737,000, $8,805 at $880,500 and $14,470 at $1,447,000. At 3% those amounts are $22,110, $26,415 and $43,410. At 5% they are $36,850, $44,025 and $72,350. These are illustrations of what a percentage means on each of the figures in this brief, and they are not a statement of what any agent charges or what any sale would cost.
Timing is the other thing an owner controls. A public listing starts a clock that buyers can see, and the pages above show anything from 26 to 127 days. A private sale lets the owner choose the closing date, which matters most to people who need to find the next home first.
Privacy is the point owners of larger homes raise most often. A public listing puts photographs, a price history and the dates of every price change in front of anyone with a phone, and neighbors read them too. A private sale keeps those details out of view. That is a matter of preference and not a claim about price, and an owner is free to weigh it however they like. If you are weighing a sale of a Garden Oaks home, one conversation costs nothing and obliges you to nothing. We ask about the home, the timing you would like and what you would need from a buyer, and we say plainly whether a private sale fits.
If you would like a private, no-obligation offer for a Garden Oaks home, call 401-219-4207 or use the contact form on this site.
Methodology and limitations
Prices, days on market, counts and sub-neighborhood figures come from Realtor.com's neighborhood page with indicators as of June 2026, a page built on the Houston multiple listing service and updated on October 4, 2026, a local blog dated September 29, 2026 that quotes Redfin and HAR, a builder-oriented page using Zillow data reviewed in June 2026 and a discount brokerage's page using Realtor.com data for July 2026. The sources cover different areas, home types and periods, and most are commercial pages, so they are not independent of each other.
Census figures come from the American Community Survey 2020-2024 five-year estimates for the postal area, through Census Reporter. County series are Realtor.com data published by the Federal Reserve Bank of St. Louis for Harris County, Texas, and the series titles were checked on the series pages. Percentages, gaps, ratios and fee amounts are this brief's own arithmetic and are labeled as such. Where a reading goes beyond what a page says, it is called an inference. No agent names, contact details or street addresses from the pages are reproduced.
Conclusion
The Garden Oaks record shows 26 days on one page and 127 on another, a listing median of $1,447,000 against sale figures of $880,500 and about $737,000, a sub-neighborhood table that sums to 69 against a headline of 48, and a postal area where 23.9% of homes were built since 2010. The numbers differ because the statistics, the homes, the boundaries and the months differ.
It does not fix a price for any one home. The choice between a public listing and a private sale comes down to whether an owner would rather meet showings, price reductions and a public clock, or sell quietly on a date that suits them. Maison Off-Market speaks only to sellers, and a conversation costs nothing.
Frequently Asked Questions
What is the median home price in Garden Oaks, Houston?
It depends on the source. Realtor.com shows a median listing price of $1,447,000 for June 2026. An MLS-based page shows an $880,500 median sale price in October. Redfin, as quoted by a local blog, shows about $737,000 for the three months to March.
How long do homes take to sell in Garden Oaks?
Realtor.com shows a median of 26 days on market for homes for sale in June. An MLS-based page shows an average of 127 days for homes that sold. Redfin, via a blog, shows about 76 days. The sources use different statistics and periods.
Why do the Garden Oaks numbers differ so much?
The pages measure listings, sales and estimates, with different boundaries, home types and months. A few expensive new homes also move a small neighborhood median a long way.
What does the Census say about Garden Oaks housing?
The postal area that includes Garden Oaks has a median year built of 1967, with 62.7% of homes built before 1980 and 23.9% built since 2010.
What is the difference between a private sale and a public listing?
A private sale with Maison Off-Market has no showings, a flexible closing date, no commission costs, no closing costs and no inspections or repairs. A public listing exposes the home to a wider group of buyers. This brief does not claim either always gets a higher price.
Compare your options before committing. Request a written private offer for your property, with no obligation, then weigh it against your listing plan.
Sources
- Realtor.com, 2026. Garden Oaks Neighborhood of Houston, TX Housing Market. https://www.realtor.com/local/market/texas/houston/garden-oaks.
- Houston Properties, 2026. Garden Oaks Housing Market. https://www.houstonproperties.com/housing-market/garden-oaks.
- Houston Heights Life, 2026. Market Watch: Garden Oaks, Oak Forest and Timbergrove This Fall. https://houstonheightslife.com/blog/garden-oaks-oak-forest-timbergrove-market-2026/.
- BuildersBuddy, 2026. Garden Oaks and Oak Forest Market Report. https://buildersbuddy.org/markets/77018-garden-oaks-oak-forest.
- SELL123, 2026. Garden Oaks Real Estate Market Update. https://sell123.com/real-estate-market-update-77018.
- U.S. Census Bureau, 2026. American Community Survey 2020-2024 five-year estimates, the Garden Oaks area (via Census Reporter). https://censusreporter.org/profiles/86000US77018-77018/.
- HAR.com, 2026. Oak Forest and Garden Oaks Home Values Heading Into Summer. https://www.har.com/blog_145635_what-oak-forest-and-garden-oaks-home-values-look-like-heading-into-summer.
- HAR.com, 2026. Garden Oaks (Harris) in Houston, TX. https://www.har.com/pricetrends/garden-oaks-harris-realestate/894.
- Realtor.com, 2026. Housing Inventory: Median Days on Market in Harris County, TX. https://fred.stlouisfed.org/series/MEDDAYONMAR48201.
- Realtor.com, 2026. Housing Inventory: Price Reduced Count in Harris County, TX. https://fred.stlouisfed.org/series/PRIREDCOU48201.
- Realtor.com, 2026. Housing Inventory: Active Listing Count in Harris County, TX. https://fred.stlouisfed.org/series/ACTLISCOU48201.
- Realtor.com, 2026. Housing Inventory: Median Listing Price in Harris County, TX. https://fred.stlouisfed.org/series/MEDLISPRI48201.
Related research

Seller Guide · October 6, 2026
How to Prepare Point Pleasant Beach Rental Records Before Selling
Separate rental approval, income history and booked stays before comparing sale terms.

Seller Guide · October 6, 2026
How to Prepare Rumson Flood and Waterfront Records Before Selling
Separate flood disclosure, elevation, repairs and waterfront rights before comparing sale terms.

Seller Guide · October 6, 2026
How to Prepare Sarasota Condo Inspection and Reserve Records Before Selling
Separate building condition, reserve funding and resale documents before comparing sale terms.