Market Brief · by Aidan Sowa · October 5, 2026
Which Las Olas Is Your Home, the Waterfront One or the Inland One? Reading Very Different Median Listing Prices
Reading Very Different Median Listing Prices for Las Olas, FL, with each source dated and its limits noted, for owners weighing a listing against a direct sale.
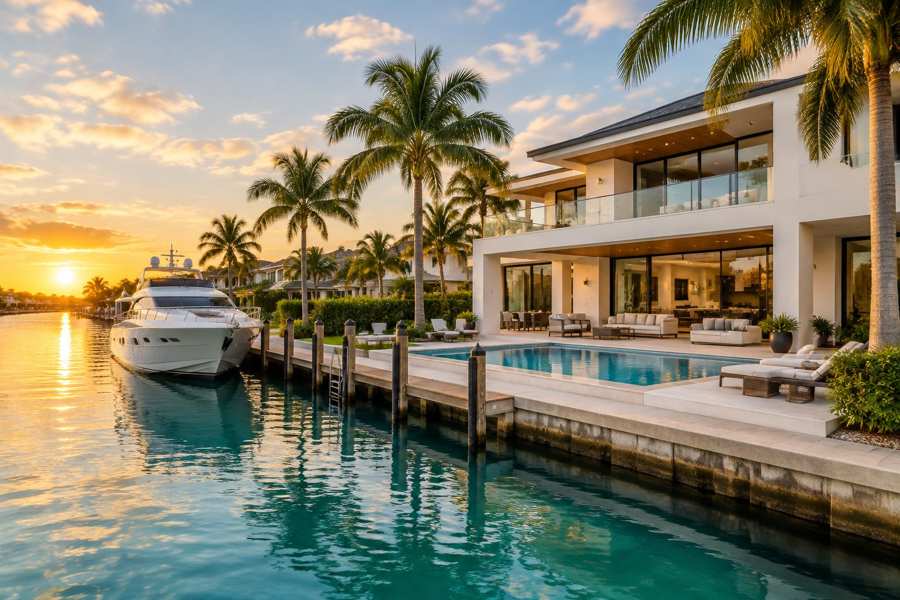
What is a typical listing in Las Olas? It depends on which Las Olas. Realtor.com's page for Las Olas Isles, the canal neighborhood of waterfront houses, gives a median listing price of $7,747,500 in August 2026, up 7.15% on the year, with 28 homes for sale and a wait of 115 days. A market report for the Las Olas district, which runs along the boulevard and is mostly condominiums, gives a median asking price of $750,000 for the third quarter, 43 active listings and an average wait of 165 days. The first median is more than ten times the second.
Both are right. They describe two kinds of property under one famous name. The Isles page has a rent of $40,000 a month, up 60%. The district report has an average rent of $4,215. A reader who sees only one page would think Las Olas was either a market for estates at $7.7 million or a market for apartments at $750,000, and a seller who uses the wrong one will price a home badly.
This brief reads the Realtor.com page for Las Olas Isles and the district market report side by side, adds the Census profile of the postal area and the Miami area series, and asks what the numbers mean for an owner who is choosing between a public listing and a private sale.
Key Findings
- Realtor.com reported, as of August 2026, a median listing price of $7,747,500 for Las Olas Isles (up 8.70% on the month, up 7.15% on the year and up 74.30% on three years), a median sold price of $5,409,312, $1,306 per square foot (up 2.34% and up 20.97% on three years), 28 homes for sale (down 5.88% and up 18.52%) and a median of 115 days on market (up 21.26% and up 58.23%).
- The same page gave a sale-to-list ratio of 94%, with homes selling 6.21% below the asking price, and called August 2026 a buyer's market. It counted 16 rentals (up 13.33% on the year) at a median rent of $40,000 a month (up 60%).
- A local brokerage market report for the Las Olas district gave a median asking price of $750,000 ($556 per square foot) for the third quarter of 2026, against $625,000 in the second quarter, $501,000 in the first and $470,000 in the fourth quarter of 2025. It gave 43 active listings as of September 20, an average list price of $948,160, a highest price of $2,900,000, an average wait of 165 days and an average rent of $4,215.
- In the Census postal area that includes Las Olas, 11,403 of 14,581 housing units are occupied, 3,178 (21.8%) are vacant, renters hold 7,163 of the occupied homes (62.8%), the median household income is $124,812 and the owner-estimated median home value is $884,800 (Census Reporter, American Community Survey profile).
- In the Miami-Fort Lauderdale-West Palm Beach area the median days on market was 74 in March 2026 and 85 in July (Realtor.com, days on market).
Which Las Olas is the median describing?
The Isles page counts 28 homes for sale, with a median listing price of $7,747,500 and $1,306 per square foot. A home at that median and that price per foot is about 5,900 square feet. This is the market of large houses on the water, with docks and yacht access. The district report counts 43 active listings, a median asking price of $750,000 and $556 per foot, which describes a home of about 1,350 square feet, probably a condominium.
The district report gives more detail. The average list price is $948,160, which is 26.4% above the median and shows a long tail of expensive homes. The highest price is $2,900,000 and the lowest $285,000. The Isles median is 10.3 times the district median and the Isles price per foot is 2.3 times the district's. No home in the district report is near the Isles median, and the highest price in it is only 37% of it.
The two sources therefore describe different housing. They are not rival estimates of one market. A seller must know which one their home belongs to. A canal house on the Isles competes with the 27 other houses on the Realtor.com page, and a condominium on the boulevard competes with the 43 on the district report. A buyer for one will not look at the other.
The practical lesson is to read the name of the page before reading its numbers. A search for Las Olas can return both, and a headline of $750,000 or $7.7 million may be correct for the wrong kind of home. This brief reports both and keeps them apart.
| Measure | Las Olas Isles, Realtor.com, August | Las Olas district report, third quarter |
|---|---|---|
| Median listing or asking price | $7,747,500 | $750,000 |
| Price per square foot | $1,306 | $556 |
| Homes for sale | 28 | 43 |
| Days on market | 115 (median) | 165 (average) |
| Rent | $40,000 (median) | $4,215 (average) |
Source: Realtor.com page and a local brokerage market report as cited. The 5,900 and 1,350 square foot, 26.4%, 10.3, 2.3 and 37% figures are this brief's arithmetic. The reading of the two kinds of property is this brief's inference from the prices and is not a statement of either source. Commercial content; not independently verified.
What does the Isles page say about asking and selling?
On the Isles page, the median listing price of $7,747,500 is up 7.15% on the year, which implies about $7,231,000 a year earlier, and up 74.30% on three years, about $4,445,000. A rise of three quarters in three years is large, and the price per foot is up 20.97% over the same time. The two do not match, which means that the homes listed now are much larger or more elaborate than those of three years ago.
The median sold price of $5,409,312 is $2,338,188 below the listing median. The sold median is 69.8% of the listing median. The page gives no year-on-year change for the sold median, which suggests that too few sales were recorded to compare. With a stock of 28 and a wait of nearly four months, sales are few, and one or two of them set the median.
The sale-to-list ratio of 94% and the discount of 6.21% say that an individual sale gave up about $335,900 from its asking price, on a sale of $5.4 million. That is more than most households' whole home value. The page calls the market a buyer's market, with more supply than demand, which agrees with a wait of 115 days that is up 21.26% on the year and 58.23% on three years.
The number of homes for sale is down 5.88% on the year and 13.51% on the month, to 28. A smaller stock is no help to sellers if buyers are scarce. The page's own wait shows that. For an owner of a canal house, the safe assumption is a sale in the range of four months or more, at a price several percent below the ask.
Source: Realtor.com page as cited. The $7,231,000, $4,445,000, $2,338,188, 69.8% and $335,900 figures are this brief's arithmetic from the stated figures. The remarks on scarce sales are this brief's reasoning and not statements of the page. Commercial content; not independently verified.
What do the neighbors say?
The Isles page lists the surrounding neighborhoods, and the table shows how steep the price ladder is. Coral Isles has a median listing price of $9,174,500, $1,486 per foot. Stilwell Isles has $8,737,499, $1,311. Rio Vista is $3,073,750, Hendricks and Venice Isles $2,300,000, Colee Hammock $869,950 and Riviera Isles $642,450. The top is 14.3 times the bottom.
The stock follows the price in the opposite direction. Hendricks and Venice Isles has 58 homes for sale, up 45%, Rio Vista 40, down 27.08%, Riviera Isles 37, up 41.94%, and Colee Hammock 18. Coral Isles and Riviera have 8 each, Idlewyld and Stilwell Isles 7, Nurmi Isles 5 and Del Lago Isle 3. Those ten areas add up to 191 homes, 6.8 times the 28 in Las Olas Isles itself.
The waits are shorter in the cheaper areas. Riviera Isles shows 91 days, Rio Vista 93 and Colee Hammock 96, against 115 for the Isles. A home in the middle of the ladder sells about three weeks faster than one at the top, and it has more rivals. At the top, there are few rivals and few buyers.
For an owner, the table is a way to see where a home sits. A house in Rio Vista or Hendricks and Venice Isles is in a market of dozens of homes and a typical wait of three months. A house in Coral Isles or Stilwell Isles is in a market of a handful, where a buyer is rare and the price depends on the individual home.
| Area | Median listing price | Price per sq ft | Homes for sale |
|---|---|---|---|
| Coral Isles | $9,174,500 | $1,486 | 8 |
| Stilwell Isles | $8,737,499 | $1,311 | 7 |
| Rio Vista | $3,073,750 | $938 | 40 |
| Hendricks and Venice Isles | $2,300,000 | $786 | 58 |
| Colee Hammock | $869,950 | $514 | 18 |
| Riviera Isles | $642,450 | $417 | 37 |
Source: Realtor.com page as cited. The 14.3 and 6.8 figures and the 191 total are this brief's arithmetic. The reading of the ladder is this brief's reasoning. Commercial content; not independently verified.
What does the Census say about a place of renters and new buildings?
In the postal area that includes Las Olas, renters hold 7,163 of the 11,403 occupied homes, 62.8%, and owners 4,240, 37.2%. The 3,178 vacant homes are 21.8% of the 14,581, a high share, and some of them are likely to be seasonal. The population is 19,503. The median household income is $124,812 and the owner-estimated median home value is $884,800, with a margin of error of $138,545.
The stock is new. The Census counts 4,009 homes from the 2000s (27.5%), 3,936 from the 2010s (27.0%) and 1,595 from 2020 or later (10.9%). Homes built since 2000 number 9,540, which is 65.4%. Only 4,347, 29.8%, were built before 1980, and the median year built is 2006. This is a place of recent towers and mid-rise buildings, which fits the district report's condominium prices.
The district's median asking price of $750,000 is 15.2% below the Census value, and 6.0 times the median income. The Isles' sold median of $5,409,312 is 43.3 times the income and 6.1 times the Census value. The Isles are not part of the ordinary housing market of the postal area. They are a separate market that shares its name and a part of its map.
The Census median gross rent is $2,568, and the district report's average rent is $4,215, 64.1% higher. The Isles median rent of $40,000 is 15.6 times the Census rent. A rent of that size, up 60% on the year from about $25,000, is a rent for a house that costs several million dollars to buy, and it rests on 16 listings.
Source: U.S. Census Bureau, American Community Survey 2020-2024, Realtor.com and a local report as cited. Ratios, shares and gaps are this brief's arithmetic. The remark on towers and seasonal homes is this brief's reasoning and not a statement of the Census.
How should an owner use a gap this wide?
A gap of ten times between two medians is unusual, and it tells an owner something before any offer arrives. It says that the name of a place is a poor guide to what a home is worth. A buyer who searches for Las Olas will see listings from a few hundred thousand dollars to several million, and a seller who points to the wrong one will set a price that either leaves money behind or sits unsold for months.
Start with the property, not the name. How many square feet does the home have, and what is the lot or the unit? What is the view, and is the water deep enough for a boat? A house of 5,900 square feet on a canal is compared with other canal houses, which on the Isles page sell at $1,306 per foot. A unit of 1,350 square feet is compared with units, which in the district report ask $556 per foot. Using one price per foot for both would be off by a factor of 2.3.
There is also the matter of who the likely buyer is. At the top of the Isles, a buyer is often paying in cash and is not rushed, which is consistent with a wait of nearly four months and a stock that barely moves. In the district, buyers range from investors to second-home owners, and the 62.8% share of renters in the Census area shows how much of the stock is held for rent. A seller should ask which of these buyers would want the home, because the answer shapes the price, the date and the terms.
Then look at time. The Isles page shows 115 days at the median, and the district report shows 165 on average. Both are well above the 85 days of the region in July. A seller can turn that into a cost. If the taxes, insurance, utilities and upkeep of a house come to a few thousand dollars a month, a wait of four months adds up to a sum that belongs in the comparison with any offer that closes sooner. This brief does not state that cost, because it differs for every home.
Then look at the spread between ask and sale. The Isles page shows homes selling 6.21% below the asking price. On a listing at the Isles median of $7,747,500 that is $481,100. A seller who expects the full asking price is working from a number that the page does not support, and one who prices for the likely sale starts closer to the truth.
Last, ask for a second view. A direct offer from a buyer who does not need a listing, showings or a loan can be compared with the public route on the same terms: price, date, costs and the amount of effort and exposure. The comparison does not need to be close. If the public route promises more after every cost, take it. If a private sale promises enough, with privacy and a date the seller picks, then it is a reasonable choice.
Source: Realtor.com page and the Miami series as cited. The 2.3 factor and the $481,100 figure are this brief's arithmetic. The advice is this brief's general reasoning and does not value any home.
What does the Miami series add, and what should an owner ask?
The median days on market in the Miami-Fort Lauderdale-West Palm Beach area was 74 in March 2026, 77 in April, 79 in May, 82 in June and 85 in July, a rise of 11 days or 14.9%. Las Olas Isles' 115 days is 30 days, or 35.3%, longer than the July regional figure, and the district report's 165 days is 1.9 times it. Active listings fell from 43,929 in May to 41,277 in September (Realtor.com, active listings), a drop of 6.0%.
New listings fell from 10,664 in April to 8,974 in July (Realtor.com, new listings), a drop of 15.8%. Homes with a price cut fell from 10,942 in March to 8,810 in July (Realtor.com, price reduced listings), which is 21.2% of the 41,524 active homes in July. The regional median listing price was $499,000 in May and $490,000 in September (Realtor.com, median listing price), and the Isles median is 15.8 times that figure.
Whether an offer is public or private, an owner can test it with plain questions. What is the price, and is any part of it conditional on an inspection, a loan or the sale of another home? What will I take home after every charge? When will the sale close, and can that date move? Who pays for repairs the buyer asks for?
For a canal house or a condominium there are more. What do the seawall, dock and bridge clearances look like, and what does a surveyor say? What are the flood, wind and building insurance costs a buyer will face? For a condominium, what are the dues, reserves and any special assessment? At a wait of four to five months, how much does an owner pay in taxes, insurance and upkeep before a sale? Readers comparing markets can also read the Moorings brief and the Victoria Park brief.
Source: Realtor.com series published by the Federal Reserve Bank of St. Louis as cited. The 11 day, 14.9%, 30 day, 35.3%, 1.9, 6.0%, 15.8%, 21.2% and 15.8 figures are this brief's arithmetic. The questions are this brief's general reasoning and not statements of any source.
What does a private sale change?
Maison Off-Market buys homes directly from their owners. It does not list a home, hold showings or put a home on a public listing. For a Las Olas owner, the five benefits are plain. There are no showings and no neighbors talking about the sale. The closing date can be flexible, which gives time to find a new home. There are no commission costs and no closing costs for the seller, and there are no inspections and repairs.
A little arithmetic shows what that is worth. Each 1% of a $5,409,312 sale is $54,093. A seller who gives up 3% gives up $162,279, and one who gives up 5% gives up $270,466. For a $750,000 condominium, each 1% is $7,500, and 3% is $22,500. This brief does not claim that those are the costs of any sale, since the real figures depend on the agreement the seller signs. It shows how quickly a percentage becomes a sum.
At this price level, privacy has a value of its own. A public sale of a waterfront house brings tours, photographs and a record of the price, and many owners would rather avoid all three. The trade is that a private buyer may offer a price that differs from what a public sale could bring. The useful comparison is the price after every cost and every week of waiting, set against a closing date the seller picks.
Maison Off-Market speaks only to sellers. An owner who wants to know what a direct offer would look like can use the contact form below, or call 401-219-4207, and ask for a figure with no showings, no listing and no obligation.
Source: Maison Off-Market. The fee figures are this brief's arithmetic and not claims about any sale.
Methodology and limitations
Prices, price per square foot, days on market, listing and rental counts and the neighborhood tables for Las Olas Isles come from a national listing site page with charts to July 2026. Figures for the Las Olas district come from a local brokerage market report dated September 2026. They count different properties and are not independently verified.
Age, tenure, vacancy, income, rent and owner-estimated value come from the American Community Survey 2020-2024 five-year estimates for the postal-code area that includes Las Olas. Shares are calculated from published counts, and owner-estimated value carries a margin of error.
Days on market, active and new listings, median listing price and price reduced counts are Realtor.com series published by the Federal Reserve Bank of St. Louis for the Miami-Fort Lauderdale-West Palm Beach metropolitan area. They describe the region and not the neighborhood. The brief makes no forecast and values no home.
Conclusion
The Las Olas record shows two markets under one name: canal houses with a median listing price of $7.7 million and a wait of 115 days, and a district of condominiums with a median asking price of $750,000 and a wait of 165. A Census area with mostly renters and recent buildings sits behind both.
It does not fix a price for any one home. The choice between a public listing and a private sale comes down to whether an owner would rather compete in that market or take privacy, a flexible closing date, no commission, no closing costs and no inspections or repairs. To see what a direct offer would look like for your home, use the contact form below or call 401-219-4207.
Frequently Asked Questions
What is the median home price in Las Olas?
Realtor.com reports a median listing price of $7,747,500 for Las Olas Isles in August 2026. A local report for the Las Olas district gives a median asking price of $750,000 for the third quarter.
How long do Las Olas homes take to sell?
Realtor.com reports a median of 115 days for Las Olas Isles, and the district report gives an average of 165 days.
Is Las Olas a buyer's or a seller's market?
Realtor.com calls August 2026 a buyer's market for Las Olas Isles, with a sale-to-list ratio of 94%.
Why do the figures differ so much?
The Isles are large waterfront houses and the district is mostly condominiums, so the two pages count different kinds of property.
Does a private sale always beat a public listing?
No. A public listing can attract competing bids. A private sale offers privacy, a flexible closing date, no commission, no closing costs and no inspections or repairs.
Compare your options before committing. Request a written private offer for your property, with no obligation, then weigh it against your listing plan.
Sources
- Realtor.com, 2026. Las Olas Isles in Fort Lauderdale, FL Housing and Rental Market. https://www.realtor.com/local/market/florida/fort-lauderdale/las-olas-isles.
- MiamiResidence, 2026. Las Olas Real Estate Market Statistics and Trends. https://www.miamiresidence.com/market-trends/las-olas.htm.
- U.S. Census Bureau, 2026. American Community Survey 2020-2024 five-year estimates, the Las Olas area (via Census Reporter). https://censusreporter.org/profiles/86000US33301-33301/.
- Realtor.com, 2026. Housing Inventory: Median Days on Market in Miami-Fort Lauderdale-West Palm Beach, FL (CBSA). https://fred.stlouisfed.org/series/MEDDAYONMAR33100.
- Realtor.com, 2026. Housing Inventory: Active Listing Count in Miami-Fort Lauderdale-West Palm Beach, FL (CBSA). https://fred.stlouisfed.org/series/ACTLISCOU33100.
- Realtor.com, 2026. Housing Inventory: New Listing Count in Miami-Fort Lauderdale-West Palm Beach, FL (CBSA). https://fred.stlouisfed.org/series/NEWLISCOU33100.
- Realtor.com, 2026. Housing Inventory: Price Reduced Count in Miami-Fort Lauderdale-West Palm Beach, FL (CBSA). https://fred.stlouisfed.org/series/PRIREDCOU33100.
- Realtor.com, 2026. Housing Inventory: Median Listing Price in Miami-Fort Lauderdale-West Palm Beach, FL (CBSA). https://fred.stlouisfed.org/series/MEDLISPRI33100.
Related research

Seller Guide · October 6, 2026
How to Prepare Point Pleasant Beach Rental Records Before Selling
Separate rental approval, income history and booked stays before comparing sale terms.

Seller Guide · October 6, 2026
How to Prepare Rumson Flood and Waterfront Records Before Selling
Separate flood disclosure, elevation, repairs and waterfront rights before comparing sale terms.

Seller Guide · October 6, 2026
How to Prepare Sarasota Condo Inspection and Reserve Records Before Selling
Separate building condition, reserve funding and resale documents before comparing sale terms.