Market Brief · by Aidan Sowa · October 5, 2026
Did Moorings Prices Really Fall So Far? Reading a Falling Sold Median and a Rising Listing Median
Reading a Falling Sold Median and a Rising Listing Median for Moorings, FL, with each source dated and its limits noted, for owners weighing a listing against a direct sale.
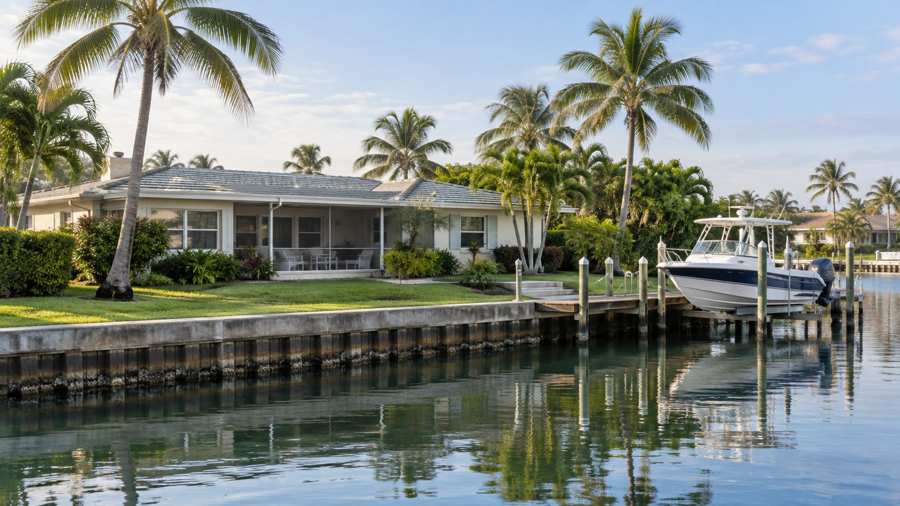
What do homes in the Moorings sell for? Realtor.com's page for the neighborhood says that the median sold price in September 2026 was $727,500, down 48.04% on the year. Redfin says $787,000 for the three months to August, down 47.5%. Both describe a fall of nearly half, which is a startling figure. Yet the same Realtor.com page says that the median listing price is $1,295,000, up 8.70%. Sellers are asking nearly twice what buyers are paying, and the gap is $567,500.
A fall of 48% in a typical sale price is not what happens to the value of the same homes in a year. The year-ago sold median implies about $1,400,000, and the listing median a year ago about $1,191,000, so a year ago the typical sale was above the typical asking price. This year the order has reversed. The likeliest explanation is that the homes which sold this year are of a different kind, with a larger share of condominiums and smaller units, and fewer large waterfront houses, though the pages do not say so.
This brief reads the Realtor.com page and the Redfin page side by side, adds the Census profile of the postal area and the Naples area series, and asks what the numbers mean for an owner who is choosing between a public listing and a private sale.
Key Findings
- Realtor.com reported, as of September 2026, a median listing price of $1,295,000 for the Moorings (up 13.86% on the month and up 8.70% on the year), a median sold price of $727,500 (up 1.75% and down 48.04%), $836 per square foot (up 13.74% and down 1.62%), 127 homes for sale (down 18.99% and down 26.01%) and a median of 149 days on market (up 2.69% and up 1.33%).
- The same page gave a sale-to-list ratio of 94%, with homes selling 5.81% below the asking price, and called September 2026 a buyer's market and a cool one. It counted 103 rentals (down 19.58% on the year) at a median rent of $10,000 a month (down 9.09%).
- Redfin reported, for the three months to August 2026, a median sale price of $787,000 (down 47.5% on the year), $550 per square foot (down 31.3%), 159 days on market against 113 a year earlier and 50 homes sold in August against 40. It called the market not very competitive.
- In the Census postal area that includes the Moorings, 5,473 of 10,385 housing units are occupied, 4,912 (47.3%) are vacant, owners hold 4,703 of the occupied homes (85.9%), the median household income is $116,875 and the owner-estimated median home value is $950,900 (Census Reporter, American Community Survey profile).
- In the Naples-Marco Island area the median days on market was 87 in April 2026 and 106 in August (Realtor.com, days on market).
Can a sold median really fall 48 percent in a year?
For the same homes, no. For the homes that happen to sell, yes. The Moorings has waterfront houses and condominium buildings, and the two sell at very different prices. If last year's sales included a number of houses at $2 million or more, and this year's were mostly condominiums at $500,000 to $800,000, the median would fall by half even if no home lost any value.
The other figures point the same way. The sold median is $727,500, but the median price per square foot on Realtor.com is $836 for listings and only down 1.62% on the year. If the value per foot had fallen by half, the listing figure would show it. Redfin's price per foot is $550, down 31.3%, a much larger fall, but still smaller than the fall in the price. A fall in price that is larger than the fall per foot means smaller homes sold.
The gap between the listing and sold medians is wide. The sold median is 56.2% of the listing median. The sale-to-list ratio of 94% and the discount of 5.81% say that individual sales gave up about $42,300 on a $727,500 sale. Those are the signs of a market where homes sell below the asking price by a modest amount. The medians are far apart because they describe different homes.
The listing median moved the other way in the last month. It rose 13.86%, from about $1,137,000 to $1,295,000, and the price per foot rose 13.74%. A rise of that size in a month is again a mix effect. Cheaper listings sold or came off the market, 30 of them if the count fell by 18.99%, and the expensive ones stayed, which lifts the median.
Redfin and Realtor.com agree on the direction and differ on the size. Redfin's median of $787,000 is $59,500, or 8.2%, above Realtor.com's $727,500, and Redfin's year-ago figure works out near $1,499,000 against about $1,400,000. The two sources cover different windows, three months against a month, and they may count different home types. What they share is the conclusion that a typical sale is now about half of what it was.
The right reading for an owner is that neither median is the price of their home. The Moorings is a set of different products with a shared name. A seller needs sales of a similar building, a similar view and a similar size, and the neighborhood medians cannot supply those.
| Indicator | Level | Change on the month | Change on the year |
|---|---|---|---|
| Median listing price | $1,295,000 | +13.86% | +8.70% |
| Median sold price | $727,500 | +1.75% | -48.04% |
| Price per square foot | $836 | +13.74% | -1.62% |
| Homes for sale | 127 | -18.99% | -26.01% |
| Days on market | 149 | +2.69% | +1.33% |
Source: Realtor.com and Redfin pages as cited. The $567,500, $1,400,000, $1,191,000, 56.2%, $42,300, $1,137,000 and 30 homes figures are this brief's arithmetic from the stated changes. The explanation based on the mix of sales is this brief's reasoning and not a statement of any page. Commercial content; not independently verified.
Is the wait 149 days, 154 or 159?
Realtor.com gives a median of 149 days for homes that are for sale, up 1.33% on the year, which implies about 147 days in 2025. Redfin gives 159 days for the three months to August, against 113 a year earlier, and its competitiveness score says homes sell in 154 days. The three figures sit within ten days of each other, which is unusually close for two companies with different methods.
They agree because the market is slow on either count. A wait of five months is long. The Naples-Marco Island median in August was 106 days, so the Moorings at 149 is 43 days, or 40.6%, longer. Redfin's jump from 113 to 159 days is a rise of 46 days, or 40.7%, in a year, and the number of homes sold went up, from 40 to 50 in the month, a gain of 25%.
That combination, more sales and a longer wait, is a sign that sellers are accepting lower prices and buyers are buying them. It fits the fall in the sold median. Homes that were priced realistically found buyers, and the wait lengthened for those that were not. A seller who prices at last year's levels is in the group that waits.
There is a second reading of the longer wait. If the homes that sold this year were cheaper units that sold quickly, the homes still waiting would be the larger and costlier ones, and the wait for them would be longer than the median shows. A seller of a waterfront house has reason to think that the 149 days understate the time that a house of that kind needs, though the pages give no figure for houses alone.
The cost of the wait is real. A condominium or house in the Moorings carries association dues, insurance, taxes and upkeep for five months before it sells. At a $727,500 price and a sale-to-list ratio of 94%, the seller who waits and then accepts a discount has paid twice.
Source: Realtor.com and Redfin pages as cited, and Realtor.com series for the Naples area. The 147 day, 43 day, 40.6%, 46 day, 40.7% and 25% figures are this brief's arithmetic. The explanation of the combination is this brief's reasoning. Commercial content; not independently verified.
What does a table that names 20 of 127 homes tell an owner?
The Realtor.com page lists fifteen communities inside the Moorings. Admiralty Point West has 6 homes for sale, Harbour Cove Club 4, down 40%, and Commodore Club 3, up 33.33%. Bordeaux Club, Coquina Club, Lausanne Condominiums, Leeward Cove Club, The Suzanne, Westgate Condominiums and Windsor Court have one each. Beacon House, Indies West Condominiums, The Billows Condominiums, The Cloisters Condominiums and The Orleans have none.
Those rows add up to 20 homes. The page gives 127 for the neighborhood. The named communities hold 15.7% of the stock, and 107 homes, 84.3%, are not in any of them. Every community in the table is a condominium or a club building. The 107 are likely to include houses on streets and canals, and condominium buildings that the table does not list, but the page does not say.
The year-on-year changes in the table are mostly falls. Bordeaux Club is down 75%, Coquina Club down 83.33%, Lausanne Condominiums down 75% and Westgate Condominiums down 75%. Each of those is a change from four homes to one, or from six to one, and so a swing of three or five homes. In small counts a percentage tells an owner very little.
The rentals tell a related story. The table counts rentals in several of the same buildings: Lausanne Condominiums has 5, Commodore Club 3, Coquina Club 3 and Indies West Condominiums 3, though the last has no homes for sale. A building with more rentals than sales is a building where owners are holding on and letting the unit, and a seller in such a building competes with the owner who would rather rent than sell.
The practical lesson is that the neighborhood is too varied for a single set of figures. An owner of a unit in a named building has a small group of directly comparable sales, usually a few a year. An owner of a house on a canal has a different group, with a different buyer. In both cases, the price is set by the nearest similar sale, not by the page's median.
| Community | Homes for sale | Change on the year | Rentals |
|---|---|---|---|
| Admiralty Point West | 6 | 0% | 2 |
| Harbour Cove Club | 4 | -40% | 2 |
| Commodore Club | 3 | +33.33% | 3 |
| Coquina Club | 1 | -83.33% | 3 |
| Lausanne Condominiums | 1 | -75% | 5 |
| All named communities, 20 homes in all | 1 to 6 each | varies | varies |
Source: Realtor.com page as cited. The 20, 15.7%, 107 and 84.3% figures are this brief's arithmetic. The remarks on what the 107 contain are this brief's inference and not statements of the page. Commercial content; not independently verified.
What does the Census say about the postal area around the Moorings?
In the postal area that includes the Moorings, the median household income is $116,875 and the owner-estimated median home value is $950,900, with a margin of error of $106,413. The Realtor.com sold median of $727,500 is 23.5% below the Census value, and the listing median of $1,295,000 is 36.2% above it. The Census value sits between the two medians. The sold median is 6.2 times the income.
The area has 10,385 homes, of which 5,473 are occupied and 4,912, 47.3%, are vacant. The Census counts seasonal homes as vacant, and in a resort area the share is high. Against 4,912 vacant homes, 127 homes for sale in the Moorings is a small figure, equal to 2.6% of the empty homes in the postal area. The market therefore depends on how many seasonal owners decide to sell, and in a given year that is a small share of all of them.
Owners hold 4,703 of the occupied homes, 85.9%, and renters 770, 14.1%. The population is 11,299. The housing stock is mostly from the 1970s (3,612 homes, 34.8%) and 1980s (2,725, 26.2%). Together those decades hold 6,337 homes, 61.0%, and the median year built is 1981. Buildings of that age are now 40 to 55 years old, and an owner in a condominium of that age should expect questions about the reserve fund, the roof and the concrete.
The vacant share has a second effect on price. In a building where many units are empty most of the year, a buyer will look at the dues, which are charged whether a unit is used or not, and at the number of owners who might sell at once. A buyer's caution on both counts shows up as a bigger discount, which fits the 5.81% below asking that the page reports.
The Census median gross rent is $2,058. The Realtor.com median asking rent in the Moorings is $10,000, 4.9 times as much, and down 9.09% on the year, which implies about $11,000 a year earlier. The page counts 103 rentals, 24 fewer than the 127 homes for sale.
Source: U.S. Census Bureau, American Community Survey 2020-2024, and Realtor.com as cited. Ratios, shares and gaps are this brief's arithmetic. The remarks on seasonal homes and building age are this brief's reasoning and not statements of the Census.
What does the Naples series add, and what should an owner ask?
Active listings in the Naples-Marco Island area fell from 6,869 in April 2026 to 4,676 in August (Realtor.com, active listings), and new listings from 1,196 to 808 (Realtor.com, new listings). The regional median listing price slipped from $699,999 to $685,000 (Realtor.com, median listing price). The Moorings listing median is 1.9 times that figure.
The thinning matters for a seller in two ways. A smaller stock means fewer rivals, which is good. It also means that the buyers who are active are choosy, since they have watched the same homes for months, and that those homes are priced with a cut in mind. The regional wait has risen by 19 days since April, from 87 to 106, so a smaller stock has not made homes sell faster.
Homes with a price cut fell from 1,388 in May to 796 in August and were 810 in September (Realtor.com, price reduced listings). In August, that is 17.0% of the 4,676 active homes. The region is thinning, and the Moorings, with 26.01% fewer homes than a year ago, is thinning faster.
A last point on the regional comparison is the price. The Naples area median listing price of $685,000 is close to the Moorings sold median of $727,500, which is 6.2% above it. So the typical sale in the Moorings this year is priced like the typical listing in the whole area, and the neighborhood's high asking prices are not matched by its sales.
Whether an offer is public or private, an owner can test it with plain questions. What is the price, and is any part of it conditional on an inspection, a loan or the sale of another home? What will I take home after every charge? When will the sale close, and can that date move? Who pays for repairs the buyer asks for?
For a waterfront home or a condominium there are more. Are there special assessments planned or pending? What do the reserves hold, and what does the building's insurance cover? What do the dock, seawall and canal permits say, and who maintains them? What are the flood and wind insurance costs a buyer will face? At a wait of five months, how much does an owner pay in dues, taxes and insurance? Readers comparing markets can also read the Park Shore brief and the Las Olas brief.
Source: Realtor.com series published by the Federal Reserve Bank of St. Louis as cited. The 1.9 and 17.0% figures are this brief's arithmetic. The questions are this brief's general reasoning and not statements of any source.
What does a private sale change?
Maison Off-Market buys homes directly from their owners. It does not list a home, hold showings or put a home on a public listing. For a Moorings owner, the five benefits are plain. There are no showings and no neighbors talking about the sale. The closing date can be flexible, which gives time to find a new home. There are no commission costs and no closing costs for the seller, and there are no inspections and repairs.
A little arithmetic shows what that is worth. Each 1% of a $727,500 sale is $7,275. A seller who gives up 3% gives up $21,825, and one who gives up 5% gives up $36,375. This brief does not claim that those are the costs of any sale, since the real figures depend on the agreement the seller signs. It shows how quickly a percentage becomes a sum.
The trade is that a private buyer may offer a price that differs from what a public sale could bring. In a market with a wait of about five months and sales at 5.8% below the asking price, a seller may find a direct offer with a fixed date and a known price worth a serious look. The useful comparison is the price after every cost and every week of waiting, set against a closing date the seller picks.
For an owner of a seasonal home, there is a further point. A public sale means keeping the home ready to show through a hot summer and a quiet autumn, with the cost of power, cooling and a visit from an agent each time. A direct sale ends that cost on the day it closes, and the closing date can be chosen to suit the owner.
Maison Off-Market speaks only to sellers. An owner who wants to know what a direct offer would look like can use the contact form below, or call 401-219-4207, and ask for a figure with no showings, no listing and no obligation.
Source: Maison Off-Market. The fee figures are this brief's arithmetic and not claims about any sale.
Methodology and limitations
Prices, price per square foot, days on market, listing and rental counts and the community table for the Moorings come from two commercial pages: a national listing site page with charts to August 2026 and a national brokerage page with figures to August 2026. They count different things and are not independently verified.
Age, tenure, vacancy, income, rent and owner-estimated value come from the American Community Survey 2020-2024 five-year estimates for the postal-code area that includes the Moorings. Shares are calculated from published counts, and owner-estimated value carries a margin of error.
Days on market, active and new listings, median listing price and price reduced counts are Realtor.com series published by the Federal Reserve Bank of St. Louis for the Naples-Marco Island metropolitan area. They describe the region and not the neighborhood. The brief makes no forecast and values no home.
Conclusion
The Moorings record shows a sold median down 48% against a listing median up 9%, a sale-to-list ratio of 94%, a wait of five months on both pages, a community table that names 20 of 127 homes and a postal area in which 47.3% of the homes are vacant.
It does not fix a price for any one home. The choice between a public listing and a private sale comes down to whether an owner would rather compete in that market or take privacy, a flexible closing date, no commission, no closing costs and no inspections or repairs. To see what a direct offer would look like for your home, use the contact form below or call 401-219-4207.
Frequently Asked Questions
What is the median home price in the Moorings?
Realtor.com reports a median sold price of $727,500 for September 2026, down 48.04%, and a median listing price of $1,295,000, up 8.70%. Redfin reports $787,000 for the three months to August.
How long do Moorings homes take to sell?
Realtor.com reports a median of 149 days for September 2026, and Redfin reports 159 days for the three months to August.
Is the Moorings a buyer's or a seller's market?
Realtor.com calls September 2026 a buyer's market, with a sale-to-list ratio of 94%. Redfin calls it not very competitive.
Why did the sold median fall by nearly half?
The pages do not say. The median depends on which homes sell, and a shift toward smaller units would lower it without any home losing value.
Does a private sale always beat a public listing?
No. A public listing can attract competing bids. A private sale offers privacy, a flexible closing date, no commission, no closing costs and no inspections or repairs.
Compare your options before committing. Request a written private offer for your property, with no obligation, then weigh it against your listing plan.
Sources
- Realtor.com, 2026. Moorings Neighborhood of Naples, FL Housing Market. https://www.realtor.com/local/market/florida/naples/moorings.
- Redfin, 2026. Moorings, Naples Housing Market. https://www.redfin.com/neighborhood/216278/FL/Naples/Moorings/housing-market.
- U.S. Census Bureau, 2026. American Community Survey 2020-2024 five-year estimates, the Moorings area (via Census Reporter). https://censusreporter.org/profiles/86000US34103-34103/.
- Realtor.com, 2026. Housing Inventory: Median Days on Market in Naples-Immokalee-Marco Island, FL (CBSA). https://fred.stlouisfed.org/series/MEDDAYONMAR34940.
- Realtor.com, 2026. Housing Inventory: Active Listing Count in Naples-Immokalee-Marco Island, FL (CBSA). https://fred.stlouisfed.org/series/ACTLISCOU34940.
- Realtor.com, 2026. Housing Inventory: New Listing Count in Naples-Immokalee-Marco Island, FL (CBSA). https://fred.stlouisfed.org/series/NEWLISCOU34940.
- Realtor.com, 2026. Housing Inventory: Median Listing Price in Naples-Immokalee-Marco Island, FL (CBSA). https://fred.stlouisfed.org/series/MEDLISPRI34940.
- Realtor.com, 2026. Housing Inventory: Price Reduced Count in Naples-Immokalee-Marco Island, FL (CBSA). https://fred.stlouisfed.org/series/PRIREDCOU34940.
Related research

Seller Guide · October 6, 2026
How to Prepare Point Pleasant Beach Rental Records Before Selling
Separate rental approval, income history and booked stays before comparing sale terms.

Seller Guide · October 6, 2026
How to Prepare Rumson Flood and Waterfront Records Before Selling
Separate flood disclosure, elevation, repairs and waterfront rights before comparing sale terms.

Seller Guide · October 6, 2026
How to Prepare Sarasota Condo Inspection and Reserve Records Before Selling
Separate building condition, reserve funding and resale documents before comparing sale terms.