Market Brief · by Aidan Sowa · October 5, 2026
Which Brookhaven Clock and Which Median Is Yours? Reading the Clocks and the Medians
Reading the Clocks and the Medians for Brookhaven, GA, with each source dated and its limits noted, for owners weighing a listing against a direct sale.
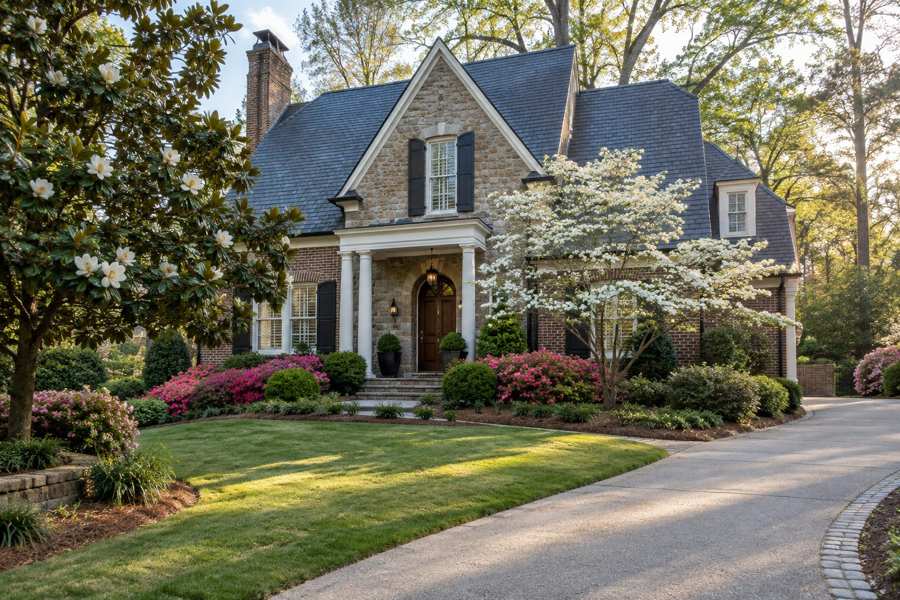
Two sources describe the Brookhaven market for the same summer and give it two different clocks. Redfin's page for the city says that homes receive three offers on average and sell in about 30 days, against 45 a year earlier, at a median of $774,487, up 2.9%. A local agent's monthly update says that the average time on market is 44 days, that inventory is 242 homes or 4.1 months of supply, and that the median is $795,000, up 3.6%.
The gap between 30 and 44 days is large. It could mean that the market is speedy or that it is moderate, depending on which page is read. The agent's page adds that the list-to-sale ratio is 97.3% and that buyers at this price level have leverage to negotiate, a statement hard to square with three offers per home.
This brief reads the two pages with the Census profile of the postal area that includes Brookhaven and the Atlanta metropolitan series. Both local pages are commercial content and are labeled so. The brief prices no house.
Key Findings
- Redfin reported a Brookhaven median sale price of about $774,487 for the three months to August 2026 (up 2.9%), a price per square foot of $301 (up 10.0%), three offers on average, about 30 days on market against 45 a year earlier, and 204 homes sold in August against 209 (Redfin, Brookhaven).
- A local agent's update dated September 1, 2026 reported a median home price of $795,000 (up 3.6%), an average of 44 days on market, 242 active listings (4.1 months of supply), $287 per square foot asking, 58 homes sold and 96 new listings in 30 days, and a list-to-sale ratio of 97.3% (Tommy Williams, Brookhaven update).
- The same update says the median price has risen about 50% since 2018, from roughly $530,000, and that its figure is 66% above the Atlanta city median.
- In the Census postal area, 5,930 of 22,097 housing units (26.8%) were built before 1980, owners occupy 11,033 of 19,878 occupied homes (55.5%) and median household income is $130,648 (U.S. Census Bureau, 2020-2024).
- The Atlanta-Sandy Springs-Roswell median days on market rose from 50 in May 2026 to 60 in September (Realtor.com, days on market).
Why do two pages show 30 days and 44?
A days-on-market figure depends on three choices: the window, the average, and the start of the clock. Redfin's figure is a median over three months to August. The agent's is an average over the trailing 30 days to September 1. A median is the middle home, and an average is pulled up by the few homes that sat for months. In a market of about 200 sales a month, a handful of slow homes can move an average by many days and a median by very few.
That alone could account for the gap, and the order is the expected one: the average, 44, is higher than the median, 30. The clock may also start in different places. Some counts start when a listing is first posted and others when it was last re-listed, and homes that are withdrawn and listed again can look new. The pages do not say which they use.
The year-over-year comparisons point in different directions as well. Redfin says the wait was 15 days shorter than a year ago. The agent says the average moved 0.4% from the previous month. They measure different changes, one over a year and one over a month, and so they do not contradict each other. What they leave a seller without is a single answer to whether the market is faster or slower than last year.
For an owner, the sensible position is that a typical home in Brookhaven is selling in the range of one month to a month and a half, with the slow tail running well beyond that. A home that has not sold in six weeks is in the tail, which is where the price cuts occur.
| Measure | Redfin | Local agent update |
|---|---|---|
| Median sale price | $774,487 (up 2.9%) | $795,000 (up 3.6%) |
| Days on market | About 30 (45 a year earlier) | 44 (average) |
| Price per square foot | $301 sold (up 10.0%) | $287 asking |
| Offers per home | 3 | Not shown |
| Homes sold | 204 in August | 58 in 30 days |
| Supply | Not shown | 242 listings, 4.1 months |
Sources: Redfin and Tommy Williams pages as cited. Commercial content; not independently verified.
Is it a balanced market, or does the buyer hold the leverage?
The agent's update calls Brookhaven a balanced market, based on 4.1 months of supply, and says that the small listing pool means well-priced homes still generate strong interest. Later it says that at premium prices buyers have more leverage to negotiate, that the list-to-sale ratio of 97.3% shows buyers negotiating hard, and that sellers are willing to discuss closing costs, rate buydowns and repair credits. Elsewhere, the text cites 3.8 months of supply and a 3.8% price gain where the summary table says 4.1 and 3.6%.
These are different pieces of the same story. A balanced market is one in which neither side has a clear edge. A market in which buyers get repair credits and closing help is one where the buyer has some edge. The two can be reconciled by saying that the market is balanced overall and tilts to buyers at the top, which is what the page seems to mean. The inconsistent figures show why a seller should treat such pages as commentary and not data.
Redfin's three offers per home gives a different impression, that of a market in which sellers often have a choice. A median of three offers can come from a few homes with many offers and many with one. It would fit the agent's picture of strong interest in renovated homes near the village and slower movement elsewhere.
For a seller, the thing to take from the mixed signals is that the home's own features decide which half of the market it is in. The agent says renovated homes in the $700,000 to $900,000 range near the village sell fastest, and new construction at $900,000 to $1.2 million moves well when the finishes match. Homes that do not fit those descriptions wait.
Sources: Tommy Williams update and Redfin page as cited. Commercial content; not independently verified. The reconciliation is this brief's reasoning.
What does a 97.3 percent list-to-sale ratio cost a seller?
The agent's update gives a list-to-sale ratio of 97.3% and says that it is slightly below the north metro average, a sign that buyers have more leverage at Brookhaven's price points. A ratio of 97.3% means that homes sold for 2.7% less than their last list price, on the page's definition. On a $795,000 home, 2.7% is about $21,500. It is a small number beside the figures on other pages in this series, and it is a sign of a market where pricing is close to what buyers will pay.
The ratio leaves out two things. It is measured from the last list price, so a home that was first listed higher and cut twice looks better than it was. And it counts only homes that sold. The agent's own advice, to price within 3% of recent comparable sales, is a way of saying that the ratio holds only for homes that start near the market. A home that starts 8% too high may have to cut and wait, and its eventual ratio will look fine while its wait shows the cost.
The update also tells sellers that buyers spending $800,000 or more will pass quickly on homes that do not meet their expectations of finish and presentation. This is an advice paragraph, not a measurement, and it is consistent with what any agent would say. It does put a price on preparation: staging, photography and a move-in condition are the stated price of admission, and each costs the seller money before the first showing.
A seller can set against these costs the fees of the sale itself. For every 1% of the price, a sale at $795,000 gives up $7,950, and the 2.7% concession would be about $21,500, so the two together might be a few percent of the price before repairs. They are illustrations, with no assumed commission rate. They show why an owner may compare the net of a public sale, after preparation, fees and concessions, with a private offer at a single price.
None of this makes the public route the wrong one. In a market with three offers per home on Redfin's count, a well-prepared house may sell above the median and above the ratio. The point is that the ratio is a statement about homes that did sell near the market, and a seller's own result depends on where the home starts.
Sources: Tommy Williams update and Redfin page as cited. The $21,500 figure is this brief's arithmetic (2.7% of $795,000), not a recorded sale. Commercial content; not independently verified.
What does the Census say about Brookhaven homes?
The Census profile describes the postal area that includes Brookhaven. It counts 45,985 people and 22,097 housing units, of which 19,878 are occupied and 2,219 (10.0%) are not. Owners live in 11,033 homes (55.5%) and renters in 8,845 (44.5%). Median household income is $130,648 and median gross rent is $1,932 a month.
The stock is younger than the neighborhood's reputation suggests. The largest group, 5,209 homes (23.6%), was built in the 2000s, followed by 4,198 from the 2010s (19.0%) and 3,498 from the 1990s (15.8%). Only 5,930 homes (26.8%) predate 1980, and 511 (2.3%) predate 1940. Much of the new housing is condominiums and townhomes near the transit stations and along the main roads, which is why 44.5% of the occupied homes are rented.
Owners estimate the median home at $762,500, with a margin of error of $31,586, or 4.1%. That is close to the sold medians of $774,487 and $795,000, which is unusual in this series. It says that the postal area is fairly uniform in price, and that the medians are a reasonable guide for a typical owner here.
For a seller, the age profile has a plain meaning. A large share of the market is newer than 1990, and buyers who can choose among them hold older houses to a higher standard of finish. A house from the 1950s or 1960s that has not been updated competes with newer homes on price per foot and loses on condition.
| Indicator | Value | Note |
|---|---|---|
| Population | 45,985 | Whole postal area |
| Housing units | 22,097 | All units |
| Owner-occupied homes | 11,033 | 55.5% of occupied |
| Renter-occupied homes | 8,845 | 44.5% of occupied |
| No usual resident | 2,219 | 10.0% of all units |
| Built before 1980 | 5,930 | 26.8% of units |
| Median household income | $130,648 | Estimate |
| Median gross rent | $1,932 | Monthly |
| Owner-estimated median value | $762,500 | Margin of error $31,586 |
Source: U.S. Census Bureau, American Community Survey 2020-2024 five-year estimates.
Which kind of Brookhaven home sells fastest?
The agent's update ranks areas within Brookhaven by speed: the village area is very fast, with the tightest inventory in the city, and two established neighborhoods are fast, one at a sweet spot of $700,000 to $900,000 for renovated bungalows and ranches. A park and lake area moves at a moderate pace. A corridor on the edge is described as an emerging area with a lower entry price. These are the agent's judgments and are not measured, though they follow a common pattern: walkable, renovated and well-located homes sell first.
The update also says that renovated homes at $700,000 to $900,000 near the village and new construction at $900,000 to $1.2 million are the strongest performers, and that condominiums and townhomes near transit stations are priced lower. The Census supports the broad picture, with a housing stock that is mostly built since 1990 and a large rental share near transit.
What does this say for an owner of a home that is not in those categories? A 1960s ranch that has not been updated sits outside the sweet spot, and a buyer will price in the work. A home on a larger lot in an established neighborhood can sell at a premium for the land. A condominium near transit competes on price and fees.
The most useful step for an owner is to decide which category the home belongs to, and to be honest about the finish. A home that sells fast is one that matches what the buyer is looking for, and a home that does not match waits. An as-is buyer takes the condition out of the comparison, and is a different kind of buyer from the one who pays for a renovated house.
The sources used here do not give prices by neighborhood or by condition, and the brief does not claim any. It reports the agent's ranking as the agent's view.
Source: Tommy Williams update as cited; U.S. Census Bureau, table B25034. The area rankings are the agent's judgments and not measured figures. Commercial content; not independently verified.
What does the Atlanta clock say?
Realtor.com's series for the Atlanta-Sandy Springs-Roswell area, published by the Federal Reserve Bank of St. Louis, show a slowing market. The median days on market was 50 in May 2026, 52 in June, 56 in July, 59 in August and 60 in September. Active listings rose from 27,670 in May to 29,735 in September (Realtor.com, active listings).
New listings fell from 10,732 in April to 8,982 in July (Realtor.com, new listings). The median listing price slipped from $425,000 in May to $415,000 in September (Realtor.com, median listing price), and the count of reduced listings climbed from 9,140 in April to 11,608 in August (Realtor.com, price reduced listings).
Brookhaven's 30 to 44 days sits below the metropolitan 60, and the median price is almost double. The direction, though, is the same: more homes on the market and a longer wait than in spring.
None of these series describe Brookhaven. They show the setting in which a Brookhaven seller lists.
Source: Realtor.com via FRED, Housing Inventory series for Atlanta-Sandy Springs-Roswell, GA (CBSA).
What does a 50 percent rise since 2018 leave out?
The update says that the median price has risen about 50% since 2018, from roughly $530,000 to $795,000, and calls the appreciation measured and sustainable. The arithmetic is right: 795,000 divided by 530,000 is 1.5. Over about eight years, that works out to roughly 5.2% a year, a figure that is this brief's arithmetic from the two stated prices.
What it leaves out is the mix. The housing stock in the area has changed, with 4,198 homes built in the 2010s and 357 since 2020, and newer homes sell at higher prices. A median that rises because the stock includes more new homes is not the same as a home that rises in value. A seller of a house from the 1960s should not apply the 50% to its own value without checking.
It also leaves out the recent direction. The update says the gain over the last year is 3.6%, or 3.8% in another paragraph, which is slower than the eight-year pace. Redfin's figure is 2.9%. A slowing rate of gain, alongside a longer wait in the metropolitan area, suggests that the strongest part of the climb is behind.
A seller can use the history for what it is: evidence that the neighborhood has held its value over a long period, which supports the long-term case for owning. It does not say what a particular house will sell for this month, and a seller who is deciding between a public listing and a private sale should look at recent comparable sales.
It is also worth remembering that the agent's areas are not the same as the Census's. The postal area is larger than the village and the neighborhoods the update names, and it includes the condominiums and townhomes along the main roads. A seller should confirm which streets a figure describes before using it, since a median for the village and a median for the postal area can differ by a wide margin. Readers comparing markets can also read the Greensboro brief and the Alpharetta brief.
Source: Tommy Williams update as cited; U.S. Census Bureau, table B25034. The annual rate and mix argument are this brief's arithmetic and reasoning, not measured figures.
What would a private sale change for a Brookhaven owner?
A direct sale to a buyer who purchases homes off the market changes five things for a seller. There are no showings and no neighbors talking about you selling, which counts in a village where people know each other. The closing date can be flexible, giving time to find a new home. There are no commission costs and no closing costs for the seller. And there are no inspections or repairs, which the agent's own update lists among the things buyers expect to negotiate.
The fee benefit requires no assumed rate. For every 1% of a sale price that would otherwise go to fees, a sale at $774,487 keeps $7,745 and a sale at $795,000 keeps $7,950. An owner can apply whatever percentage is in a listing agreement and compare net proceeds.
A flexible closing date is useful in a market where buyers are said to ask for closing help and repair credits. In a private sale those terms are fixed at the start, not negotiated after an inspection.
The trade-off is the usual one. A public listing of a renovated home near the village can draw competing offers, and Redfin reports three per home. A private sale offers privacy, a settled date and no repairs. The owner decides.
There is one more reason to be careful with a long run of rising prices: the buyers who set them are not the buyers of today. A house bought in 2018 at $530,000 and a house bought in 2026 at $795,000 were financed at different rates, and the update itself works out a payment of about $4,210 a month on a $795,000 home with 20% down at 6.95%. The monthly cost is what many buyers actually budget for, and it has risen faster than the price. That is part of why the update says that the pool of qualified buyers at this level is narrower, and why a seller may find that the buyer who is ready to close is worth more than the buyer who may appear next month.
Source: calculation from stated prices; no commission rate, closing cost or repair cost is assumed.
Methodology and limitations
Prices, price per square foot, offers, days on market, sales and listing counts for Brookhaven come from two commercial pages, a national brokerage site and a local agent's monthly update. They were not independently verified and they differ in window and definition, and the brief reports them side by side for that reason.
Age, tenure, vacancy, income, rent and owner-estimated value come from the American Community Survey 2020-2024 five-year estimates for the postal-code area that includes Brookhaven. Shares are calculated from published counts, and owner-estimated value carries a stated margin of error.
Days on market, active and new listings, median listing price and price reduced counts are Realtor.com series published by the Federal Reserve Bank of St. Louis for the Atlanta-Sandy Springs-Roswell metropolitan area. The brief makes no forecast and does not estimate what any particular home would sell for.
Conclusion
The Brookhaven record shows a market that is active and priced near $780,000, with a clock somewhere between 30 and 44 days and a mix of offers and negotiation, depending on the home.
It does not fix a price for any one home. The choice between a public listing and a private sale comes down to whether an owner values the chance of competing bids more than privacy, a flexible closing date, no commission, no closing costs and no inspections or repairs.
Frequently Asked Questions
What is the median home price in Brookhaven?
Redfin reports about $774,487 for three months to August 2026 and a local agent update reports $795,000.
How long do Brookhaven homes take to sell?
Redfin reports about 30 days and the local agent update reports an average of 44.
Is Brookhaven a balanced market?
The agent update calls it balanced at 4.1 months of supply, and also says buyers have leverage at higher prices.
Does the Atlanta metropolitan data describe Brookhaven?
No. It covers a large metropolitan area and shows direction only.
Does a private sale always beat a public listing?
No. A public listing can attract competing bids. A private sale offers privacy, a flexible closing date, no commission, no closing costs and no inspections or repairs.
Compare your options before committing. Request a written private offer for your property, with no obligation, then weigh it against your listing plan.
Sources
- Redfin, 2026. Brookhaven, GA Housing Market. https://www.redfin.com/city/35852/GA/Brookhaven/housing-market.
- Williams, Tommy, 2026. Brookhaven Housing Market Update: September 2026. https://tomwillsellga.com/brookhaven-housing-market-update/.
- U.S. Census Bureau, 2026. American Community Survey 2020-2024 five-year estimates, the Brookhaven area (via Census Reporter). https://censusreporter.org/profiles/86000US30319-30319/.
- Realtor.com, 2026. Housing Inventory: Median Days on Market in Atlanta-Sandy Springs-Roswell, GA (CBSA). https://fred.stlouisfed.org/series/MEDDAYONMAR12060.
- Realtor.com, 2026. Housing Inventory: Active Listing Count in Atlanta-Sandy Springs-Roswell, GA (CBSA). https://fred.stlouisfed.org/series/ACTLISCOU12060.
- Realtor.com, 2026. Housing Inventory: New Listing Count in Atlanta-Sandy Springs-Roswell, GA (CBSA). https://fred.stlouisfed.org/series/NEWLISCOU12060.
- Realtor.com, 2026. Housing Inventory: Median Listing Price in Atlanta-Sandy Springs-Roswell, GA (CBSA). https://fred.stlouisfed.org/series/MEDLISPRI12060.
- Realtor.com, 2026. Housing Inventory: Price Reduced Count in Atlanta-Sandy Springs-Roswell, GA (CBSA). https://fred.stlouisfed.org/series/PRIREDCOU12060.
Related research

Seller Guide · October 6, 2026
How to Prepare Point Pleasant Beach Rental Records Before Selling
Separate rental approval, income history and booked stays before comparing sale terms.

Seller Guide · October 6, 2026
How to Prepare Rumson Flood and Waterfront Records Before Selling
Separate flood disclosure, elevation, repairs and waterfront rights before comparing sale terms.

Seller Guide · October 6, 2026
How to Prepare Sarasota Condo Inspection and Reserve Records Before Selling
Separate building condition, reserve funding and resale documents before comparing sale terms.