Market Brief · by Aidan Sowa · October 5, 2026
Why Does One City Show a Short Wait and a Long Wait? Reading Pages With Different Clocks
Reading Pages With Different Clocks for Alpharetta, GA, with each source dated and its limits noted, for owners weighing a listing against a direct sale.
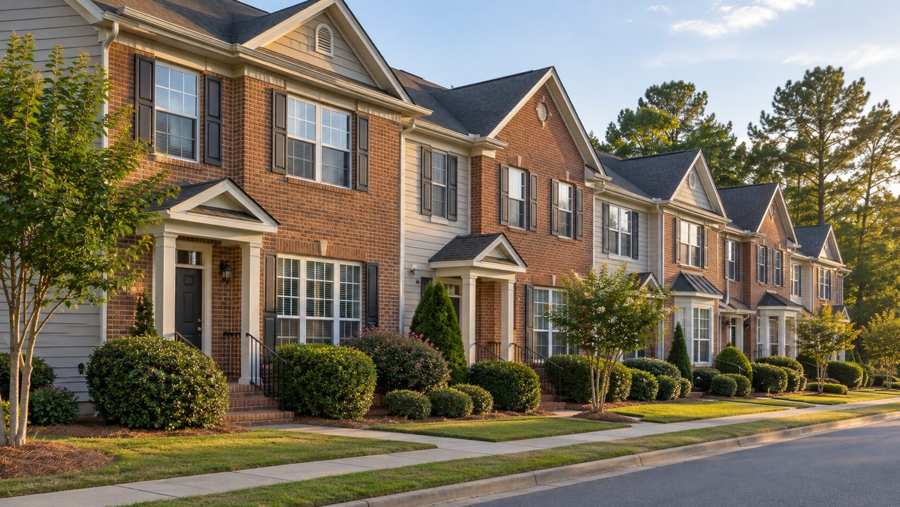
How long does an Alpharetta home take to sell? Realtor.com has a table for the city's neighborhoods, and the answer runs from 22 days in Crabapple to 114 days at The Country Club of the South. The city median is 50 days. The slowest neighborhood on the list waits more than five times as long as the fastest, and both are Alpharetta.
The prices disagree as well. Redfin says the median sale price for the three months to August was $789,478, down 1.6% on the year. Realtor.com says the median sold price is $736,750, up 4.06%. One page has prices falling and the other has them rising, and the levels differ by $52,728.
This brief reads both pages with the Census profile of the postal area that includes Alpharetta and the Realtor.com series for the Atlanta area. It asks what a spread of 22 to 114 days means for an owner, why a median listing price of $829,950 sits $93,200 above a median sold price, and what a seller should take from a market labeled both warm and balanced. It then sets out what a private sale changes.
Key Findings
- Redfin reported an Alpharetta median sale price of $789,478 for the three months to August 2026 (down 1.6%), $272 per square foot (up 0.9%), 37 days on market, 266 homes sold in August against 238 (up 11.6%) and 2 offers per home on average, and called the market somewhat competitive (Redfin, Alpharetta).
- Redfin put the sale-to-list ratio at 98.8% (up 0.9 points), the share of homes sold above list price at 19.3% and the share with price drops at 42.3% (up 10.3 points) (same Redfin page).
- Realtor.com reported a median listing price of $829,950 (down 3.44%), a median sold price of $736,750 (up 4.06%), $280 per square foot (down 1.09%), 748 active listings (up 9.52%, and up 101.64% over three years), a median of 50 days on market (up 25.61%), 726 rentals (up 22.28%) and a median rent of $2,118 a month (down 4.42%), with a table of median days on market for eight neighborhoods (Realtor.com, Alpharetta).
- In the Census postal area, 1,218 of 9,131 housing units (13.3%) were built before 1980, owners occupy 5,348 of 8,681 occupied homes (61.6%), median household income is $126,510 and the owner-estimated median home value is $640,500 (U.S. Census Bureau, 2020-2024).
- In the Atlanta-Sandy Springs-Roswell area the median days on market rose from 50 in May 2026 to 60 in September (Realtor.com, days on market).
Why does one city have waits of 22 and 114 days?
The Realtor.com table lists the median days on market for homes in eight Alpharetta areas. Crabapple is at 22 days, Rivermont at 32, Ocee at 39, Wellington at 47, Windward at 52, Echelon at 69, Old Roswell Villas at 74 and The Country Club of the South at 114. The city median of 50 sits in the middle of the list, and only two of the eight are within five days of it.
The table also shows change. Crabapple's wait fell 48.84% on the year, which means it was close to 43 days a year ago. Rivermont fell 25.58%. Ocee rose 30%, Wellington rose 27.03%, Windward rose 23.81% and The Country Club of the South rose 54.05%. In a year, the fastest area got faster, and the slowest got slower.
A wait is not a fact about a city. It is a fact about a kind of home in a kind of place at a price. An area with fewer listings and homes in a narrow price range will show a short wait, and an area with large and costly homes will show a long one. The table does not say which is the case, and the number of homes behind each median is small in places, since some areas have only a handful of homes for sale.
For an owner, the useful move is to ignore the city median and look at the area, then at the price band. A home in a quick area priced to the market might sell in three weeks, and a home in a slow area priced the same way might sit for four months. The city figure of 50 days describes neither.
| Area | Median days | Change on the year |
|---|---|---|
| Crabapple | 22 | Down 48.84% |
| Rivermont | 32 | Down 25.58% |
| Ocee | 39 | Up 30% |
| Wellington | 47 | Up 27.03% |
| Windward | 52 | Up 23.81% |
| Echelon | 69 | Up 8.59% |
| Old Roswell Villas | 74 | Not shown |
| The Country Club of the South | 114 | Up 54.05% |
Sources: Realtor.com page as cited. The figure of close to 43 days is this brief's arithmetic from the stated fall of 48.84%. The explanation of the spread is this brief's reasoning and not a finding of the page. Commercial content; not independently verified.
Is the sale median down 1.6 percent or up 4.1 percent?
Redfin's median sale price is $789,478 and its change is a fall of 1.6%. Realtor.com's median sold price is $736,750 and its change is a rise of 4.06%. The difference between the two levels is $52,728, which is 6.7% of the Redfin figure. The two pages cannot both describe the same set of homes.
They also differ on price per square foot, with Redfin at $272, up 0.9%, and Realtor.com at $280, down 1.09%. The levels are within $8 of each other, and the directions are opposite. A change of one percent either way is small, and the two are best read as saying that the price per foot is about level.
The likelier explanation for the gap in sale prices is a difference in what each counts. Redfin's figure covers three months and Realtor.com's covers a single month, and the first may include a spring that the second leaves out. The pages do not say, and I do not claim it.
The sensible reading is a range. A median sale somewhere between $737,000 and $789,000 is what these two pages support, with a direction that is flat within a few percent. A seller who hears a precise figure should ask for the list of sales behind it.
Sources: Redfin and Realtor.com pages as cited. The $52,728 and 6.7% figures are this brief's arithmetic. The explanation of the gap is this brief's reasoning and not a statement of either page. Commercial content; not independently verified.
Why is the median asking price $93,200 above the median sale?
Realtor.com shows a median listing price of $829,950 and a median sold price of $736,750, a gap of $93,200, or 11.2% of the asking figure. The asking median is down 3.44% on the year and the sold median is up 4.06%, so the gap is closing from a year ago, when the asking figure was about $859,500 and the sold figure about $708,000.
Both of those year-ago figures are this brief's arithmetic from the stated changes, and they assume the changes apply cleanly to the medians. The point they make is that a year ago the gap was larger, at about $151,000, so asking prices and selling prices have moved toward each other.
The gap in level does not mean that homes sell for 11% under their ask. Each page gives a separate measure of that. Realtor.com says homes sold for 1.3% below the asking price on average in August, with a ratio of 99%, and Redfin says 98.8%. Two sources agree that the typical home sells within about one and a quarter percent of its own ask.
So the large gap between medians comes from different groups of homes. The listings include large and costly homes that are still for sale. The sales include many homes at lower prices that closed. A seller can take two lessons. A home that is priced near its neighbors sells close to its ask. A home that is asked well above its neighbors waits, and the median asking price is a poor guide to the first price.
Sources: Realtor.com and Redfin pages as cited. The $93,200, 11.2%, $859,500, $708,000 and $151,000 figures are this brief's arithmetic. The explanation is this brief's reasoning and not a statement of either page. Commercial content; not independently verified.
Is Alpharetta somewhat competitive, warm or balanced?
Redfin says somewhat competitive, with two offers per home on average, and the nearby cities on its page score 44 and 60 against Alpharetta's 57. Realtor.com says warm, because homes sold in a median of 50 days, and balanced for August 2026, because supply and demand are about the same.
The Redfin panels give a range of waits. In one panel the average home sells for about 2% below its list price and goes pending in around 47 days, with the hottest homes at around 18 days. In another the average sells for about 3% below in around 63 days, with the hottest at around 24. In a third the average sells for about 2% below in around 48 days, with the hottest at around 25. The page does not label the panels in the text that I could read, so I do not say which home type each describes.
The spread is the same message as the neighborhood table: the wait depends on the home. Between 18 and 25 days for the hottest and 47 to 63 for the average is a range in which the owner's home is somewhere, and the pages do not say where.
The share of homes sold above the ask is 19.3%, about one in five, and unchanged on the year. That is a high share for a market called somewhat competitive. The share with a price cut is 42.3%, up 10.3 points from about 32.0% a year ago. So the market is one in which a fifth of homes sell above the ask and two in five are cut. It rewards a good price and punishes a poor one.
Sources: Redfin and Realtor.com pages as cited. The 32.0% figure is this brief's arithmetic. The reading of the panels is this brief's reasoning. Commercial content; not independently verified.
What do 748 listings and 266 sales add up to?
If the two counts are both right, 748 active listings against 266 monthly sales would be about 2.8 months of supply. The count of listings is from Realtor.com and the count of sales from Redfin, and they may not describe the same homes, so this is a rough illustration.
The direction is clearer. Realtor.com reports active listings up 9.52% on the year and up 101.64% over three years, which is a little over double the count of three years ago. Redfin reports 266 sales against 238, an increase of 11.6%. Listings and sales are both up, and the three-year doubling of listings is the larger change.
Rentals are up as well, at 726, an increase of 22.28%, while the median rent is $2,118 a month, down 4.42%. The Census puts renters at 3,333 of 8,681 occupied homes in the postal area, 38.4%, with median gross rent of $2,055. The Realtor.com median is $63 higher, and the two measure different things.
Taken together, the picture is a market with more of everything: more homes for sale, more sales and more rentals. It is not a market in which buyers are scarce. A seller who lists faces more competing homes than three years ago and a wait that is up 25.61% on the year on Realtor.com.
Sources: Realtor.com, Redfin and U.S. Census Bureau as cited. The 2.8 months and $63 figures are this brief's arithmetic and illustrations. Commercial content; not independently verified.
What does the Census say about Alpharetta homes?
The Census profile covers the postal area that includes Alpharetta. It counts 21,095 people and 9,131 housing units, of which 8,681 are occupied and 450 vacant, a vacancy rate of 4.9%. Median household income is $126,510. Owners live in 5,348 homes (61.6%) and renters in 3,333 (38.4%).
Owners estimate the median home at $640,500, with a margin of error of $30,054, or 4.7%. That is $148,978 below Redfin's median sale price of $789,478, a gap of 18.9%, and $96,250 below Realtor.com's sold median. The margin of error does not close either gap. The Census figure pools five years of survey answers from all owners, and the sale medians describe recent closings, so a gap of this kind says that owners' estimates run behind the market, or that the homes that sell are larger than the typical owned home.
The homes are newer than in most of this series. The median year built is 1999. The largest group, 2,250 homes (24.6%), dates from the 2010s, followed by 1,919 (21.0%) from the 1980s, 1,709 (18.7%) from the 2000s and 1,537 (16.8%) from the 1990s. A total of 4,457 homes, 48.8%, were built since 2000, and only 1,218, 13.3%, before 1980.
Newer homes face a different inspection. A home of the 2010s is about 10 years old, and a buyer's inspector will look at the warranty, the grading, the stucco or siding and the heating and cooling. A home of the 1980s is now about 40 years old and is more likely to have an older roof and windows. The sources here do not measure condition, and I do not estimate costs.
| Indicator | Value | Note |
|---|---|---|
| Population | 21,095 | Whole postal area |
| Housing units | 9,131 | All units |
| Built before 1980 | 1,218 | 13.3% of units |
| Built since 2000 | 4,457 | 48.8% of units |
| Owner occupied | 5,348 | 61.6% of occupied homes |
| Median household income | $126,510 | Whole postal area |
| Median home value | $640,500 | Owner estimate, margin of error $30,054 |
Source: U.S. Census Bureau as cited. The $148,978, 18.9%, $96,250 and 4,457 figures are this brief's arithmetic. Census figures cover the postal area, not the city.
What does the Atlanta series add?
The Realtor.com series for the Atlanta-Sandy Springs-Roswell area shows the region and not the city. Its median days on market was 50 in May, 52 in June, 56 in July, 59 in August and 60 in September, a rise of 10 days, or 20%. Alpharetta's 50 days on Realtor.com sits below the regional September figure.
Active listings in the area (Realtor.com, active listings) rose from 27,670 in May to 29,735 in September, an increase of 7.5%. New listings (Realtor.com, new listings) fell from 10,564 in March to 8,982 in July, a drop of 15%, and listings with a price reduction (Realtor.com, price reduced listings) rose from 9,140 in April to 11,608 in August, an increase of 27%.
The area median listing price (Realtor.com, median listing price) went from $425,000 in May to $415,000 in September, a fall of 2.4%. The Alpharetta figure of $829,950 is twice the area figure, so Alpharetta is a high-priced part of a wider region.
For a seller, the region is slowing a little. Waits are up, listings are up and cuts are up. None of this fixes the price of one home, and the series makes no forecast.
Sources: Realtor.com series on FRED as cited, for the Atlanta-Sandy Springs-Roswell metropolitan area. The 20%, 7.5%, 15%, 27% and 2.4% figures are this brief's arithmetic. Series are not seasonally adjusted. Commercial content; not independently verified.
What should an Alpharetta owner ask before accepting any offer?
Whether an offer is public or private, an owner can compare it with a short list of questions. What is the price, and is any part of it contingent on an inspection, a loan or the sale of another home? What will I receive at closing after every charge? On what date will the sale close, and can the date move? Who pays for any repair a buyer asks for? What is the buyer's evidence that the money is there?
The questions matter more in a market where one page says the sale median fell and another says it rose. A figure on a page cannot settle the value of a home, and a written offer, with its terms, can be compared with the net from a listing, using the same arithmetic on both.
The comparison should include the cost of waiting. In a slow area, a home that sits for 114 days carries taxes, insurance, upkeep and the cost of the next home that is not yet bought. A listing can end in a better price, and it can end in a cut. Two in five homes in the city had a cut on the Redfin page, and a cut is visible to every later buyer.
An owner can also ask what happens if the buyer withdraws. In a public sale the home returns to the market with a record that it was under contract, and later buyers may ask why the first deal failed. In a private sale the question does not arise in public. A written timeline for each step, signed by both sides, is a simple protection in either route. Readers comparing markets can also read the Brookhaven brief and the Sandy Springs brief.
Source: this brief's general reasoning. The 114 days and two in five figures are from the pages cited above. Commercial content; not independently verified.
What does a private sale change?
On a home that sells near $789,000, each 1% of the price is $7,895. That is arithmetic and not a claim about any commission or cost. It shows how a percentage turns into dollars, and why the amount an owner keeps, and not the headline price, is the figure to compare.
A private sale offers five things that a public listing cannot. There is privacy, because there are no showings and no neighbors talking about you selling. The closing date can be flexible, which gives you time to find a new home. There are no commission costs. There are no closing costs. And there are no inspections or repairs for the buyer to ask for.
Consider the neighborhood table. In The Country Club of the South a median home waits 114 days, and in Echelon 69. A public listing in a slow area is a long exposure: months of showings, a record of days on market and often a price cut. A private sale puts none of that on view.
The flexible date matters where a family needs to time a move around a school year or a job. A buyer who wants the home can agree to a date months away, and an owner who wants to stay until the end of a term can say so. In a public sale the date is part of a negotiation among offers.
None of this means that a private offer will always beat the market. In Crabapple, where the wait is 22 days, a public listing may sell quickly. The question for an owner is whether the chance of that outcome is worth the wait, the showings, the inspection and the public listing in the owner's own area.
Source: this brief's arithmetic and reasoning. The wait figures are from Realtor.com as cited. The benefits are those offered by Maison Off-Market. Commercial content; not independently verified.
Methodology and limitations
Prices, price per square foot, days on market, offers, sale-to-list ratio, price drops, listing counts, rentals and the neighborhood table for Alpharetta come from two commercial pages: a national brokerage and a national listing site. They measure different things and were not independently verified. The neighborhood table gives median days on market only for eight areas and may rest on few homes in some of them.
Age, tenure, vacancy, income, rent and owner-estimated value come from the American Community Survey 2020-2024 five-year estimates for the postal-code area that includes Alpharetta. Shares are calculated from published counts, and owner-estimated value carries a margin of error.
Days on market, active and new listings, median listing price and price reduced counts are Realtor.com series published by the Federal Reserve Bank of St. Louis for the Atlanta-Sandy Springs-Roswell metropolitan area. They describe the region and not the city. The brief makes no forecast and values no home.
Conclusion
The Alpharetta record shows waits from 22 to 114 days across neighborhoods, a sale median that is down 1.6% on one page and up 4.1% on another, listings up 9.5% on the year and about double the count of three years ago and a region in which waits and price cuts are rising.
It does not fix a price for any one home. The choice between a public listing and a private sale comes down to whether an owner would rather compete in that market or take privacy, a flexible closing date, no commission, no closing costs and no inspections or repairs. To see what a direct offer would look like for your home, use the contact form below or call 401-219-4207.
Frequently Asked Questions
What is the median home price in Alpharetta?
Redfin reports $789,478 for the three months to August 2026, down 1.6%, and Realtor.com reports a median sold price of $736,750, up 4.06%.
How long do Alpharetta homes take to sell?
Realtor.com shows medians from 22 days in Crabapple to 114 days at The Country Club of the South, with 50 days for the city; Redfin says 37 days.
Is Alpharetta a seller's market?
Redfin calls it somewhat competitive and Realtor.com calls it warm and balanced; 19.3% of homes sold above the ask and 42.3% had a price cut.
Why does the Census value differ from sale prices?
The Census figure is a five-year owner estimate of $640,500, while the sale medians describe recent closings.
Does a private sale always beat a public listing?
No. A public listing can attract competing bids. A private sale offers privacy, a flexible closing date, no commission, no closing costs and no inspections or repairs.
Compare your options before committing. Request a written private offer for your property, with no obligation, then weigh it against your listing plan.
Sources
- Redfin, 2026. Alpharetta Housing Market Trends. https://www.redfin.com/city/438/GA/Alpharetta/housing-market.
- Realtor.com, 2026. Alpharetta, GA Housing Market and Rental Trends. https://www.realtor.com/local/market/georgia/fulton-county/alpharetta.
- U.S. Census Bureau, 2026. American Community Survey 2020-2024 five-year estimates, the Alpharetta area (via Census Reporter). https://censusreporter.org/profiles/86000US30009-30009/.
- Realtor.com, 2026. Housing Inventory: Median Days on Market in Atlanta-Sandy Springs-Roswell, GA (CBSA). https://fred.stlouisfed.org/series/MEDDAYONMAR12060.
- Realtor.com, 2026. Housing Inventory: Active Listing Count in Atlanta-Sandy Springs-Roswell, GA (CBSA). https://fred.stlouisfed.org/series/ACTLISCOU12060.
- Realtor.com, 2026. Housing Inventory: New Listing Count in Atlanta-Sandy Springs-Roswell, GA (CBSA). https://fred.stlouisfed.org/series/NEWLISCOU12060.
- Realtor.com, 2026. Housing Inventory: Price Reduced Count in Atlanta-Sandy Springs-Roswell, GA (CBSA). https://fred.stlouisfed.org/series/PRIREDCOU12060.
- Realtor.com, 2026. Housing Inventory: Median Listing Price in Atlanta-Sandy Springs-Roswell, GA (CBSA). https://fred.stlouisfed.org/series/MEDLISPRI12060.
Related research

Seller Guide · October 6, 2026
How to Prepare Point Pleasant Beach Rental Records Before Selling
Separate rental approval, income history and booked stays before comparing sale terms.

Seller Guide · October 6, 2026
How to Prepare Rumson Flood and Waterfront Records Before Selling
Separate flood disclosure, elevation, repairs and waterfront rights before comparing sale terms.

Seller Guide · October 6, 2026
How to Prepare Sarasota Condo Inspection and Reserve Records Before Selling
Separate building condition, reserve funding and resale documents before comparing sale terms.