Market Brief · by Aidan Sowa · October 5, 2026
Is Cotswold Getting Pricier When the Price per Foot Is Falling? Reading a Rising Listing Median Beside a Falling Price per Foot
Reading a Rising Listing Median Beside a Falling Price per Foot for Cotswold, NC, with each source dated and its limits noted, for owners weighing a listing against a direct sale.
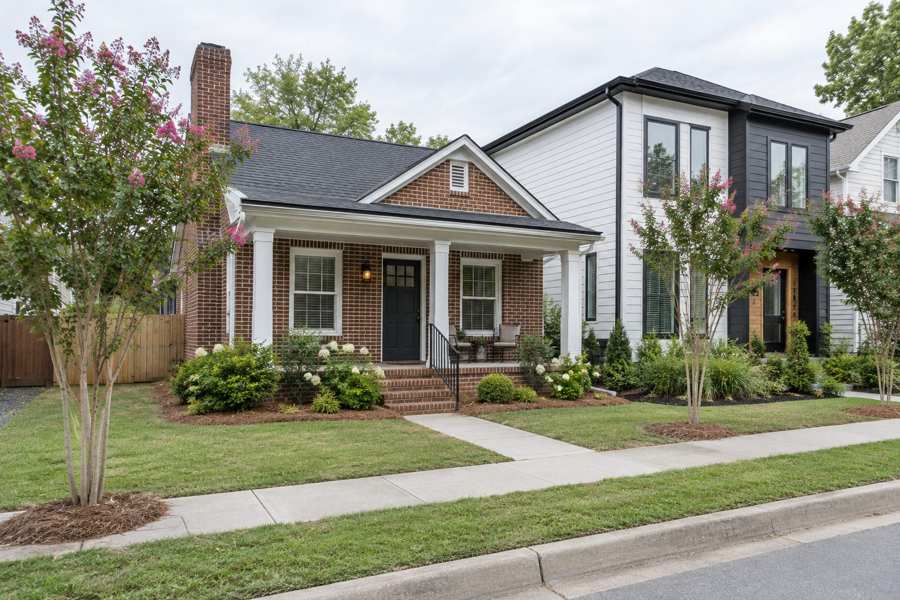
Did home prices in Cotswold rise by half in a year? Realtor.com says the median listing price in September 2026 is $974,900, up 46.16%, and the median sold price is $975,000, up 50.58%. Redfin says $975,000 for the three months to August, up 62.4%. All three point the same way and are very large. Yet the Realtor.com price per square foot is $350, down 1.63%. A price that rises by half while the price per foot slips cannot be the same homes getting dearer.
The arithmetic is plain. A listing at $974,900 and $350 per foot is a home of about 2,785 square feet. A year ago, $667,000 at about $356 per foot was a home of about 1,875 square feet. The typical house on the market has grown by close to half. That fits a neighborhood that has new construction going up beside older cottages, and the Realtor.com listing for the area shows a new home community named Ferncliff at Cotswold.
This brief reads the Realtor.com page and the Redfin page side by side, adds the Census profile of the postal area and the Charlotte area series, and asks what the numbers mean for an owner who is choosing between a public listing and a private sale.
Key Findings
- Realtor.com reported, as of September 2026, a median listing price of $974,900 for Cotswold (down 2.02% on the month and up 46.16% on the year), a median sold price of $975,000 (up 13.04% and up 50.58%), $350 per square foot (down 9.97% and down 1.63%), 70 homes for sale (down 7.02% and up 39.47%) and a median of 97 days on market (up 15.48% and up 61.67%).
- The same page gave a sale-to-list ratio of 97%, with homes selling 2.61% below the asking price, and called September 2026 a balanced market and a cool one. It counted 15 rentals (up 33.33% on the year) at a median rent of $1,825 a month (down 1.35%).
- Redfin reported, for the three months to August 2026, a median sale price of $975,000 (up 62.4% on the year), $404 per square foot (up 47.7%), 58 days on market against 63 a year earlier and 32 homes sold in August against 27. It called the market somewhat competitive.
- In the Census postal area that includes Cotswold, 13,602 of 15,233 housing units are occupied, 1,631 (10.7%) are vacant, owners hold 7,392 of the occupied homes (54.3%), the median household income is $132,917 and the owner-estimated median home value is $774,900 (Census Reporter, American Community Survey profile).
- In the Charlotte-Concord-Gastonia area the median days on market was 47 in May 2026 and 64 in September (Realtor.com, days on market).
How can the price rise by half while the price per foot falls?
Start with what each figure counts. The median listing price is the middle price of the homes for sale. The price per square foot divides each price by the size of the home. If the homes for sale are bigger, the price rises and the price per foot stays put. On the Realtor.com page the listing price is up 46.16% on the year and the price per foot is down 1.63%. The only way both can be true is that the homes on offer are about 48% larger than the homes on offer a year ago.
A neighborhood of older cottages and small ranches does not grow its homes by half in a year. A neighborhood in which builders are replacing small homes with new two-storey houses, and in which a new home community has opened, does. The new houses come to the market at higher prices and larger sizes, and they pull the median up. The pages do not say this, so it is an inference, but it is the one that fits all the figures.
It also helps to put the three-month and one-month views side by side. Redfin averages three months, so a handful of big sales in June or July are still in its median in August, while Realtor.com's sold figure is for the single month of September. The 13.04% rise in the monthly sold median, from about $862,500 to $975,000, may simply be a month with more of the new houses closing.
Redfin's figures look different. It reports $404 per square foot, up 47.7%, which does not match Realtor.com's flat figure. The two measure different things. Redfin's price per foot is for homes that sold, and Realtor.com's is for homes that are listed. If the homes that sold were mostly new and expensive per foot, and the homes still listed were older, the two could part company. Redfin's sold median of $975,000 is up 62.4%, which implies about $600,000 a year earlier.
The sold median agrees with the listing median to within $100, at $975,000 and $974,900. That is a coincidence of two medians, and not a sign that every home sells at its asking price. The sale-to-list ratio of 97% and the 2.61% discount say that a typical $975,000 sale gave up about $25,400 from its asking price.
There is a second effect that a seller should not miss. New houses at nearly a million dollars set a visible price on the street, and a buyer who sees one next door to an older home will ask what the older home is worth as a lot. A seller of an older home may be pleased by the comparison, and may also find that the buyer is pricing the land and discounting the house. Both views are common in neighborhoods that are being rebuilt.
For an owner, the lesson is that a neighborhood median describes the new homes as much as the old. An owner of a 1,900 square foot house from the 1950s should not read $975,000 as a price for it. The sensible comparison is a house of the same age and size, and the page does not give one.
| Indicator | Level | Change on the month | Change on the year |
|---|---|---|---|
| Median listing price | $974,900 | -2.02% | +46.16% |
| Median sold price | $975,000 | +13.04% | +50.58% |
| Price per square foot | $350 | -9.97% | -1.63% |
| Homes for sale | 70 | -7.02% | +39.47% |
| Days on market | 97 | +15.48% | +61.67% |
Source: Realtor.com and Redfin pages as cited. The $667,000, $356, 2,785 and 1,875 square foot, 48%, $600,000 and $25,400 figures are this brief's arithmetic from the stated changes. The explanation based on new construction is this brief's inference and not a statement of any page. Commercial content; not independently verified.
Is the wait 97 days or 58?
Realtor.com gives a median of 97 days for homes that are for sale, up 61.67% on the year, which implies about 60 days in 2025, and up 15.48% on the month, from about 84. Redfin gives 58 days for the three months to August, against 63 a year earlier. One page says that the wait has risen by three fifths. The other says that it has fallen by 8%.
The measures differ in the usual way. Redfin counts how long it took the homes that sold. Realtor.com counts how long the homes that are listed now have been listed. If a number of new, high priced homes are sitting, as the price figures hint, the second measure rises while the first does not. Fast sales of older, lower priced homes keep Redfin's figure down.
The month-on-month figure is sharp too. The wait rose 15.48% in the month, and the median rent rose 30.36%, from about $1,400 to $1,825. A rent that jumps by nearly a third in a month, from a count of 15 rentals, is an artifact of a very small sample, in which one or two listings can move the median. The same caution applies to the 29.41% fall in the number of rentals, from about 21 to 15.
That would be a useful warning for sellers of the new houses, and for sellers who are pricing near them. A wait of 97 days is the experience of the homes that have not sold. A house priced at the top of the neighborhood's range may find itself in that group.
The region is faster. In the Charlotte area, the median days on market was 47 in May, 51 in June, 57 in July, 61 in August and 64 in September, a rise of 17 days or 36.2%. Cotswold's 97 is 33 days, or 51.6%, longer than the September regional figure.
Source: Realtor.com and Redfin pages as cited, and Realtor.com series for the Charlotte area. The 60 day, 84 day, 8%, 17 day, 36.2%, 33 day and 51.6% figures are this brief's arithmetic. The explanation of the measures is this brief's reasoning. Commercial content; not independently verified.
What does a table that names 14 of 70 homes tell an owner?
The Realtor.com page lists fifteen named areas inside Cotswold. Churchill Downs Condominiums has 4 homes for sale, up 20%, Avondale 3, up 50%, Churchill Downs 2, and The Cotswolds on Walker Condominiums 2, up 100%. Cotswold Glen, Open View and Randolph Park have one each. Eight more areas have none, among them Amity Court, Kings Grant and Whitby Pond.
Those rows add up to 14 homes. The page gives 70 for the neighborhood. The named areas hold 20% of the stock, and 56 homes, 80%, are not in any of them. A reader who hoped to find a home's own street in the table will usually not find it. The condominium names account for 6 of the 14, so the table leans toward attached housing, while the unnamed 56 are probably streets of houses.
The postal area that includes Cotswold is larger. The Realtor.com table shows 209 homes for sale in it, up 21.19%, with a median listing price of $982,000 and $388 per square foot. Cotswold's 70 homes are 33.5% of the postal area's stock, and its median listing price is within $7,100, 0.7%, of the area's. The rent in the postal area is $2,195, which is 20% above Cotswold's $1,825.
The mix of buildings in the table says something as well. The condominium buildings are likely to have homeowners association fees, shared walls and rules that a buyer will look at, and a seller of a unit in one of them competes with the other units in the same building. A seller of a house on a named street competes with the houses on it, and there may be only one or two at any time.
The small counts matter. Avondale up 50% is from two homes to three. The Cotswolds on Walker Condominiums up 100% is from one to two. A percentage in a count this small is a change of one home, and an owner should not read any of those as a trend.
| Area | Homes for sale | Change on the year | Rentals |
|---|---|---|---|
| Churchill Downs Condominiums | 4 | +20% | 1 |
| Avondale | 3 | +50% | 0 |
| Churchill Downs | 2 | not stated | 0 |
| The Cotswolds on Walker Condominiums | 2 | +100% | 1 |
| Cotswold Glen, Open View and Randolph Park | 1 each | 0% for Open View | 0 |
| All named areas, 14 homes in all |
Source: Realtor.com page as cited. The 14, 20%, 56, 80%, 33.5%, $7,100, 0.7% and 20% figures are this brief's arithmetic. The remark on streets of houses is this brief's inference and not a statement of the page. Commercial content; not independently verified.
What does the Census say about a postal area that is almost half renters?
In the postal area that includes Cotswold, owners hold 7,392 of the 13,602 occupied homes, 54.3%, and renters 6,210, 45.7%. That is a high share of renters for a place where houses sell for nearly a million dollars. The population is 33,925, about 2.49 per occupied home, and the median household income is $132,917. The owner-estimated median home value is $774,900, with a margin of error of $47,099.
The sold median of $975,000 is 25.8% above the Census value and 7.3 times the median income. The Census value is the opinion of owners across the whole postal area, and the sold median is the result of sales in one neighborhood, much of it new. A gap of $200,100 is what an owner would expect to see between a whole area and a neighborhood that is being rebuilt.
The housing stock is mixed in age. The Census counts 2,950 homes from the 2010s (19.4%) and 533 from 2020 or later (3.5%), so 3,483, 22.9%, were built in the last sixteen years. At the other end, 4,341 were built in the 1950s and 1960s, 28.5%. The median year built is 1983, and 7,116, 46.7%, were built before 1980.
A few more points follow from the figures. The postal area has 1,631 vacant homes, 10.7% of the stock, a modest share that suggests few seasonal homes. The 6,210 rented homes are a pool of potential investors and tenants, and a seller who reaches a landlord can find a buyer who values a lease in place. The population per occupied home, 2.49, suggests families more than singles.
That spread of ages is the shape of a place that is being renewed. Old homes at the low end share a postal area with new ones at the top, and the two groups are priced by different logic. The rent shows how close the rental market is to the Census figure: the Census median gross rent is $1,767 and the Realtor.com asking rent is $1,825, only 3.3% higher.
Source: U.S. Census Bureau, American Community Survey 2020-2024, and Realtor.com as cited. Ratios, shares and gaps are this brief's arithmetic. The remark on renewal is this brief's reasoning and not a statement of the Census.
What does the Charlotte series add, and what should an owner ask?
Active listings in the Charlotte area rose from 8,851 in March 2026 to 11,221 in July (Realtor.com, active listings), a gain of 26.8%. New listings fell from 5,250 in April to 4,106 in July (Realtor.com, new listings), a drop of 21.8%. Homes with a price cut rose from 4,406 to 5,370 (Realtor.com, price reduced listings), a gain of 21.9%, and were 47.9% of the active homes in July.
The regional median listing price was $440,000 in June and $429,000 in August (Realtor.com, median listing price), a fall of 2.5%. The Cotswold listing median is 2.3 times that figure. Almost half the region's active homes had a cut, so a high ask is not unusual, and neither is a cut.
The regional figures give a cautious backdrop. Stock has risen by more than a quarter since March, new listings are falling, and nearly half of homes have a cut. A seller in Cotswold faces buyers who know that the region has more homes to choose from than it did in the spring, and who have seen price cuts become common. The neighborhood's higher price is therefore a claim that each seller must back with a specific house.
Whether an offer is public or private, an owner can test it with plain questions. What is the price, and is any part of it conditional on an inspection, a loan or the sale of another home? What will I take home after every charge? When will the sale close, and can that date move? Who pays for repairs the buyer asks for?
For an older house in a neighborhood that is being rebuilt there are more. Is the lot worth more than the house, and would a buyer plan to rebuild? What does the zoning allow, and what has been built nearby? What would an inspector find in an older roof, wiring, plumbing and foundation? At 97 days, how much does an owner pay in taxes, insurance and upkeep before a buyer arrives? Readers comparing markets can also read the Matthews Edge brief and the Foxcroft brief.
Source: Realtor.com series published by the Federal Reserve Bank of St. Louis as cited. The 26.8%, 21.8%, 21.9%, 47.9%, 2.5% and 2.3 figures are this brief's arithmetic. The questions are this brief's general reasoning and not statements of any source.
What does a private sale change?
Maison Off-Market buys homes directly from their owners. It does not list a home, hold showings or put a home on a public listing. For a Cotswold owner, the five benefits are plain. There are no showings and no neighbors talking about the sale. The closing date can be flexible, which gives time to find a new home. There are no commission costs and no closing costs for the seller, and there are no inspections and repairs.
A little arithmetic shows what that is worth. Each 1% of a $975,000 sale is $9,750. A seller who gives up 3% gives up $29,250, and one who gives up 5% gives up $48,750. This brief does not claim that those are the costs of any sale, since the real figures depend on the agreement the seller signs. It shows how quickly a percentage becomes a sum.
For the owner of an older home on a lot that a builder might want, a private sale has a particular appeal. A public listing invites the market to price the house as a house, and a buyer who wants to rebuild will discount it. A direct buyer can be asked to price the whole property, land and house, in one offer, with a fixed date, and the owner can compare that number against the public figures above without a single showing.
The trade is that a private buyer may offer a price that differs from what a public sale could bring. In a market where new homes are pulling the median up, a public sale of a well placed lot may well fetch more. The useful comparison is the price after every cost and every week of waiting, and after the repairs a buyer's inspector would ask for, set against a closing date the seller picks.
Maison Off-Market speaks only to sellers. An owner who wants to know what a direct offer would look like can use the contact form below, or call 401-219-4207, and ask for a figure with no showings, no listing and no obligation.
Source: Maison Off-Market. The fee figures are this brief's arithmetic and not claims about any sale.
Methodology and limitations
Prices, price per square foot, days on market, listing and rental counts and the named-area table for Cotswold come from two commercial pages: a national listing site page with charts to August 2026 and a national brokerage page with figures to August 2026. They count different things and are not independently verified.
Age, tenure, vacancy, income, rent and owner-estimated value come from the American Community Survey 2020-2024 five-year estimates for the postal-code area that includes Cotswold. Shares are calculated from published counts, and owner-estimated value carries a margin of error.
Days on market, active and new listings, median listing price and price reduced counts are Realtor.com series published by the Federal Reserve Bank of St. Louis for the Charlotte-Concord-Gastonia metropolitan area. They describe the region and not the neighborhood. The brief makes no forecast and values no home.
Conclusion
The Cotswold record shows a listing median up 46% and a sold median up 51% with a price per foot that fell, a wait of 97 days on one page and 58 on another, a table that names 14 of 70 homes and a Census area that is nearly half renters and one quarter new.
It does not fix a price for any one home. The choice between a public listing and a private sale comes down to whether an owner would rather compete in that market or take privacy, a flexible closing date, no commission, no closing costs and no inspections or repairs. To see what a direct offer would look like for your home, use the contact form below or call 401-219-4207.
Frequently Asked Questions
What is the median home price in Cotswold?
Realtor.com reports a median sold price of $975,000 for September 2026, up 50.58%, and a median listing price of $974,900, up 46.16%. Redfin reports $975,000 for the three months to August, up 62.4%.
How long do Cotswold homes take to sell?
Realtor.com reports a median of 97 days for September 2026, and Redfin reports 58 days for the three months to August.
Is Cotswold a buyer's or a seller's market?
Realtor.com calls September 2026 balanced, with a sale-to-list ratio of 97%. Redfin calls it somewhat competitive.
Why did the price rise by half while the price per foot fell?
The pages do not say. The pattern fits a shift toward larger homes, such as new construction, in the mix of homes for sale.
Does a private sale always beat a public listing?
No. A public listing can attract competing bids. A private sale offers privacy, a flexible closing date, no commission, no closing costs and no inspections or repairs.
Compare your options before committing. Request a written private offer for your property, with no obligation, then weigh it against your listing plan.
Sources
- Realtor.com, 2026. Cotswold Neighborhood of Charlotte, NC Housing Market. https://www.realtor.com/local/market/north-carolina/charlotte/cotswold.
- Redfin, 2026. Cotswold, Charlotte Housing Market. https://www.redfin.com/neighborhood/52138/NC/Charlotte/Cotswold/housing-market.
- U.S. Census Bureau, 2026. American Community Survey 2020-2024 five-year estimates, the Cotswold area (via Census Reporter). https://censusreporter.org/profiles/86000US28211-28211/.
- Realtor.com, 2026. Housing Inventory: Median Days on Market in Charlotte-Concord-Gastonia, NC-SC (CBSA). https://fred.stlouisfed.org/series/MEDDAYONMAR16740.
- Realtor.com, 2026. Housing Inventory: Active Listing Count in Charlotte-Concord-Gastonia, NC-SC (CBSA). https://fred.stlouisfed.org/series/ACTLISCOU16740.
- Realtor.com, 2026. Housing Inventory: New Listing Count in Charlotte-Concord-Gastonia, NC-SC (CBSA). https://fred.stlouisfed.org/series/NEWLISCOU16740.
- Realtor.com, 2026. Housing Inventory: Price Reduced Count in Charlotte-Concord-Gastonia, NC-SC (CBSA). https://fred.stlouisfed.org/series/PRIREDCOU16740.
- Realtor.com, 2026. Housing Inventory: Median Listing Price in Charlotte-Concord-Gastonia, NC-SC (CBSA). https://fred.stlouisfed.org/series/MEDLISPRI16740.
Related research

Seller Guide · October 6, 2026
How to Prepare Point Pleasant Beach Rental Records Before Selling
Separate rental approval, income history and booked stays before comparing sale terms.

Seller Guide · October 6, 2026
How to Prepare Rumson Flood and Waterfront Records Before Selling
Separate flood disclosure, elevation, repairs and waterfront rights before comparing sale terms.

Seller Guide · October 6, 2026
How to Prepare Sarasota Condo Inspection and Reserve Records Before Selling
Separate building condition, reserve funding and resale documents before comparing sale terms.