Market Brief · by Aidan Sowa · October 5, 2026
What Is a Green Hills Home Worth? Reading a Sharply Rising Median Beside a Modest One
Reading a Sharply Rising Median Beside a Modest One for Green Hills, TN, with each source dated and its limits noted, for owners weighing a listing against a direct sale.
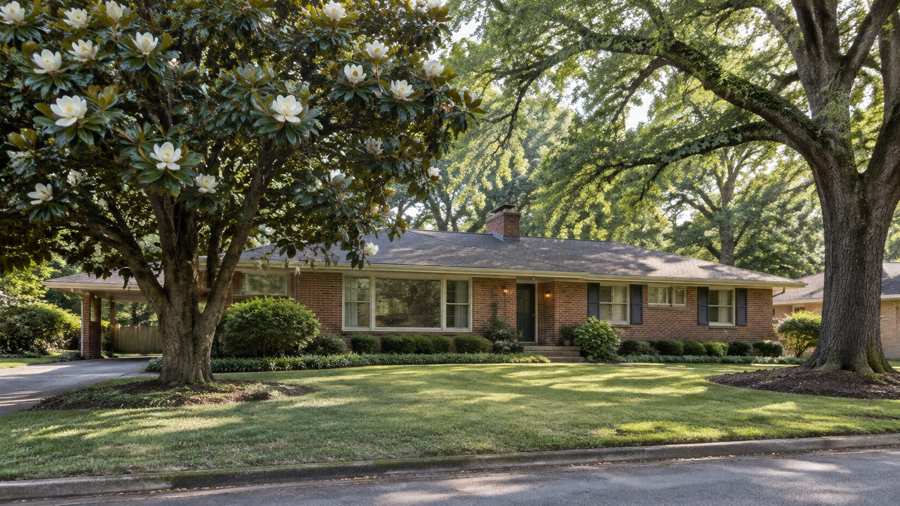
Is a Green Hills home worth $1,100,000, $1,300,000 or $1,385,000? Each figure is published for the same Nashville neighborhood in 2026. The first is a median sale price as of March, the second a three-month median on Redfin and a median sold price on Realtor.com in April, and the third a rolling twelve-month median from a local data feed. The highest is 1.26 times the lowest, a gap of $285,000.
The pages disagree about direction. Redfin shows the three-month median up 42.0% on the year. A local agent's blog shows the same measure for an earlier window up 13.6%. Another page shows the median up roughly 8% in March. A fourth shows the median listing price down 2.12%, and Zillow's value index is down 5.4%. All of these describe 2026, and all describe Green Hills.
Maison Off-Market buys luxury homes and estates directly from their owners and speaks only to sellers. We do not estimate what any home is worth, and nothing here is a valuation. This brief sets the sources side by side, shows where one page contradicts another, and states what a percentage of a price is worth in dollars. Every figure is attributed, every calculation is this brief's own arithmetic and every inference is labeled as one.
Key Findings
- Redfin showed, for the three months ending July 2026, a median sale price of $1.3 million (up 42.0%), $439 per square foot (up 21.9%), a median of 68 days on market against 53, 175 homes sold in July against 142, a sale-to-list ratio of 97.1% and 7.6% of homes sold above list (Redfin, Green Hills housing market).
- Realtor.com, with indicators as of March 2026, showed a median listing price of $1,199,000 (down 2.12%), 221 active listings and a median of 61 days on market, and its text calls the same $1.20 million a median home sale price (Realtor.com, Green Hills market data).
- A brokerage article quoted Realtor.com's April snapshot as a $1.275 million median listing price, a $1.3 million median sold price, 291 active listings and 64 days, and a 95% sale-to-list ratio (Selling a home in Green Hills in a shifting market).
- An April 29, 2026 market update showed a median of 97.07% of list price, an average of 99 days from listing to closing and 5.43 months of inventory from 114 active listings and 63 closings in three months (Nashville Real Estate Now, Green Hills market update).
- A buyer's guide quoted a median near $1.1 million, up about 8% as of March, and 54 homes for sale in Green Hills proper averaging $2.27 million (What your budget buys in Green Hills).
- A local agent's blog quoted a three-month median of $1.2 million (up 13.6%), a Zillow value index down 5.4% and a rolling twelve-month median of $1,385,000 at $425 per square foot (Local agent blog, why prices rise and fall at once).
- The Census shows a postal area with 22,018 residents, a median household income of $155,863 and a median gross rent of $1,983, with 75.8% of occupied homes owner-occupied (Census Reporter, American Community Survey profile).
Is the Green Hills market up 42 percent, up 14, up 8 or down 5?
The pages answer five different questions. Redfin's 42.0% is the change in the median sale price of all homes in the three months to July against the same months a year earlier. The 13.6% in the local blog is the same kind of measure for the three months to June. The roughly 8% in the buyer's guide is a March figure. The 2.12% decline is in the median listing price on Realtor.com, which measures asking prices and not sales. The 5.4% decline is in Zillow's typical-value estimate, which smooths over a longer period and is an estimate and not a price.
The blog explains why the first two differ. It quotes the one-month average price at $1.3 million, up 52.3% on the year, and the three-month median at $1.2 million, up 13.6%. The gap between 52.3% and 13.6% is 38.7 points, a gap this brief computes, and it comes from the window. A single month of a small neighborhood is a handful of sales, and one $6.10 million new build can move an average a long way. The same blog describes Green Hills as one of the busier teardown-and-rebuild corridors in the county, with new construction priced from $2.5 million to more than $6 million.
Redfin's own figures show the effect. Its median sale price of $1.3 million is up 42.0%, while its price per square foot of $439 is up 21.9%. The price per foot rose half as much as the price. That is consistent with a change in the mix of homes sold, with larger and newer houses a bigger share, and that reading is this brief's inference. Sold counts are up from 142 to 175 in July, a rise of 23.2%, which is a bigger sample than a month usually gives but still a few dozen homes.
The levels differ as well. The median sold figure is $1.1 million in March, $1.2 million for three months to June, $1.3 million in April on Realtor.com and for three months to July on Redfin, and $1,385,000 over a rolling twelve months. The highest is 1.26 times the lowest. If the answer to how much is it worth ranges over $285,000 depending on the window, then the window matters more than the neighborhood name.
The listing median adds a view. Realtor.com's $1,199,000 in March and $1.275 million in April are both below the $1.3 million sold median that the same site gave in April. A median listing price below a median sold price means that the homes that sold were larger or more expensive than the homes still for sale, or that homes are selling above their list price. The Redfin ratio of 97.1% and its 7.6% of homes above list point to the first reading, which is this brief's inference.
| Source | Figure | Change | What it measures |
|---|---|---|---|
| Buyer's guide | $1,100,000 | Up about 8% | Median sale price, March |
| Realtor.com | $1,199,000 | Down 2.12% | Median listing price, March |
| Local agent blog | $1,200,000 | Up 13.6% | Median sale price, three months to June |
| Realtor.com via article | $1,300,000 | Not given | Median sold price, April |
| Redfin | $1,300,000 | Up 42.0% | Median sale price, three months to July |
| Local data feed via blog | $1,385,000 | Not given | Median sale price, rolling twelve months |
| Zillow via blog | Not given | Down 5.4% | Typical home value, twelve months |
Sources as cited. The measures and months differ and the figures are not directly comparable. Commercial content; not independently verified.
Is the wait 35 days, 52, 61, 68 or 99?
The clocks run from 35 to 99 days. The buyer's guide says that well-priced homes close in about 35 days, and also quotes a Redfin average of 97 days in March. Realtor.com shows 52 days for the whole postal area in March, 61 for the neighborhood in March and 64 in April. Redfin shows 68 days for the three months to July, up from 53, an increase of 28.3%. The market update gives 99 days from listing to closing, as an average.
Part of the gap is what is counted. The 35 days is for well-priced homes, which is a selection and not a median. The 99 days is the entire process from listing to closing, and the update separates it from days on market, which it says tells how fast buyers respond. The Redfin figure of 68 days on market is 2.8 times the 35. A seller reading the 35 would plan for a month, and a seller reading the 99 would plan for three.
The pace of sales gives another view. The market update counts 114 active listings and 63 closings in the last three months and computes 5.43 months of inventory, a figure that is 114 divided by 21 closings a month. The page calls that closer to balanced than overheated. Redfin's 175 sales in July is a larger number than 21 a month, and the two cannot describe the same area. The update may be counting a narrower neighborhood, and the pages do not say.
The active counts differ too. The buyer's guide gives 54 homes for sale in Green Hills proper on May 28 and 190 in the whole postal area on June 16. The market update gives 114, Realtor.com gives 221 in March and 291 in April, and the article quotes 255 for the postal area in March. The largest is 5.4 times the smallest. A count of competing homes is a count of a boundary, and the boundaries are not the same on any two pages.
The sale-to-list ratios agree better than anything else. Redfin shows 97.1% and the update shows a median of 97.07%. The buyer's guide shows 95.91% for the last thirty days, with 39.71% of listings having had a price drop and 4.41% of homes sold above list. The article shows 95% from Realtor.com and says homes in the postal area sold 2.38% below asking on average, which is 97.62%. The range is 95% to 97.6%, so a seller should expect a deal about 2% to 5% under the list price, an inference from these ratios and not a promise about any home.
Why are the asking prices twice what buyers pay?
The buyer's guide states the problem in one line: sellers are asking twice what buyers are paying. It gives the active listings in the postal area on June 16 as 190, with an average asking price of about $2.45 million, ranging from $182,500 to $28.5 million. In Green Hills proper it gives 54 active homes averaging $2.27 million and $487 per square foot on May 28. The $2.45 million average is 1.88 times the Redfin sold median of $1.3 million.
A mean asking price and a median sold price are different statistics, so the ratio is not a measurement of how far a seller must come down. A range from $182,500 to $28.5 million pulls an average a long way. The same guide notes that the middle of the distribution has almost nothing in it. The local blog gives a reason, which is that the most expensive new construction sits active longer while lower-priced homes sell and leave the pool. That is the blog's reading, and this brief takes it as plausible and unproven.
The market update shows the other side. It says some well-positioned homes sell at or near full price with very low days on market, while a layer of cancelled and expired listings sits among the larger luxury homes. Several homes listed from $4 million to above $5 million did not convert in the period it captured. It splits the market into price bands, noting that the segment under $1.5 million is more liquid but price-sensitive, and the band from $1.5 million to $2.5 million is competitive, with buyers comparing several similar homes.
The Census shows who lives there. The postal area has 22,018 residents and 11,310 homes, of which 10,341 are occupied and 969 vacant, a vacancy of 8.6%. Of the occupied homes, 7,836 (75.8%) are owner-occupied and 2,505 (24.2%) are rented. The median household income is $155,863 and the median gross rent is $1,983, which is 15.3% of the monthly income at the median, a ratio this brief computes. The median owner-occupied value is $1,046,500 with a margin of error of $56,630, which is 80.5% of Redfin's $1.3 million median sale price. The older stock holds the middle: 5,622 of the homes (49.7%) were built before 1980, and the median year built is 1980.
The pages also flag a point sellers of newer homes should know. The local blog says to ask whether a listing is site-built or an HPR-detached home, a detached home that the blog says comes with a master deed and a list of shared elements. A buyer who does not ask may be surprised, and the blog also advises confirming financing early. This brief takes no view on any particular home.
Source: Census Reporter, American Community Survey 2020-2024 five-year estimates, tables B25034, B25077, B25003, B25002, B19013 and B25064. Percentages and ratios are this brief's arithmetic.
What do the three-year changes and the rents add?
The Realtor.com page gives three-year changes next to the one-year ones, and they put the one-year figures in a longer frame. The median listing price is down 2.12% on the year and down 12.48% over three years. Active listings are down 0.47% on the year and up 25.44% over three years. The median days on market is up 10.91% on the year and up 117.86% over three years. The median rent is up 75% on the year and up 90.91% over three years. All four are for March 2026.
Read together, they describe a market in which asking prices have eased, the number of homes for sale has grown by a quarter and homes take more than twice as long to sell as they did three years earlier. If 61 days is 117.86% above the figure three years ago, then the earlier figure was about 28 days, a number this brief backs out from the page. Redfin's 68 days against 53 a year earlier is consistent with the same direction. It is the median sale price that has not eased, on the evidence of Redfin's 42.0%, and so prices and waits have moved in different directions.
The rent figures are the strangest on the page. A median rent of $4,200 a month, up 75% on the year, would be $50,400 a year, which is 3.9% of the $1.3 million median sale price. The Census median gross rent for the postal area is $1,983, so the page's figure is 2.1 times the Census figure. A current asking rent for a house is not the same as the median rent that all tenants pay, and a few listings can move a rent median in a small neighborhood. The rise of 75% in a year is more likely a sample effect than a market rise, which is this brief's inference.
The Realtor.com page also calls its median listing price a median home sale price in its own text. The same $1.20 million is shown in the table as a listing price and in the prose as a sale price. A reader who took the prose at its word would conclude that the median sold price was $1.2 million in March, when the table says that is what sellers were asking. The Redfin and article figures show that the sold median was higher. This is the sort of slip that is easy to miss and that moves a number by tens of thousands of dollars.
The lesson for a seller is to read the table and not the sentence, and to ask what each figure counts. A seller who knows that the listing median was $1,199,000 in March and the sold median $1.3 million in April has a better picture than one who knows only that Green Hills is worth about $1.2 million. Readers comparing markets can also read the Franklin brief and the The Nations brief.
What should an owner ask, and what does a private sale change?
Ask which month and which window a number covers, and how many sales are behind it. Ask whether it is a mean or a median, a sold price or an asking price. Ask whether the boundary is the neighborhood or the postal area. A seller who has these answers can read a page, and a seller who does not will find that seven pages give seven answers.
A private sale changes how a home reaches a buyer. With Maison Off-Market there are no showings and no neighbors talking about a sale, the closing date can be flexible so that an owner has time to find a new home, there are no commission costs, there are no closing costs and there are no inspections or repairs. For a home that might sit among cancelled and expired luxury listings, avoiding a public run may matter most. This brief does not claim that a private sale always brings a higher price than a public listing.
Fee arithmetic shows what the commission point means in dollars, without assuming any rate. Each 1% of a sale price is $11,000 at $1,100,000, $13,000 at $1,300,000 and $13,850 at $1,385,000. At 3% those amounts are $33,000, $39,000 and $41,550. At 5% they are $55,000, $65,000 and $69,250. These are illustrations of what a percentage means on the figures in this brief, and they are not a statement of what any agent charges or what any sale would cost.
Privacy is often the first thing owners of larger homes raise. A public listing puts photographs, a price history and every price cut in front of anyone with a phone, and the buyer's guide says that 39.71% of listings have had at least one price drop. A private sale keeps those details out of view. That is a matter of preference and not a claim about price.
Timing is the other thing an owner controls. A public listing starts a clock that buyers can see, and the pages above show a range of 35 to 99 days. A private sale lets the owner choose the closing date, which matters most to people who need to find the next home first.
If you are weighing a sale of a Green Hills home, one conversation costs nothing and obliges you to nothing. We ask about the home, the timing you would like and what you would need from a buyer, and we say plainly whether a private sale fits.
If you would like a private, no-obligation offer for a Green Hills home, call 401-219-4207 or use the contact form on this site.
Methodology and limitations
Prices, days on market, counts and ratios come from Redfin's neighborhood page for the three months to July 2026, Realtor.com's neighborhood page with indicators as of March 2026, a brokerage article quoting Realtor.com's April snapshot, a market update dated April 29, 2026, a buyer's guide quoting figures from March to June 2026 and a local agent's blog current as of summer 2026. The pages cover different periods, boundaries and measures, and most are commercial pages, so they are not independent of each other.
Census figures come from the American Community Survey 2020-2024 five-year estimates for the postal area that includes Green Hills, through Census Reporter. The postal area is larger than the neighborhood. Percentages, gaps, ratios and fee amounts are this brief's own arithmetic and are labeled as such. Where a reading goes beyond what a page says, it is called an inference. No agent names, contact details or street addresses from the pages are reproduced.
Conclusion
The Green Hills record shows medians from $1.1 million to $1.385 million, changes from up 42.0% to down 5.4%, waits from 35 to 99 days, sale-to-list ratios from 95% to 97.6%, and active listings that average $2.27 million to $2.45 million. The numbers differ because the pages measure different things, cover different windows and boundaries, and in a small neighborhood a few sales can move any of them.
It does not fix a price for any one home. The choice between a public listing and a private sale comes down to whether an owner would rather meet showings, inspections and a public clock, or sell quietly on a date that suits them. Maison Off-Market speaks only to sellers, and a conversation costs nothing.
Frequently Asked Questions
What is the median home price in Green Hills, Nashville?
Pages differ. Redfin shows $1.3 million for the three months to July 2026, a buyer's guide about $1.1 million for March, a local blog $1.2 million for the three months to June and a rolling twelve-month median of $1,385,000.
Are Green Hills prices rising or falling?
Redfin shows the median up 42.0% on the year and a local blog up 13.6% for an earlier window. Realtor.com's median listing price is down 2.12%, and Zillow's value index is down 5.4%.
How long do homes take to sell in Green Hills?
Pages show 35 days for well-priced homes, 52 to 68 days on market and an average of 99 days from listing to closing.
Do Green Hills homes sell above asking price?
Redfin shows 7.6% of homes sold above list and a ratio of 97.1%. A buyer's guide shows 4.41% above list and a ratio of 95.91%.
What is the difference between a private sale and a public listing?
A private sale with Maison Off-Market has no showings, a flexible closing date, no commission costs, no closing costs and no inspections or repairs. A public listing exposes the home to a wider group of buyers. This brief does not claim either always gets a higher price.
Compare your options before committing. Request a written private offer for your property, with no obligation, then weigh it against your listing plan.
Sources
- Redfin, 2026. Green Hills, Nashville Housing Market. https://www.redfin.com/neighborhood/207762/TN/Nashville/Green-Hills/housing-market.
- Realtor.com, 2026. Green Hills Neighborhood of Nashville, TN Housing Market. https://www.realtor.com/local/market/tennessee/nashville/green-hills.
- Local brokerage, 2026. Selling a Home in Green Hills in a Shifting Market. https://urquhartrealtyco.com/blog/how-green-hills-sellers-can-navigate-a-shifting-market.
- Nashville Real Estate Now, 2026. Green Hills Market Update: Buyers Are Active, But They Are Selective. https://www.nashvillerealestatenow.com/blog/green-hills-market-update-buyers-are-active-but-they-are-selective/.
- Local brokerage, 2026. What Your Budget Actually Buys in Green Hills. https://oakleaf-realestate.com/blog/what-your-budget-actually-buys-in-green-hills-reading-past-the-37215-median.
- Local agent blog, 2026. Why Green Hills Home Prices Look Like They Are Rising and Falling at Once. https://heatherhamel.com/blog/why-green-hills-home-prices-look-like-theyre-rising-and-falling-at-the-same-time.
- U.S. Census Bureau, 2026. American Community Survey 2020-2024 five-year estimates, the Green Hills area (via Census Reporter). https://censusreporter.org/profiles/86000US37215-37215/.
Related research

Seller Guide · October 6, 2026
How to Prepare Point Pleasant Beach Rental Records Before Selling
Separate rental approval, income history and booked stays before comparing sale terms.

Seller Guide · October 6, 2026
How to Prepare Rumson Flood and Waterfront Records Before Selling
Separate flood disclosure, elevation, repairs and waterfront rights before comparing sale terms.

Seller Guide · October 6, 2026
How to Prepare Sarasota Condo Inspection and Reserve Records Before Selling
Separate building condition, reserve funding and resale documents before comparing sale terms.