Market Brief · by Aidan Sowa · October 5, 2026
Which Nations Median Sale Price Should an Owner Trust? Reading Redfin, Realtor.com and the Census Housing Stock of a Postal Area
Reading Redfin, Realtor.com and the Census Housing Stock of a Postal Area for The Nations, TN, with each source dated and its limits noted, for owners weighing a listing against a direct sale.
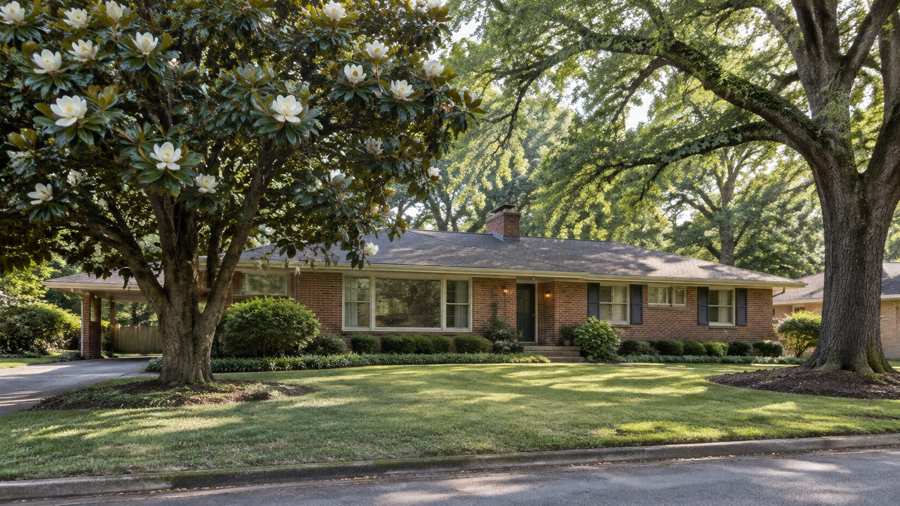
Is The Nations median $553,500 or $610,000? The two figures come from two pages about the same neighborhood, which both publishers label Urbandale Nations. Redfin's page shows a median sale price of $610,000 for March 2026, down 10.5% in a year. Realtor.com's page, with indicators as of August 2026, shows a median sold price of $553,500, down 11.74%, beside a median listing price of $669,975. The Redfin figure is 10.2% above the Realtor.com one, and the listing median is 21.0% above the sold median, computed here.
The gap is not a mistake by either publisher. The Redfin page is five months older and counts a single month of 56 sales, while the Realtor.com figure is a later month with its own sample. Realtor.com's page also calls the market cool in one sentence and a seller's market in the next, and says active listings are down 4.84% in its table and up 1.14% in its summary. Redfin shows homes selling for 97.5% of list, and Realtor.com shows about 99%. These are discounts of 1% to 2.5%.
Maison Off-Market speaks only to sellers. The Census postal area that includes The Nations, shared with a sibling post on Charlotte Park, has 22,000 housing units and 37,817 residents. This brief takes the structure, move-in and vacancy cuts: 35.0% of homes sit in buildings of five or more units, 55.1% of renter households moved in since 2020, and 8.9% of homes are vacant. The last section sets out what a private sale changes for an owner.
Key Findings
- Redfin's page for Urbandale Nations, for March 2026, showed a median sale price of $610,000, down 10.5%, $331 per square foot, down 3.1%, 56 homes sold against 48, 91 days on market against 98, a sale-to-list ratio of 97.5% and 14.3% of homes sold above list, up 10.1 points (Redfin, Urbandale Nations housing market).
- Realtor.com's page for Urbandale Nations, with indicators as of August 2026, showed a median listing price of $669,975, up 1.14%, a median sold price of $553,500, down 11.74%, $325 per square foot, 112 active listings, a median of 62 days on market and a median rent of $3,250 (Realtor.com, Urbandale Nations housing market).
- Redfin's page for the whole postal area, for August 2026, showed a median sale price of $618,732, down 0.2%, 233 homes sold, down 3.5%, a sale-to-list ratio of 97.3% and 35.5% of homes with price drops, down 6.1 points (Redfin, postal area housing market).
- Realtor.com's Nashville report for September 2026 showed a median list price of $534,000, down 1.0%, 62 days on market, up 5.1%, and 22.5% of listings with a price cut (Realtor.com, Nashville market report).
- The Census postal area that includes The Nations has 22,000 housing units, 35.0% in buildings of five or more units, 46.9% owner-occupied, a median household income of $81,423, a median rent of $1,708 and a median owner value of $529,800, plus or minus $31,578.
Why do the Nations medians differ so much?
Start with what each figure measures. Redfin's $610,000 is a median sale price across all home types for one month, March 2026, and it rests on 56 sales. Realtor.com's $553,500 is a sold median for August 2026, and its $669,975 is a listing median, which describes asking prices on homes still for sale. Redfin's page for the postal area gives $618,732 for the three months to August, and a Zillow value of $556,081 for the same postal area, an average of a model's estimates for all homes, was updated on May 31, 2026.
A listing median and a sold median should not match. Sellers ask for more than buyers pay, and the homes that are listed this month are not the homes that closed last month. A neighborhood with new houses on narrow lots, older cottages and townhouses mixes several price levels, and a median shifts when the mix of sales shifts. One more month of three large new homes can move it by tens of thousands of dollars.
Dates matter as much as sources. Realtor.com's own page for the postal area, as of June 2026, listed this neighborhood at a median listing price of $622,450 with 121 homes for sale and a median of 54 days on market. Its neighborhood page two months later showed $669,975, 112 homes and 62 days. That is a 7.6% rise in the listing median in two months, computed here, and a fall of nine homes for sale. Nobody should price a home from a single snapshot of any page.
The postal area gives a second reference. Realtor.com's page for the whole postal area, with indicators as of June 2026, showed a median sold price of $649,500, up 1.48%, a median listing price of $642,000 and 531 homes for sale, up 11.83%. The neighborhood's sold median of $553,500 is 14.8% below that figure, computed here from pages two months apart. The postal area includes pricier streets, and the same page lists a neighboring neighborhood at a median listing price of $1,299,999. A buyer sorting by postal area sees a blend, and an owner of one house is not selling a blend.
A seller can use the spread as a range of questions rather than a target. The sold figures run from $553,500 to $618,732, a spread of 11.8% across three pages, computed here, and none of them describes one house. The only price that counts is the one a buyer signs for, and a private buyer can offer on the house itself, without waiting for a median to move.
| Source | Figure | What it measures |
|---|---|---|
| Zillow | $556,081, down 2.3% | Average home value, postal area, May 2026 |
| Census Reporter | $529,800 | Median owner value, postal area |
| Realtor.com | $553,500, down 11.74% | Median sold price, Urbandale Nations, August 2026 |
| Redfin | $610,000, down 10.5% | Median sale price, Urbandale Nations, March 2026 |
| Redfin | $618,732, down 0.2% | Median sale price, postal area, three months to August 2026 |
| Realtor.com | $669,975, up 1.14% | Median listing price, Urbandale Nations, August 2026 |
Sources as cited. The dates, measures and areas differ and the figures are not directly comparable. Commercial content; not independently verified.
How long do homes in The Nations take to sell, and how big are the discounts?
The clock depends on the page. Redfin's neighborhood page shows 91 days on market in March 2026, down from 98 a year earlier, and says the average home sells for about 3% below list and goes pending in around 82 days. It adds that hot homes sell for around list price and go pending in about 40 days. Realtor.com's page shows 62 days for August 2026, down 3.70%.
Both pages agree on the shape of the discount. Redfin's sale-to-list ratio of 97.5% means the typical home closed 2.5% below its final list price, which on a $610,000 sale is about $15,250, and Realtor.com's 99% means a discount of 1%, or about $5,535 on $553,500, both computed here. The ratio compares the sale with the last asking price, so it hides earlier cuts. It does not show how far a home was reduced before it reached that figure.
The postal area adds context. Redfin's page for August 2026 shows a median of 65 days against 66 a year earlier, a sale-to-list ratio of 97.3%, 14.2% of homes sold above list, up 3.4 points, and 35.5% of homes with price drops. More than one home in three took a cut in a postal area where buyers can still outbid each other in some cases. That is a market with two speeds.
Competition scores point the same way. Redfin's neighborhood page gives a score of 42 out of 100, somewhat competitive, and its page for the postal area gives 47. The postal area's average home sells for about 3% below list and goes pending in around 63 days, and hot homes sell near list price in about 37 days. In the neighborhood the figures are about 82 days and about 40 days. The gap between hot homes and the average home is more than a month in both places, so the first weeks on the market decide a good deal of the outcome.
Nashville as a whole is slower than a year ago. Realtor.com's report for September 2026 shows active listings up 12.0% to 12,150, a median of 62 days up 5.1%, new listings down 2.4% and price cuts on 22.5% of listings, above the national 20.8%. That page says sellers need sharp pricing from the first day. Realtor.com's Nashville market report is about the city, not the neighborhood, and is used here as background.
Sources as cited. Ratios and dollar amounts in this section are computed from the published percentages.
What do per-foot prices and counts say about The Nations?
Prices per square foot are close on the two pages. Redfin shows $331, down 3.1%, for March and Realtor.com shows $325, down 2.94%, for August. The year-earlier values are about $342 and $335, computed here from the printed percentages. A fall of three percent in the price per foot, while the median sale price fell by ten or eleven percent, suggests that the homes that sold were also somewhat smaller, or on smaller lots. That is an inference.
Counts tell a different story. Redfin shows 56 sales in March 2026 against 48 a year earlier, up 16.7%, while Realtor.com shows 112 active listings in August. If sales ran at the March rate, 112 listings would be about two months of supply, computed here from two pages that are five months apart. The rate of sales in August is not on either page, so that figure only shows scale. It does not forecast anything.
Rents are soft. Realtor.com shows a median rent of $3,250 a month, down 3.70%, with 42 rentals, down 22.73%. The year-earlier rent is about $3,375, computed here. A rent that high beside a Census median of $1,708 for the whole postal area shows how far recent housing sits from the older stock, because the Census figure covers every renter, including long-time tenants.
The neighborhood is also not alone. Realtor.com's table for the postal area, as of June 2026, lists West Nashville at a median listing price of $734,450 and Charlotte Park at $712,000, beside this neighborhood at $622,450. A seller in The Nations is compared with those neighbors by buyers, whichever name is on the page.
Risk pages matter to buyers too. Redfin's page for the postal area says 1,513 properties, 26% of the total, face a severe flood risk over the next 30 years, and 1,601 properties, 22%, have some wildfire risk. It describes flood risk as rising more slowly than the national average. Those are model-based scores for the whole postal area and they say nothing about any one house. A seller whose home sits outside a flood zone may still hear the question from a buyer, and an inspection report can turn a score into a repair request.
Sources as cited. Year-earlier values are this brief's arithmetic from the printed percentages.
What do structures, move-in years and vacancy say about the postal area?
The Census postal area that includes The Nations has 22,000 housing units. Of them, 9,812 are detached houses, 44.6%, 2,519 are attached, 11.5%, 653 are in two-unit buildings, 3.0%, and 1,184 are in buildings of three or four units, 5.4%. Buildings of five to nine units hold 1,347 homes, 6.1%, ten to nineteen hold 1,982, 9.0%, twenty to forty-nine hold 991, 4.5%, and fifty or more hold 3,374, 15.3%. Another 138 are mobile homes, 0.6%.
Together, 7,694 homes, 35.0%, are in buildings of five or more units, and 14,168, 64.4%, are houses or buildings of up to four units. The median home was built in 1997, and 36.3% were built before 1980. The postal area also has a young layer of new construction, with 34.7% of homes built in 2010 or later. A seller of a detached house is not selling into the same market as a seller of a flat in a large building.
Tenure shows how new the people are. Of 9,408 owner households, 46.9% of all occupied homes, 23.1% moved in since 2020, 38.2% moved in during the 2010s and 20.9% moved in before 2000. Of 10,641 renter households, 55.1% moved in since 2020. The owners who have been in place since before 2000 are about one in five, and they hold the most equity in a neighborhood where, on these pages, the median sold price has changed by double digits in a year.
Vacancy is 8.9%, or 1,951 homes. Of those, 632 are for rent, 32.4%, 184 are for sale, 9.4%, 159 are sold and not yet occupied, 8.1%, 74 are for seasonal use, 3.8%, and 721 are vacant for other reasons, 37.0%. The other-reasons group is the largest, and the Census does not say why those homes are empty, so the figure is only a count. It is about 3.3% of all homes, computed here.
Income and cost sit in the same data. The Census median household income for the postal area is $81,423 and the median rent is $1,708 a month, or $20,496 a year, about 25.2% of that income, computed here. The median owner value of $529,800 is about 6.5 times the median household income, also computed here. The margin on the value is plus or minus $31,578, or about 6.0% of the estimate. These are five-year averages of survey answers from owners who estimate their own home values, and they trail the sold figures on the market pages. Readers comparing markets can also read the Green Hills brief and the Charlotte Park brief.
Source: Census Reporter, American Community Survey 2020-2024 five-year estimates, tables B25024, B25038, B25004, B25077, B25064 and B19013. Percentages and ratios are this brief's arithmetic.
What should an owner ask, and what does a private sale change?
The first question is which Nations. A new infill house, a small cottage and a townhouse do not share a median, a buyer or a clock, and the pages above describe every kind together. A seller should ask for closed sales within a mile of the same size and type in the past twelve months, with the days to contract, the first ask and the final price, and for the number of listings that ended without a sale.
The second question is what a figure measures and when. Ask whether it is a sold median, a listing median or a model value, which months it covers and how many sales sit behind it. A seller who reads $669,975 as the price will aim well above the sold medians, and a seller who reads a fall of 11.74% as the market may sell too cheaply. Redfin's three-month figures for the postal area are steadier, and they show a flat market.
Timing is the fifth question. A seller who must move for a job, a school year or a family change has a date, and a public listing has a clock that does not care about that date. Redfin's 91 days and Realtor.com's 62 days are medians, so half of the homes took longer. A seller who needs to be out by a fixed day and lists too late may accept a cut, and one who lists early may carry two housing costs. A private buyer can agree a closing date that fits the seller, and that flexibility is the second of the five benefits below.
The sixth question is who knows. In a neighborhood where 20.9% of owner households have lived in their homes since before 2000, neighbors know each other, and a sign in the yard becomes the topic of the block. Showings bring strangers to the door on a schedule set by buyers. Some owners do not mind, and some do. Maison Off-Market does not claim that every owner should avoid a public listing. It offers an owner who values quiet a way to sell without one.
The third question is the cost of selling, and the arithmetic is simple. Each 1% of $553,500 is $5,535. At 3% the figure is $16,605 and at 5% it is $27,675. At $610,000, each 1% is $6,100, 3% is $18,300 and 5% is $30,500. At $669,975, each 1% is $6,700, 3% is $20,099 and 5% is $33,499. These illustrate the size of each percentage point and are not quotes of any rate a seller would be charged. No page in this brief names a commission rate for The Nations, and the medians are not the price of any one home.
The fourth question is what a listing exposes. With a clock of about two to three months, discounts of 1% to 2.5% and more than a third of postal-area homes cutting the price, a public listing means a season of showings, open days and a visible price history. A private sale has no showings and no neighbors talking about a sale, which matters to an owner on a block where everyone knows which house is for sale.
The benefits are plain. Maison Off-Market buys luxury homes and estates directly from their owners and speaks only to sellers. A private sale has no showings. It allows closing dates that give a seller time to find a new home. It has no commission costs and no closing costs, and it avoids inspection repairs. The company does not say that a private sale always beats a public listing, and in a market where one page shows $553,500 and another $610,000, an owner is right to ask what each route yields. If you would like a private, no-obligation offer for a home in The Nations, call 401-219-4207 or use the contact form on this site.
Methodology and limitations
Each page's date, title and place were read before use. The Redfin neighborhood page is for March 2026 and is older than the others, and the Realtor.com neighborhood page contradicts itself on listing counts and on the label for the market. Only established data publishers and the Census are cited. The Census figures are five-year estimates for the postal area that includes The Nations. Percent changes were taken as printed, and ratios, sums and year-earlier values are this brief's arithmetic.
Conclusion
The record for The Nations shows sold medians of $553,500 and $610,000, a listing median of $669,975, homes selling 1% to 2.5% below list and a postal area where 35.0% of homes are in large buildings and 55.1% of renters moved in since 2020. The useful number for an owner is a closed sale of a similar home nearby, not a neighborhood median, and a private buyer can price the house in front of them.
Frequently Asked Questions
What is the median home price in The Nations?
Redfin shows a median sale price of $610,000 for March 2026, and Realtor.com shows a sold median of $553,500 and a listing median of $669,975 for August 2026. The pages label the area Urbandale Nations.
How long do homes take to sell in The Nations?
Redfin shows 91 days on market for March 2026 and Realtor.com shows 62 days for August 2026. The postal area shows 65 days on Redfin.
Do sellers in The Nations negotiate?
Yes. Redfin shows homes selling for 97.5% of list, and 35.5% of homes in the postal area had price drops in August 2026.
What does the Census say about homes in the postal area that includes The Nations?
There are 22,000 housing units, 35.0% in buildings of five or more units, a median build year of 1997, 46.9% owner-occupied and an 8.9% vacancy share.
Can I sell my home in The Nations privately?
Yes. Maison Off-Market buys luxury homes and estates directly from their owners with no showings, flexible closing dates, no commission costs, no closing costs and no inspections or repairs. Call 401-219-4207 or use the contact form.
Compare your options before committing. Request a written private offer for your property, with no obligation, then weigh it against your listing plan.
Sources
- Redfin, Urbandale Nations housing market, 2026. Urbandale Nations, TN Housing Market. https://www.redfin.com/neighborhood/208006/TN/Nashville/Urbandale-Nations/housing-market.
- Realtor.com, Urbandale Nations housing market, 2026. Urbandale Nations, Nashville Housing Market and Rental Trends. https://www.realtor.com/local/market/tennessee/nashville/urbandale-nations.
- Redfin, postal area housing market, 2026. Postal Area Housing Market: House Prices and Trends. https://www.redfin.com/zipcode/37209/housing-market.
- Realtor.com, Nashville market report, 2026. Nashville Buyers Have More Choices and More Negotiating Power. https://www.realtor.com/news/local/nashville-tn/real-estate-market-nashville-tn-september-2026/.
- Zillow, postal area home values, 2026. Nashville, TN Housing Market: 2026 Home Prices and Trends. https://www.zillow.com/home-values/74240/nashville-tn-37209/.
Related research

Seller Guide · October 6, 2026
How to Prepare Point Pleasant Beach Rental Records Before Selling
Separate rental approval, income history and booked stays before comparing sale terms.

Seller Guide · October 6, 2026
How to Prepare Rumson Flood and Waterfront Records Before Selling
Separate flood disclosure, elevation, repairs and waterfront rights before comparing sale terms.

Seller Guide · October 6, 2026
How to Prepare Sarasota Condo Inspection and Reserve Records Before Selling
Separate building condition, reserve funding and resale documents before comparing sale terms.