Market Brief · by Aidan Sowa · October 5, 2026
What Is a Franklin Home Worth? Reading Many Sources and Their Different Waits
Reading Many Sources and Their Different Waits for Franklin, TN, with each source dated and its limits noted, for owners weighing a listing against a direct sale.
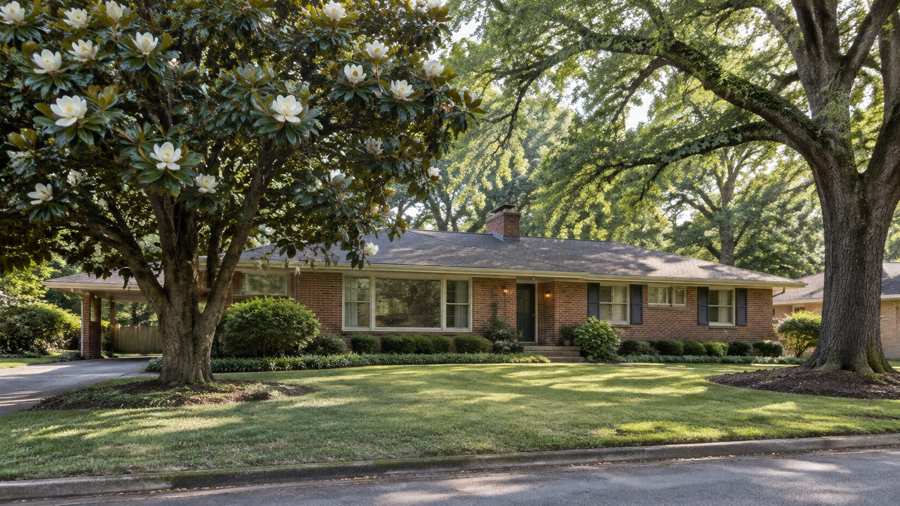
Is a Franklin home worth $850,000, $870,000, $990,000 or $1,058,000? Each is published for Franklin, Tennessee in 2026. The first is a median sale price on a June page, the second the median over three months on Redfin, the third the median sold price on an August page and the fourth a median over twelve months on a May page. The highest is 1.24 times the lowest, a gap of $208,000.
The waits are as far apart. One page says homes sell after a median of 14.5 days on market, another that they go pending in around 34, another that they sell in 47, and another that the median is 58. A fifth measures from listing to closing and gets 77. The closing counts do not agree either: one page's counts work out to about 142 sales a month and another's to about 172.
Maison Off-Market buys luxury homes and estates directly from their owners and speaks only to sellers. We do not estimate what any home is worth, and nothing here is a valuation. This brief sets the sources side by side, shows which numbers describe the same homes and which do not, and states what a percentage of a price is worth in dollars. Every figure is attributed, every calculation is this brief's own arithmetic and every inference is labeled as one.
Key Findings
- Redfin showed, for the three months ending July 2026, a median sale price of $870,000 (up 9.4%), a median of 47 days on market (47 a year earlier), a sale-to-list ratio of 98.2% and 15.0% of homes sold above list (Redfin, Franklin housing market).
- Realtor.com, with indicators as of August 2026, showed a median sold price of $990,000 (up 18.56% on the year), a median listing price of $1,181,258 (flat on the year), 1,299 active listings (up 9.58%) and a median of 58 days on market (Realtor.com, Franklin market data).
- Zillow showed an average home value of $925,870, up 2.6%, with homes going to pending in around 34 days, updated August 31, 2026 (Zillow, Franklin home values).
- A broker's market report, imported June 25 and updated September 7, 2026, counted 978 closings in six months at a median of $949,995, with a middle half of sales from $700,000 to $1.41 million, 6.1 months of supply and a Davidson County median of $475,000 (Grant Hammond, Franklin and Williamson County market pulse).
- A tracker counted 981 closings in six months at a median of $860,000 and $336 per square foot (Resideline, Franklin home sales).
- A May report counted 1,700 closed sales in twelve months, a median of $1,058,000 and a median of 14.5 days on market (Nashville Real Estate Now, Franklin market update).
- The Census shows a postal area that includes downtown Franklin with 67,513 residents, a median household income of $127,771, a median gross rent of $1,916 and 77.1% of occupied homes owner-occupied (Census Reporter, American Community Survey profile).
Which Franklin median is the right one?
The medians fall into three groups. At the low end are $850,000 from a June snapshot, $860,000 from the six-month closing tracker and $870,000 from Redfin. In the middle are $949,995 from the broker's six-month report and $990,000 from Realtor.com for August. At the top is $1,058,000 from a May report that covers twelve months and $1,097,450 for the most recent two months of that report.
The spread is large for a city that every page calls one market. The highest median is 1.24 times the lowest, and the Realtor.com figure is 1.16 times the June snapshot. The middle group is 9% to 14% above the low group. A seller who read only the lowest page would price about $208,000 under a seller who read only the highest.
Part of the gap is what is counted. The broker's page says Franklin spans three postal areas, and the six-month report counts 978 closings, which is almost the same count as the tracker's 981, yet the medians differ by $89,995. Two pages that count nearly the same number of homes report medians 10.5% apart, a ratio this brief computes from $949,995 and $860,000. The pages do not say what they exclude. Neither page says whether new construction is in, and Franklin has a large share of newer homes.
The same broker's single-family page shows a median of $1,060,000, up 9%, with an average of $1,344,673, up 16%. The average is 1.27 times the median, which shows how far the large sales pull the mean. Its middle half of all sales runs from $700,000 to $1.41 million, a range of $710,000, so that the median of any one of these pages describes only the center of a wide market.
The Zillow figure of $925,870 is a different kind of number. It is an index of estimated values for all homes, not a price anyone paid, and it sits 6.6% below Realtor.com's sold median of $990,000 and 9.0% above the $850,000 snapshot. The Realtor.com listing median of $1,181,258 is $191,258 above its own sold median, or 1.19 times. A seller pricing at the median listing and selling at the median sale gives up that gap, though the page does not say what any one home did.
| Source | Figure | What it measures |
|---|---|---|
| June snapshot | $850,000 | Median sale price, up 7.7% |
| Resideline | $860,000 | Median closing price, six months, 981 closings |
| Redfin | $870,000 | Median sale price, three months to July |
| Broker market report | $949,995 | Median closed price, six months, 978 closings |
| Realtor.com | $990,000 | Median sold price, August |
| Nashville Real Estate Now | $1,058,000 | Median sale price, twelve months, 1,700 closings |
| Zillow | $925,870 | Average home value index, August 31 |
Sources as cited. The measures differ and the figures are not directly comparable. Commercial content; not independently verified.
Does a Franklin home sell in 14 days, 34, 47 or 58?
The clocks run from 14.5 days to 58. The May report gives a median of 14.5 days on market over twelve months and 13 over the last two, an average of 34.5, and a median of 77 days from listing to closing. Zillow says homes go to pending in around 34 days. The broker's single-family page gives a list-to-contract time of 36 days. Redfin says 47, the same as a year earlier. Realtor.com says 58, down 3.45% on the year and up 36.59% over three years.
Part of the gap is the definition. A median of 14.5 days on market and a median of 77 days from list to close are measuring the same homes at different stages, and the difference is 62.5 days. The page does not say what the two clocks start and stop on, so the gap cannot be explained from the page. Part of the gap is the home type, since the broker's single-family page is a seller's market at 3.5 months of supply, while its whole-city page shows 6.1 months.
The sale-to-list ratios are more consistent. Redfin shows 98.2% with 15.0% of homes sold above list. Realtor.com shows 99%. The broker shows 98.7% for the city and 99.0% for single-family homes. The June snapshot shows 98.84% over twelve months on one source and 96.41% for April on another, which is the one outlier. A ratio near 98% to 99% means that sellers on average accepted about 1% to 2% under their list price, and the pages agree.
The two measures together make a seller's picture. Homes sell close to their price, and how long it takes depends on the page. Realtor.com's 58 days is 4.0 times the May report's 14.5. A home listed for 58 days that sold for 99% of its list price has been exposed to every buyer in the market for two months, and the pages do not say whether that mattered to the owner.
Supply gives another view. Realtor.com shows 1,299 active listings, up 9.58% on the year and 57.16% over three years. The broker shows 995 active in the city report and 584 for single-family. The June snapshot cites about 513 city-specific listings in May and 885 including nearby postal areas. The largest count is 2.5 times the smallest, which tells a seller that the number of competing homes depends on how far from Franklin the page looks.
How many homes close in Franklin each month?
The pages give counts that cannot all be right for the same homes. The May report counts 1,700 closings in twelve months, or 141.7 a month. The broker's page counts 978 in six months, or 163 a month. The tracker counts 981 in six months, or 163.5. Redfin gives 515 homes sold for the three months to July, which this brief reads as 171.7 a month, though the page labels the number as July. The June snapshot gives 346 sales in April, down from 388 a year earlier, and that is the highest monthly figure of all, 2.4 times the lowest pace.
The ranges suggest different universes. The May report appears to be one data feed, and the broker and the tracker appear to be another, since their counts are within 0.3% of each other. Redfin's number is labeled in a way that makes it hard to read. A seller should not compare a monthly median with a count from a different page and expect them to describe the same homes.
The county benchmark is the cleanest. The broker's report shows a Davidson County median of $475,000 over the same six months, against $949,995 in Franklin. Franklin's median is 2.0 times the county's. The pages explain it with land supply and schools, and the Census adds a reason of its own.
The Census postal area that includes downtown Franklin has 67,513 residents and 25,718 homes, of which 24,359 are occupied. Of the occupied homes, 18,770 (77.1%) are owner-occupied and 5,589 (22.9%) are rented. Vacancy is 5.3%. The median household income is $127,771 and the median gross rent is $1,916, which is 18.0% of the monthly income at the median, a ratio this brief computes. The median owner-occupied value is $735,100 with a margin of error of $26,986, which is below every market price in this brief because it counts all owners, including those who bought years ago.
The homes are new. Of 25,718, only 5,588 (21.7%) were built before 1980, while 6,748 were built in the 2010s and 962 since 2020, together 30.0%. The median year built is 1998. A market with so many new homes is a market of builders' prices, and a median that mixes new and resale homes will move when the mix moves. That is this brief's inference, since none of the pages splits the two.
Source: Census Reporter, American Community Survey 2020-2024 five-year estimates, tables B25034, B25077, B25003, B19013 and B25064. Percentages and ratios are this brief's arithmetic.
Is Franklin one market or several?
The broker's report breaks the six months of 978 closings into pieces, and the pieces do not look alike. By price band, 158 sales (16%) were under $600,000, 368 (38%) were from $600,000 to $1 million, 329 (34%) were from $1 million to $2 million, 80 (8%) were from $2 million to $3 million and 43 (4%) were above $3 million. The bands add to 978, which matches the headline. More than a third of the sales were over $1 million, and the median sits in the band just under it.
By postal area, the report gives three medians. The one that includes downtown Franklin carried 647 of the 978 sales, about two-thirds, at a median of $970,000 and $358 per square foot. A second carried 162 at $946,000 and $347, and the report says it holds the larger-acreage and estate parcels. A third carried 169 at $875,000 and $311, and the report says it leans to established subdivisions and townhomes. The counts add to 978. The highest median is 1.11 times the lowest, and the report says the postal area is a starting filter and not an answer.
By subdivision, the five busiest were mostly new construction. The largest closed 227 sales at a median of $1,387,240 and a median of 21 days on market. Another closed 81 at $834,660, and the report shows a median of zero days on market for it and for three others, which the page does not explain. The highest of the five medians is 1.66 times the lowest. A seller of an existing home may be competing with a builder that offers a rate buydown or a finish allowance, which the report says it counts when it prices a resale.
The report also compares Franklin with Brentwood and with the two counties. Franklin's six-month median of $949,995 compares with $1,320,000 in Brentwood on 461 closings, and the median price per square foot is $345 against $346. The same price per foot and a different median means a difference in size and lot and not in finish, according to the report. Williamson County shows a median of $915,000 on 2,424 closings and Davidson County $475,000 on 4,689. The Williamson figure is 1.93 times the Davidson figure.
What this means for a seller is that no single number is the Franklin price. A resale home in an established subdivision, an estate on acreage and a new house from a builder are in three different markets that happen to share a city name. The medians on the seven pages differ in part because their mixes differ, and that is this brief's reading and not a statement any page makes. The question to ask of any figure is which of these three homes it describes. A second question is whether the price paid included any builder incentive, because the pages report prices and not the terms behind them, and a rate buydown can change what a buyer is willing to pay for the house itself. Readers comparing markets can also read the Belmont brief and the Green Hills brief.
What should an owner ask, and what does a private sale change?
Ask which months a number covers and how many closings are behind it. Ask whether the figure is a median or an average, whether it covers houses or all homes and whether it includes new construction. Ask whether a wait runs to a pending date, a closing or a day on market. A seller who has these answers can read a page, and a seller who does not will find that seven pages give seven prices.
A private sale changes how a home reaches a buyer. With Maison Off-Market there are no showings and no neighbors talking about a sale, the closing date can be flexible so that an owner has time to find a new home, there are no commission costs, there are no closing costs and there are no inspections or repairs. For a seller in a market where the pages put the typical sale within a point or two of the list price, the saving on cost may matter as much as the price. This brief does not claim that a private sale always brings a higher price than a public listing.
Fee arithmetic shows what the commission point means in dollars, without assuming any rate. Each 1% of a sale price is $8,500 at $850,000, $9,900 at $990,000 and $10,580 at $1,058,000. At 3% those amounts are $25,500, $29,700 and $31,740. At 5% they are $42,500, $49,500 and $52,900. These are illustrations of what a percentage means on the figures in this brief, and they are not a statement of what any agent charges or what any sale would cost.
Privacy is often the first thing owners raise. A public listing puts photographs, a price history and the date of every price change in front of anyone with a phone, and the neighbors read them too. A private sale keeps those details out of view. That is a matter of preference and not a claim about price.
Timing is the other thing an owner controls. A public listing starts a clock that buyers can see, and the pages above show a range of 14.5 to 77 days. A private sale lets the owner choose the closing date, which matters most to people who need to find the next home first.
If you are weighing a sale of a Franklin home, one conversation costs nothing and obliges you to nothing. We ask about the home, the timing you would like and what you would need from a buyer, and we say plainly whether a private sale fits.
If you would like a private, no-obligation offer for a Franklin home, call 401-219-4207 or use the contact form on this site.
Methodology and limitations
Prices, days on market, counts and ratios come from Redfin's city page for the three months to July 2026, Realtor.com's city page with indicators as of August 2026, Zillow's page updated August 31, 2026, a broker's report imported June 25 and updated September 7, 2026, a closing tracker's page dated July 28, 2026, a June 5, 2026 snapshot and a May 17, 2026 market update. A real estate agent's page that repeats Redfin's figures was read and not relied on. The pages cover different periods and measures, and most are commercial pages, so they are not independent of each other.
Census figures come from the American Community Survey 2020-2024 five-year estimates for the postal area that includes downtown Franklin, through Census Reporter. The city spans three postal areas, so the figures describe part of Franklin only. Percentages, gaps, ratios and fee amounts are this brief's own arithmetic and are labeled as such. Where a reading goes beyond what a page says, it is called an inference. No agent names, contact details or street addresses from the pages are reproduced.
Conclusion
The Franklin record shows medians from $850,000 to $1,058,000, waits from 14.5 to 58 days, sale-to-list ratios near 98% to 99%, closing counts that imply between 142 and 346 sales a month and a median about twice its county's. The numbers differ because the pages measure different things, cover different months and in some cases count different homes.
It does not fix a price for any one home. The choice between a public listing and a private sale comes down to whether an owner would rather meet showings, inspections and a public clock, or sell quietly on a date that suits them. Maison Off-Market speaks only to sellers, and a conversation costs nothing.
Frequently Asked Questions
What is the median home price in Franklin, Tennessee?
Pages differ. Redfin shows $870,000 for the three months to July 2026, Realtor.com $990,000 for August, a broker $949,995 for six months and a May report $1,058,000 for twelve months.
How long do homes take to sell in Franklin?
Pages show 14.5 days on market, about 34 days to pending, 47 days and 58 days. The measures differ, and one measures 77 days from listing to closing.
How many homes sell in Franklin each month?
Counts imply about 142 to 172 a month on most pages and 346 for April on one. The pages do not say whether they count the same homes.
Do Franklin homes sell above asking price?
Redfin shows 15.0% of homes sold above list and a sale-to-list ratio of 98.2%. Realtor.com shows 99%. A broker shows 98.7%.
What is the difference between a private sale and a public listing?
A private sale with Maison Off-Market has no showings, a flexible closing date, no commission costs, no closing costs and no inspections or repairs. A public listing exposes the home to a wider group of buyers. This brief does not claim either always gets a higher price.
Compare your options before committing. Request a written private offer for your property, with no obligation, then weigh it against your listing plan.
Sources
- Redfin, 2026. Franklin Housing Market. https://www.redfin.com/city/7080/TN/Franklin/housing-market.
- Realtor.com, 2026. Franklin, TN Housing Market and Rental Trends. https://www.realtor.com/local/market/tennessee/williamson-county/franklin.
- Zillow, 2026. Franklin, TN Housing Market. https://www.zillow.com/home-values/45339/franklin-tn/.
- Grant Hammond, 2026. Franklin TN Home Prices: The Williamson County Market Pulse. https://www.granthammond.com/market-analysis/nashville-housing-market/franklin-williamson-county-market-pulse-june-2026/.
- Resideline, 2026. Franklin, TN Home Sales 2026. https://resideline.com/blog/franklin-tn-housing-market.
- Nashville Real Estate Now, 2026. Franklin TN Market Update, May 2026. https://www.nashvillerealestatenow.com/blog/franklin-tn-market-update-may-2026/.
- U.S. Census Bureau, 2026. American Community Survey 2020-2024 five-year estimates, the Franklin area (via Census Reporter). https://censusreporter.org/profiles/86000US37064-37064/.
Related research

Seller Guide · October 6, 2026
How to Prepare Point Pleasant Beach Rental Records Before Selling
Separate rental approval, income history and booked stays before comparing sale terms.

Seller Guide · October 6, 2026
How to Prepare Rumson Flood and Waterfront Records Before Selling
Separate flood disclosure, elevation, repairs and waterfront rights before comparing sale terms.

Seller Guide · October 6, 2026
How to Prepare Sarasota Condo Inspection and Reserve Records Before Selling
Separate building condition, reserve funding and resale documents before comparing sale terms.