Market Brief · by Aidan Sowa · October 5, 2026
What Is a Belmont Home Worth When Medians Are Months Apart? Reading a Median From April and a Median From August
Reading a Median From April and a Median From August for Belmont, TN, with each source dated and its limits noted, for owners weighing a listing against a direct sale.
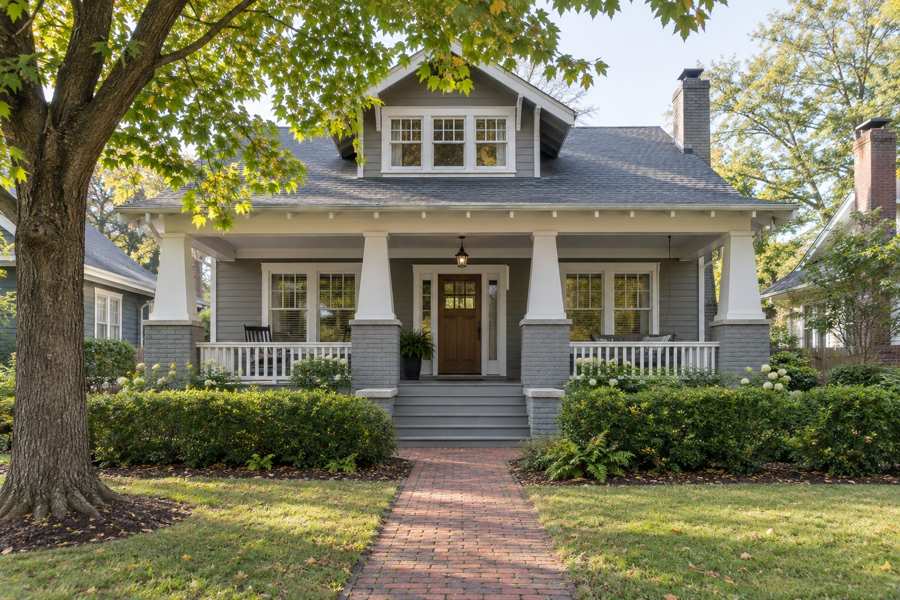
Belmont is the part of Nashville that grew up around a university and an old estate, and its housing shows it. A local brokerage page that tracks the Belmont-Hillsboro area counted 38 closed sales over twelve months to April 2026, found that 29 of them were built before 1950 and put the median sale price at $1,445,000. Realtor.com, for August 2026, puts the median sold price in the area it labels Bellmont - Hillsboro at $997,450, down 18.58% on the year.
The gap between the two medians is $447,550, or 45% of the lower. It is partly a matter of date, since one page ends in April and the other in August. It is partly a matter of method, since one is a twelve-month median of closed sales and the other a monthly figure. And it is partly the kind of sample, since a neighborhood with a few dozen sales a year has a median that moves with each house.
This brief reads the two pages side by side, adds the Census age and tenure figures for the postal area that includes Belmont and a Nashville series from Realtor.com, and asks what the figures say about an older neighborhood and its sellers. It values no home. It then sets out what a private sale changes for an owner who does not want to wait on a market like this.
Key Findings
- A local brokerage page, last updated April 2026, counted 38 closed sales in twelve months in Belmont-Hillsboro with a median sale price of $1,445,000, an average of $1,834,288, a median $502 per square foot, a median sale-to-list ratio of 96.6% and 13 of 38 sales at or above asking; 29 of the 38 homes were built before 1950 (Nashville Home Guru, Belmont-Hillsboro).
- Realtor.com, with indicators as of August 2026, showed a median listing price of $1,174,500, a median sold price of $997,450 (down 18.58%), $487 per square foot, 29 active listings, a median of 58 days on market, a sale-to-list ratio of 93% and a median rent of $2,800 a month (Realtor.com, Bellmont - Hillsboro).
- In the Census postal area, 1,521 of 8,016 housing units (19.0%) were built before 1950, 3,605 (45.0%) before 1980, and 3,200 of 7,322 occupied homes (43.7%) are rented (U.S. Census Bureau, 2020-2024).
- In the Nashville-Davidson-Murfreesboro-Franklin area the median days on market rose from 52 in May 2026 to 62 in September, and listings with a price reduction rose from 3,914 in April to 4,604 in August (Realtor.com, days on market; Realtor.com, price reduced listings).
- The Realtor.com page reports the year-over-year change in active listings as down 4.88% in its table and as up 8.33% in its summary text, so its own figures disagree on which way supply moved.
Why is the median $1,445,000 on one page and $997,450 on another?
Start with the dates. The local page says it was last updated in April 2026 and covers the twelve months before. The Realtor.com page gives indicators as of August 2026. Four months of sales sit between them, and if the market fell, the later page would show lower prices. Realtor.com reports that its median sold price is down 18.58% on the year, which is in the direction of the gap.
Then the measure. A twelve-month median of 38 sales is the average of the 19th and 20th when the sales are put in order. A monthly median is taken from the few homes that closed in that month, and in a neighborhood with 38 sales a year, a month may have three or four. A median of three homes is the price of one house.
Then the boundary. The local page says Belmont-Hillsboro is the historic core of the corridor that includes 12 South. Realtor.com spells the neighborhood Bellmont - Hillsboro and draws its own boundary. A street that is in one and not the other can carry a large share of the sales.
The local page also gives an average of $1,834,288, which is $389,288 above its median, or 27%. Its sales ranged from $575,000 to $5,064,050. A spread of that size says that the neighborhood has a few very expensive homes and many that cost much less, and a median reports only the middle. Neither page says what an owner's own home would sell for.
| Measure | Local brokerage page | Realtor.com |
|---|---|---|
| Median sale price | $1,445,000 | $997,450 (down 18.58%) |
| Price per square foot | $502 | $487 (up 19.54%) |
| Sale-to-list ratio | 96.6% | 93% |
| Homes sold or listed | 38 closed in 12 months | 29 active listings |
| Median days on market | Not stated | 58 |
Sources: Nashville Home Guru and Realtor.com pages as cited. The $447,550, 45%, $389,288 and 27% figures are this brief's arithmetic. Commercial content; not independently verified.
What does a sale-to-list ratio of 93 or 96.6 percent mean?
A sale-to-list ratio divides the price a home sold for by the price it was listed at. A ratio of 96.6% means that the median home sold for 3.4% below the asking price. On a home listed at $1.4 million, that is about $47,600. Realtor.com gives 93%, which is 7% below the asking price, and says that homes sold 6.66% below ask on average in August. On a $1.4 million home, 7% is $98,000.
The local page adds that 34% of its sales, 13 of 38, closed at or above asking, and that 23.7%, 9 of 38, had a price reduction. So about one home in three sold at the asking price or better, and nearly one in four was cut. Both facts can be true in a market where the median buyer paid less than the ask.
For a seller, the lesson is that the ask is not the price. A home listed at the median and sold at 93% to 96.6% of that has a seller who received less than the ask by several tens of thousands of dollars, and who paid a commission and closing costs from what was left. A seller who sets a high ask and cuts it has already told buyers how much the first price was worth.
None of the sources used here give the amount of a typical commission or of closing costs in Nashville, and I do not state one. The arithmetic above is only the gap between asking and selling prices.
The practical step for a seller is to ask any agent or buyer for the sales behind their number: the addresses, the dates, the sizes and the conditions. A figure that cannot be traced to specific homes is a guess, and a seller is entitled to know which.
Sources: Nashville Home Guru and Realtor.com pages as cited. The $47,600 and $98,000 figures are this brief's arithmetic for 3.4% and 7% of $1.4 million. Commercial content; not independently verified.
How much can a mean far above a median tell a seller?
The local page reports an average sale price of $1,834,288 beside a median of $1,445,000. When the average is well above the median, a few very expensive sales are pulling it up. Here, the page lists a range from $575,000 to $5,064,050, and three new homes sold at a median of $2,850,000. Those few sales raise the average by $389,288.
For an owner of a typical older house, the average is the wrong guide and the median is only a little better. A house of 1,500 square feet in need of work, a house of 3,000 square feet fully renovated and a new house of 5,000 square feet are three different products, and the neighborhood's figures mix them. At the page's own median of $502 a foot, a house of 1,500 square feet would be $753,000 and one of 3,000 would be $1,506,000, though, as the page itself shows, the foot price differs by group.
The better guide is a short list of sales of similar homes, close by, in the last few months, with the same size, age and condition. A brokerage can assemble such a list, and a buyer will do the same, which is why the buyer's offer and the seller's hope often differ. A seller who has seen the list is better placed to judge an offer.
A private buyer will do the same exercise. The difference is that the buyer decides once, from the home itself, and that no showing, no listing and no cut follow.
Source: Nashville Home Guru page as cited. The $753,000 and $1,506,000 figures are this brief's arithmetic ($502 times 1,500 and 3,000 square feet) and are illustrations, not valuations. Commercial content; not independently verified.
What does the Census say about old houses here?
The local page says that 29 of its 38 sales, 76%, were built before 1950, and that the median year built was 1930. The Census profile for the postal area that includes Belmont tells a different story. Of 8,016 housing units, 765 (9.5%) were built in 1939 or earlier and 756 (9.4%) in the 1940s, so 1,521, or 19.0%, predate 1950. The median year built is 1993.
The difference says something about what sells. A postal area with many newer townhouses and apartments counts them in the Census, but the homes that sell in a historic neighborhood are the old single-family houses. A home of the 1920s is far more likely to be sold in Belmont than the average home in the postal area is.
The Census also shows that 3,605 homes (45.0%) in the area were built before 1980 and 2,944 (36.7%) since 2010. Median household income is $109,580. Owners occupy 4,122 of 7,322 occupied homes (56.3%) and renters 3,200 (43.7%). Owners estimate the median home at $907,500, with a margin of error of $60,607.
The $907,500 sits between the two sale medians, $997,450 and $1,445,000, and below both. It is an estimate by owners in the whole postal area, and it describes a mixed stock of old and new, large and small homes.
| Indicator | Value | Note |
|---|---|---|
| Population | 16,469 | Whole postal area |
| Housing units | 8,016 | All units |
| Built before 1950 | 1,521 | 19.0% of all units |
| Built before 1980 | 3,605 | 45.0% of all units |
| Renter-occupied homes | 3,200 | 43.7% of occupied |
| Median household income | $109,580 | Estimate |
| Owner-estimated median value | $907,500 | Margin of error $60,607 |
| Median year built | 1993 | Estimate |
Source: U.S. Census Bureau, American Community Survey 2020-2024 five-year estimates; Nashville Home Guru as cited for the sales. The 76% and 19.0% figures are this brief's arithmetic.
What does it cost to sell a house built before 1950?
The local page reports that homes built before 1950 sold at a median of $1,400,000 and $550 per square foot, higher per foot than the other groups, which ranged from $404 to $510. Three homes built in 2020 or later sold for a median of $2,850,000. The page's sample is small, 29 old homes, 4 from the 2000s and 2010s and 3 new, so each group is a few sales.
Old homes sell at a premium in this neighborhood, according to that page, because buyers pay for the lot, the walk to the university and the architecture. The same age brings a list of items. A house of the 1920s or 1930s may have wiring, plumbing, a foundation and a roof of an earlier time, and any buyer's inspector will say so.
The sources used here do not give the cost of repairs in Nashville and I do not estimate it. The point is that a seller of an old house faces two choices when an inspection finds a long list: pay for repairs or give a credit. A buyer who purchases the house as is takes the third route, and it costs the seller nothing at closing.
The premium per foot also depends on condition. A renovated house sells at a higher figure than one in need of work, and the seller of the second has to decide whether the work is worth doing before listing, which means money spent and time spent before any offer.
Sources: Nashville Home Guru page as cited. The reasoning about inspections is this brief's and not a measured finding. Commercial content; not independently verified.
What does a median rent of $2,800 mean for an owner who might rent instead?
Realtor.com reports a median rent of $2,800 a month in the area, up 7.69% on the year, from 16 rental properties. A year of that rent is $33,600. Against a median sold price of $997,450, that is 3.4% a year before any cost, and against the local page's $1,445,000 it is 2.3%. The Census median rent for the whole postal area is $1,684, so the page's figure is 66% higher, as it describes homes listed for rent and not all leases.
The rent is low next to the price. An owner who keeps an older home to rent it pays for repairs, which on a home of the 1920s may be substantial, pays taxes and insurance, and takes on the work of finding tenants. The sources used here give none of those costs for Nashville, and I do not estimate them. The arithmetic shows only that a gross rent of 2.3% to 3.4% of the price is a thin start.
A university close by does supply tenants, and 43.7% of homes in the postal area are rented, so renting is common. But a landlord's income depends on a stream of tenants, repairs and months without a lease. For an owner who wants to be done with the house, a direct sale ends all of that on a date of the owner's choosing.
An owner who is not sure may do well to compare, in writing, the net from a sale with the net from renting for a few years, using real quotes for repairs, taxes and management. A private sale offer is one of the inputs to that comparison.
Sources: Realtor.com page, Nashville Home Guru and U.S. Census Bureau as cited. The $33,600, 3.4%, 2.3% and 66% figures are this brief's arithmetic. Commercial content; not independently verified.
Is supply up or down?
The Realtor.com page reports 29 active listings in Bellmont - Hillsboro. Its table says that is down 4.88% on the year and up 77.27% over three years. Its summary text says the count is up 8.33% on the year. Both appear on the same page, and they cannot both be right. I report the conflict and do not choose.
The local page counts 16 active listings in April, which would mean that supply rose from April to August if both are right, but the two pages may count homes differently, so that comparison is not safe.
The Nashville series gives the region's direction. Active listings rose from 11,374 in May to 12,150 in September, about 7% (Realtor.com, active listings). The median listing price was $539,900 in May and $533,995 in September (Realtor.com, median listing price). Median days on market rose from 52 to 62, or 19%. Listings with a price reduction rose from 3,914 to 4,604, or 18%, between April and August.
A region with more homes for sale, more cuts and a longer wait is a region where buyers have time. That does not say that Belmont behaves the same way. It says that a seller there lists into a market where the next buyer has options. Readers comparing markets can also read the 12 South brief and the Franklin brief.
Sources: Realtor.com page and series on FRED as cited, and Nashville Home Guru. The 7%, 19% and 18% figures are this brief's arithmetic. Commercial content; not independently verified.
What does a private sale change for an owner of an older home?
Privacy is the first change. A listing in a close neighborhood is read by neighbors and by anyone who follows a historic area, and the days on market, the cuts and the final price become public. A private sale involves no showings and no talk among neighbors about the sale.
A flexible closing date is the second. An owner who is moving to a new home, or who needs time to clear a house that has held a family for decades, can set the date. No commission and no closing costs are the third and fourth. On a home at $1 million, each 1% is $10,000, and I do not state a rate because none of the sources here gives one.
Avoiding inspections and repairs is the fifth, and it matters most for an older house. The buyer who takes the home as it is does not send an inspector to list the foundation, the wiring and the roof, and the seller does not have to price the list.
A public listing may still be the better route for a renovated home in a good location, where the page's figure of a third of sales at or above ask suggests that some buyers pay the full price. The pages above do not decide that. They show that the median buyer paid 3.4% to 7% less than the ask, that nearly one listing in four was cut and that the wait is long.
An owner who is weighing the two routes should also think about who is likely to be a buyer. In a historic neighborhood next to a university, buyers include families who want the walk to campus and the old streets, investors who want a rental near students, and builders who want the lot. Each of them values the same house differently. A family pays for the porch and the trees, an investor for the rent and a builder for the land. A listing invites all three and lets them compete. A private buyer is usually one of them, and the offer reflects what that buyer values. The owner can then judge it against what the home might fetch in a contest, with the cost and delay of the contest in view.
Whatever the route, keep the paperwork that a buyer will ask for: any permits for past work, the dates of the roof, the heating and the wiring, and any records of repairs. For a house of the 1920s or 1930s, a buyer who sees that history is less likely to ask for a deep discount, and a seller who has it ready can answer questions in a day instead of a week.
Sources: Nashville Home Guru and Realtor.com figures as cited. The $10,000 figure is this brief's arithmetic for 1% of $1 million. The reasoning about owners is this brief's and not a measured finding.
Methodology and limitations
Prices, sales counts, price per square foot, sale-to-list ratios, listing counts and rents for Belmont come from two commercial pages: a local brokerage's neighborhood page, last updated April 2026, and a national listing site with indicators as of August 2026. They cover different periods and boundaries and were not independently verified.
Age, tenure, vacancy, income, rent and owner-estimated value come from the American Community Survey 2020-2024 five-year estimates for the postal-code area that includes Belmont, which is larger than the neighborhood. Shares are calculated from published counts, and owner-estimated value carries a margin of error.
Days on market, active listings, median listing price and price reduced counts are Realtor.com series published by the Federal Reserve Bank of St. Louis for the Nashville-Davidson-Murfreesboro-Franklin metropolitan area. They describe the region and not the neighborhood. The brief makes no forecast and values no home.
Conclusion
The Belmont record shows two medians four months and $447,550 apart, a sample of 38 sales that are mostly pre-war houses, sale prices 3.4% to 7% below asking and a listing count that one page reports as both up and down.
It does not fix a price for any one home. The choice between a public listing and a private sale comes down to whether an owner would rather compete for a premium on an old house or take privacy, a flexible closing date, no commission, no closing costs and no inspections or repairs. To see what a direct offer would look like for your home, use the contact form on this page.
Frequently Asked Questions
What is the median home price in Belmont, Nashville?
A local brokerage page reports $1,445,000 for twelve months to April 2026, and Realtor.com reports a median sold price of $997,450 as of August.
Why do the two pages differ?
They cover different periods, use different boundaries and rest on small samples.
Do Belmont homes sell for less than the asking price?
The pages report sale-to-list ratios of 93% and 96.6%, and 34% of sales on one page closed at or above ask.
Are most Belmont homes old?
On the local page 29 of 38 sales were built before 1950, while the Census shows 19.0% of homes in the wider postal area built before 1950.
Does a private sale always beat a public listing?
No. A public listing can attract competing bids. A private sale offers privacy, a flexible closing date, no commission, no closing costs and no inspections or repairs.
Compare your options before committing. Request a written private offer for your property, with no obligation, then weigh it against your listing plan.
Sources
- Nashville Home Guru, 2026. Belmont-Hillsboro Nashville: Historic Homes and Market Data. https://nashvillehome.guru/belmont-hillsboro-real-estate/.
- Realtor.com, 2026. Bellmont - Hillsboro, Nashville housing and rental market. https://www.realtor.com/local/market/tennessee/nashville/bellmont-hillsboro.
- U.S. Census Bureau, 2026. American Community Survey 2020-2024 five-year estimates, the Belmont area (via Census Reporter). https://censusreporter.org/profiles/86000US37204-37204/.
- Realtor.com, 2026. Housing Inventory: Median Days on Market in Nashville-Davidson--Murfreesboro--Franklin, TN (CBSA). https://fred.stlouisfed.org/series/MEDDAYONMAR34980.
- Realtor.com, 2026. Housing Inventory: Price Reduced Count in Nashville-Davidson--Murfreesboro--Franklin, TN (CBSA). https://fred.stlouisfed.org/series/PRIREDCOU34980.
- Realtor.com, 2026. Housing Inventory: Active Listing Count in Nashville-Davidson--Murfreesboro--Franklin, TN (CBSA). https://fred.stlouisfed.org/series/ACTLISCOU34980.
- Realtor.com, 2026. Housing Inventory: Median Listing Price in Nashville-Davidson--Murfreesboro--Franklin, TN (CBSA). https://fred.stlouisfed.org/series/MEDLISPRI34980.
Related research

Seller Guide · October 6, 2026
How to Prepare Point Pleasant Beach Rental Records Before Selling
Separate rental approval, income history and booked stays before comparing sale terms.

Seller Guide · October 6, 2026
How to Prepare Rumson Flood and Waterfront Records Before Selling
Separate flood disclosure, elevation, repairs and waterfront rights before comparing sale terms.

Seller Guide · October 6, 2026
How to Prepare Sarasota Condo Inspection and Reserve Records Before Selling
Separate building condition, reserve funding and resale documents before comparing sale terms.