Market Brief · by Aidan Sowa · October 5, 2026
Is the Washington Park Market Rising or Falling When the Median and the Price per Foot Disagree? Reading the Median and the Price per Square Foot
Reading the Median and the Price per Square Foot for Washington Park, CO, with each source dated and its limits noted, for owners weighing a listing against a direct sale.
A neighborhood market can move in three directions at once. According to Redfin, the median sale price in Washington Park was about $1.8 million over the three months to August 2026, down 1.4% on the year, while the median price per square foot was $525, down 9.48%. Homes took 47 days to sell on average, against 34 a year earlier. The price is nearly flat, the price per foot has fallen almost ten percent, and the wait is longer.
They can all be true at once. If the homes that sold were larger than last year's, the median price holds while the price per foot falls. A seller who reads only the headline sees a stable market, and one who reads the per-foot number sees a softening one. The right reading depends on whether the house is the large kind or the small kind.
Two other sources add to the confusion. A local agent's comparison page gives a Washington Park median of $1,685,000 at $645 per square foot, and a listing portal reported a median sold price of $1,237,000 for June. This brief lays the three side by side with the Census profile of the postal area and the Denver metropolitan series, and it labels each source as commercial. It prices no house.
Key Findings
- Redfin reported a Washington Park median sale price of about $1.8 million for the three months to August 2026 (down 1.4%), a median price per square foot of $525 (down 9.48%), 47 days on market against 34 a year earlier, and 43 homes sold in August (Redfin, Washington Park).
- A local agent's comparison page dated August 13, 2026 gave a Washington Park median of $1,685,000, a price per square foot of $645 and average days on market near 32 (Rick Janson, Bonnie Brae versus Washington Park).
- A listing portal reported, as of June 2026, a median listing price of $1,895,000, a median sold price of $1,237,000 (up 15.07% on the year and down 31.28% over three years), $560 per square foot and 70 active listings (Realtor.com, Washington Park).
- In the Census postal area, 4,943 of 16,362 housing units (30.2%) were built before 1940, 10,015 (61.2%) before 1980, and renters occupy 7,850 of 15,251 occupied homes (51.5%) (U.S. Census Bureau, 2020-2024).
- The Denver-Aurora-Lakewood median days on market rose from 43 in May 2026 to 58 in September (Realtor.com, days on market).
Why can the price hold while the price per foot falls?
The price per square foot divides the sale price by the living area. If a market sells a few more large homes than in the previous year, the median price can stay level or even rise while the price per foot falls, because larger homes sell for less per foot. The reverse also works. If smaller homes dominate, the median price falls while the price per foot rises. A change in the mix changes one number much more than the other.
Redfin's figures show a price that fell 1.4% and a price per foot that fell 9.48%. The gap of eight points suggests that the typical home sold in the latest window was larger than the typical home a year earlier, or that prices fell more than the median shows, or both. The source does not say which, and nothing in the page lets a reader separate the two. It is a reason to be cautious about reading either figure alone.
For an owner, the useful move is to look at the per-foot number for homes like the one at hand. A 1,800 square foot bungalow and a 4,000 square foot new build in the same neighborhood are in different markets. The local agent's page puts the neighborhood at $645 per foot, Redfin at $525 and the listing portal at $560, which is a spread of more than $100 per foot between sources for one neighborhood. On a 2,000 square foot house that spread is over $200,000, and it is the reason that a figure from any one page should be treated as a range of opinion and not a value.
The 43 homes sold in August, equal to the 43 a year earlier, are the one steady number on the page. A flat count of sales together with a longer wait and a lower price per foot describes a market where the buyers are still there but are taking longer and paying less per foot. The word that fits is cooler, not weak.
The extra caution is warranted by the neighborhood's size. Forty-three sales a month is a modest sample for any median, and the Redfin page reports the same 43 in August of both years. When a count is that small and that stable, small changes in which houses are in it can account for most of a year-over-year change in the median, and that is a good reason to ask for the specific sales behind a number before relying on it.
| Source | Median price | Per square foot | Days | Note |
|---|---|---|---|---|
| Redfin, 3 months to August 2026 | About $1.8 million (sold) | $525 (down 9.48%) | 47 (34 a year earlier) | 43 sales in August |
| Local agent comparison page | $1,685,000 | $645 | About 32 (average) | Updated August 13, 2026 |
| Realtor.com neighborhood page, June 2026 | $1,237,000 (sold); $1,895,000 (listing) | $560 | Not shown here | 70 active listings |
Sources: Redfin, Rick Janson and Realtor.com neighborhood pages. Commercial content; not independently verified.
Why do three sources disagree by half a million dollars?
The three medians cover different periods, different property types and different definitions. Redfin's figure is for the three months to August and is described as a median sale price. The agent's page gives a working median without stating a window or sample, and it is a comparison page that appears to be written in a standard format for many neighborhoods. The portal figure is for a single month, June, and it is the one that is far lower, at $1,237,000, with a stated three-year change of minus 31.28% and a one-year change of plus 15.07%.
Those two percentages are a sign of a noisy series. A median that rises 15% in a year and has fallen 31% over three years is a median that swings with the mix of homes in a single month. With 43 sales in a month, the median is the twenty-second sale in the ranking, and a few more large homes in the mix move it by hundreds of thousands. The portal also reports 70 active homes and a median listing price of $1,895,000 up 6.54% on the year, which is 53% above its sold median. As in other expensive neighborhoods, the homes on the market are priced above those that sell.
What a seller should take from the disagreement is a range. On these three sources, the typical sold price runs from about $1.24 million to about $1.82 million, and neither end describes a particular house. Price per foot, $525 to $645, gives a second range, and both are wide.
The right use of the figures is to learn which questions to ask. Which homes sold, how large were they, how old, how renovated, and on what blocks? Those are answers a recorded-sales comparison gives for a specific house, and none of the pages used here gives them.
It is worth noting that the agent's comparison page is the only one of the three that presents both Washington Park and Bonnie Brae in the same format, with the same fields, and its figures come out at $1,685,000 and $1,485,000. A page built to a single template across neighborhoods is useful for rough comparison and less useful for a decision about one house, since the template does not say what sample sits behind each figure.
Sources: Redfin, Rick Janson and Realtor.com neighborhood pages. The 53% figure is this brief's arithmetic ($1,895,000 against $1,237,000). Commercial content; not independently verified.
What does a pre-1940 house mean when it comes time to sell?
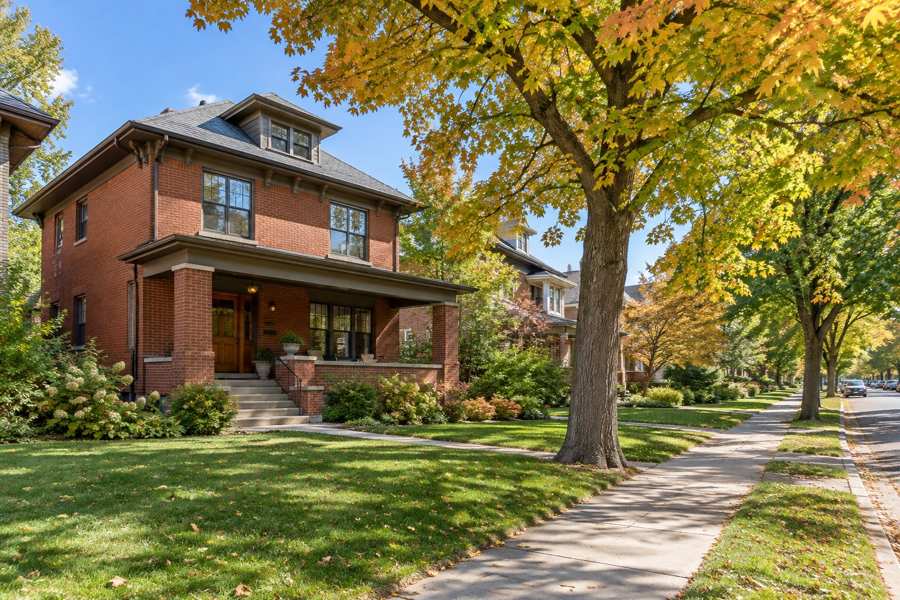
About three in ten homes in the postal area, 4,943 of them, were built in 1939 or earlier. In Denver these are the bungalows, the Denver Squares and the Tudor cottages that give the neighborhood its character, and the character is what many buyers pay for. It is also what an inspector reads closely. A house of that age has often had its wiring, plumbing and heating replaced in stages, and the stages show. Knob and tube wiring, galvanized pipe, clay sewer lines and old roofs are the usual items in a report.
A seller of such a house faces a pattern that does not depend on the market. A buyer who loves the house sends an inspector. The inspector produces a list. The buyer asks for a price reduction or credits for the list. With a long wait and one offer on the table, the seller has little room to say no. The list can cost real money, and the sources used here give no figure for it. The seller's alternatives are to fix things before listing or to accept the reduction.
Pre-sale repairs have their own risks. A kitchen that is renovated for a sale reflects the seller's taste, which the buyer may not share. A repair that is done quickly may itself be marked in an inspection. For many owners, the best answer is to sell to a buyer who purchases as is, who sets a price that takes the condition into account and who does not return with a list after the contract is signed.
The age data show a second group of owners. The 2,814 homes built in the 2010s and the 443 since 2020 together make up about a fifth of the area's stock. They have few inspection issues, but they face a different question, which is whether a buyer will pay the premium for new construction in a market where the price per foot is falling. For that group, the main benefits of a private sale are privacy and a flexible closing date.
No source used here reports prices by year built, and the brief does not claim any difference between the two groups. The point is only that the neighborhood contains two kinds of home, and the way each one sells is different.
Source: U.S. Census Bureau, American Community Survey 2020-2024, table B25034. The description of typical inspection findings is general knowledge of older construction and not a figure from any source here.
What does a 1900s neighborhood look like in the Census?
The Census profile covers the postal area that includes Washington Park and neighboring blocks. It counts 27,564 people and 16,362 housing units, of which 15,251 are occupied and 1,111 (6.8%) are not. Owners live in 7,401 homes (48.5%) and renters in 7,850 (51.5%). Median household income is $125,733 and median gross rent is $2,031 a month.
The age profile is unusual for a metropolitan area in the West. The largest group, 4,943 homes (30.2%), was built in 1939 or earlier, and 61.2% were built before 1980. At the same time, 2,814 homes (17.2%) were built in the 2010s and 443 (2.7%) since 2020. The neighborhood has both a historic core and a wave of new construction, and in many cases the new homes replaced old ones. The area's median year built is 1968, which sits between the two.
Owners estimate the median home at $1,018,300 with a margin of error of $65,096, or 6.4%. That is well below any of the sold medians above, because the postal area includes many apartments and condominiums, and because owners tend to estimate conservatively. It also tells a seller that a house in the neighborhood core competes with a much more expensive group than the area as a whole.
The tenure mix matters too. A neighborhood in which half the homes are rented has a large pool of tenants who may become buyers, and a large pool of investors who may buy. For a seller, that means more kinds of buyers can be reached. It also means that some buyers will value a property as a rental or a redevelopment site and not as a home.
Taken together, the neighborhood's older and newer homes are the reason that its medians are less useful than they look. A median that blends a 1915 bungalow with a 2019 new build describes neither, and the two are sold to different buyers by different routes. The first question for a seller is therefore which of the two kinds of home theirs is, and the second is what the nearest recorded sales of that kind were.
| Indicator | Value | Note |
|---|---|---|
| Population | 27,564 | Whole postal area |
| Housing units | 16,362 | All units |
| Owner-occupied homes | 7,401 | 48.5% of occupied |
| Renter-occupied homes | 7,850 | 51.5% of occupied |
| No usual resident | 1,111 | 6.8% of all units |
| Built 1939 or earlier | 4,943 | 30.2% of units |
| Median household income | $125,733 | Estimate |
| Median gross rent | $2,031 | Monthly |
| Owner-estimated median value | $1,018,300 | Margin of error $65,096 |
Source: U.S. Census Bureau, American Community Survey 2020-2024 five-year estimates.
How should an owner read a falling price per foot?
A falling price per foot is a warning about the market that is easy to misread. It can mean that the market has weakened, as it appears to have done on Redfin's numbers. It can mean that larger homes are selling more often. It can also mean that renovated and new homes, which sell at a higher price per foot, made up a smaller part of the sales. A seller needs to know which of these is happening for houses of the same kind as theirs.
One way to find out is to ask for a list of recent sales that match the house on size, age, lot and condition, with the sale price, the original ask and the days on the market for each. Such a list shows whether the sold price was close to the first price, which is a sign of strength, or well below it, which is a sign of weakness. The pages used here give none of those figures at the neighborhood level, so the list has to come from a recorded-sales source.
A second way is to watch the clock. The change from 34 to 47 days on market is the more direct sign that buyers have more time. A home that would have sold in five weeks now sells in seven, and a home that was in the slower half before is in a slower half now. A seller with a plan that depends on a quick sale feels this sooner than the median shows.
The honest conclusion is that a price that is flat, a price per foot that is falling and a wait that is longer are three views of one market, and they are consistent with a market that has cooled since last year. They do not say that any individual house has lost 9.5% of its value.
For a seller who is deciding whether to list publicly, the cost of waiting is the other thing to weigh. Each added week costs carrying costs, such as taxes, insurance, utilities and upkeep, and also costs the seller's plans for the next home. A direct sale avoids that cost at the price of a single offer.
Source: Redfin, Washington Park neighborhood page, as quoted. The interpretation of the price per foot is this brief's reasoning and not a measured finding.
What does the Denver clock say?
Realtor.com's metropolitan series, published by the Federal Reserve Bank of St. Louis, show the Denver-Aurora-Lakewood area slowing. The median days on market was 43 in May 2026, 48 in June, 51 in July, 57 in August and 58 in September. Active listings climbed from 9,144 in March to 12,813 in July (Realtor.com, active listings), while new listings fell from 5,876 in May to 4,596 in July (Realtor.com, new listings).
The median listing price drifted from $589,000 in May to $569,900 in September (Realtor.com, median listing price), and the count of listings with a price reduction grew from 5,528 in May to 6,848 in September (Realtor.com, price reduced listings). Those are counts and not shares, and the number of listings also rose, so they do not show that more of the market cut prices. They do show more homes sitting on the market with a reduced ask.
The neighborhood's 47 days is below the metropolitan 58, and this is expected in a close-in neighborhood with strong demand. But the direction is the same: a longer wait and more inventory than in spring.
None of these series describe Washington Park, and the Denver median listing price is less than a third of the neighborhood's. They show that the tide in 2026 is moving toward buyers. Readers comparing markets can also read the University brief and the Bonnie Brae brief.
Source: Realtor.com via FRED, Housing Inventory series for Denver-Aurora-Lakewood, CO (CBSA).
What would a private sale change for a Washington Park owner?
A direct sale to a buyer who purchases homes off the market changes five things for a seller. There are no showings and no neighbors talking about you selling, which matters on blocks where the yard sign is the news of the week. The closing date can be flexible, giving time to find a new home. There are no commission costs and no closing costs for the seller. And there are no inspections or repairs, which on a house built before 1940 can be a long list.
The fee benefit requires no assumed rate. For every 1% of a sale price that would otherwise go to fees, a sale at $1,237,000 keeps $12,370, a sale at $1,685,000 keeps $16,850 and a sale at $1,824,120 keeps $18,241. An owner can apply whatever percentage is in a listing agreement and compare net proceeds.
A flexible closing date is useful in a market where the wait has grown from 34 days to 47. A public sale commits the owner to a process whose length is not known, and a private sale sets the date up front.
The trade-off is the usual one. A public listing can bring several buyers and a bidding contest, particularly for a well-presented house on a good block. A private sale offers privacy, a settled date and no repairs. The owner decides.
There is also the matter of what a seller learns by asking. An owner who requests a private offer learns a real number from a real buyer in a few days, and that number is a useful data point whether or not the owner accepts. Set against the spread between the three published medians, a number tied to the actual house is worth more than any of them. It also costs nothing to compare against a public listing later, since a private offer involves no showings, no public history of a failed listing and no days on market added to the property's history.
Source: calculation from stated prices; no commission rate, closing cost or repair cost is assumed.
Methodology and limitations
Prices, price per square foot, days on market, sales counts and listing counts for Washington Park come from three commercial pages, a national brokerage site, a local agent's comparison page and a listing portal. They were not independently verified, they cover different windows and definitions, and the brief reports them side by side for that reason.
Age, tenure, vacancy, income, rent, population and owner-estimated value come from the American Community Survey 2020-2024 five-year estimates for the postal-code area that includes Washington Park. The area is wider than the neighborhood. Shares are calculated from published counts, and owner-estimated value carries a stated margin of error.
Days on market, active and new listings, median listing price and price reduced counts are Realtor.com series published by the Federal Reserve Bank of St. Louis for the Denver-Aurora-Lakewood metropolitan area. The brief makes no forecast and does not estimate what any particular home would sell for.
Conclusion
The Washington Park record shows a neighborhood that is cooling slowly. The price is flat, the price per foot is down, the wait has grown by 13 days, and three sources that cover the same ground give medians half a million dollars apart.
It does not fix a price for any one home. The choice between a public listing and a private sale comes down to whether an owner values the chance of competing bids more than privacy, a flexible closing date, no commission, no closing costs and no inspections or repairs.
Frequently Asked Questions
What is the median home price in Washington Park?
Sources disagree. Redfin reports about $1.8 million for three months to August 2026, a local agent page $1,685,000 and a listing portal $1,237,000 for June.
Why is the price per square foot falling faster than the price?
A change in the mix of homes sold can do this, and the sources do not say which homes sold.
How long do Washington Park homes take to sell?
Redfin reports 47 days against 34 a year earlier.
Does the Denver metropolitan data describe Washington Park?
No. It covers a metropolitan area and shows direction only.
Does a private sale always beat a public listing?
No. A public listing can attract competing bids. A private sale offers privacy, a flexible closing date, no commission, no closing costs and no inspections or repairs.
Compare your options before committing. Request a written private offer for your property, with no obligation, then weigh it against your listing plan.
Sources
- Redfin, 2026. Washington Park, Denver Housing Market. https://www.redfin.com/neighborhood/120530/CO/Denver/Washington-Park/housing-market.
- Rick Janson, 2026. Bonnie Brae versus Washington Park. https://www.rickjanson.com/compare/bonnie-brae-vs-washington-park/.
- Realtor.com, 2026. Washington Park Neighborhood Housing Market. https://www.realtor.com/local/market/colorado/denver/washington-park.
- U.S. Census Bureau, 2026. American Community Survey 2020-2024 five-year estimates, the Washington Park area (via Census Reporter). https://censusreporter.org/profiles/86000US80209-80209/.
- Realtor.com, 2026. Housing Inventory: Median Days on Market in Denver-Aurora-Lakewood, CO (CBSA). https://fred.stlouisfed.org/series/MEDDAYONMAR19740.
- Realtor.com, 2026. Housing Inventory: Active Listing Count in Denver-Aurora-Lakewood, CO (CBSA). https://fred.stlouisfed.org/series/ACTLISCOU19740.
- Realtor.com, 2026. Housing Inventory: New Listing Count in Denver-Aurora-Lakewood, CO (CBSA). https://fred.stlouisfed.org/series/NEWLISCOU19740.
- Realtor.com, 2026. Housing Inventory: Median Listing Price in Denver-Aurora-Lakewood, CO (CBSA). https://fred.stlouisfed.org/series/MEDLISPRI19740.
- Realtor.com, 2026. Housing Inventory: Price Reduced Count in Denver-Aurora-Lakewood, CO (CBSA). https://fred.stlouisfed.org/series/PRIREDCOU19740.
Related research

Seller Guide · October 6, 2026
How to Prepare Point Pleasant Beach Rental Records Before Selling
Separate rental approval, income history and booked stays before comparing sale terms.

Seller Guide · October 6, 2026
How to Prepare Rumson Flood and Waterfront Records Before Selling
Separate flood disclosure, elevation, repairs and waterfront rights before comparing sale terms.

Seller Guide · October 6, 2026
How to Prepare Sarasota Condo Inspection and Reserve Records Before Selling
Separate building condition, reserve funding and resale documents before comparing sale terms.