Market Brief · by Aidan Sowa · October 5, 2026
Does a Home Near the DU Campus Sell to Families or to the Campus? Reading the Owner Share, the Walk Score and the Clock
Reading the Owner Share, the Walk Score and the Clock for University, CO, with each source dated and its limits noted, for owners weighing a listing against a direct sale.
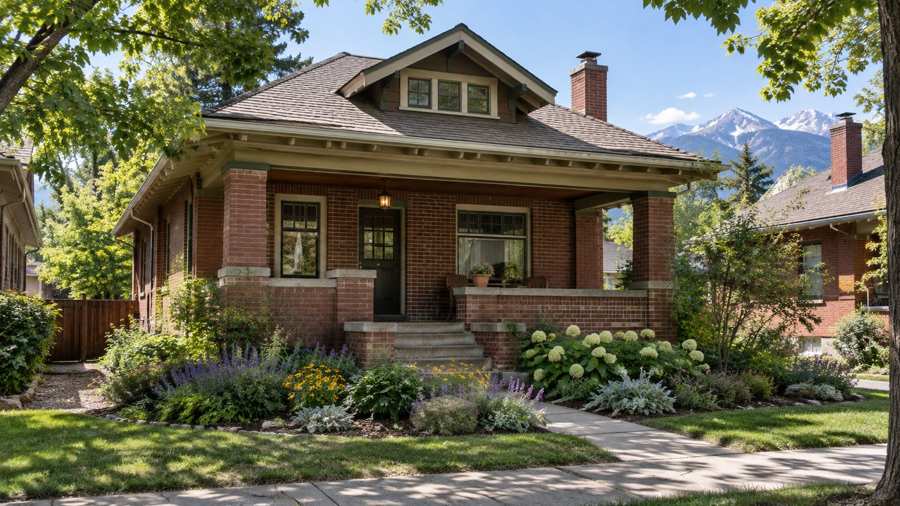
A seller in the University neighborhood of Denver lives next to a university, and that colors who buys. A local guide published in July 2026 describes a walkable pocket between the University of Denver campus to the west and Washington Park a short bike ride to the east, with older brick homes, recently renovated places and new homes built between them. It also says that just over half of homes there are owner-occupied, 52%, which is lower than most of Denver's more residential neighborhoods (a Denver brokerage guide, July 18, 2026).
This brief takes that description and checks it against what the public record can show. It covers the owner share and income in the Census postal area that holds the neighborhood, the guide's price and speed figures, the walk and bike scores, and the Denver metropolitan listing series for days on market, new listings and asking prices. It then asks what a private direct sale changes for an owner who does not want to market a house to a changing mix of buyers.
The limits are plain. The Census figures describe a postal area that also holds Platt Park and other districts, the guide is brokerage marketing, and the Denver series cover a multi-county region. The brief says where each limit applies.
Key Findings
- The guide puts the typical University home at a list price near $799,000, or $447 a square foot, with higher-end homes near $1,044,000, and says homes sell in about 38 days against 44 for Denver in July 2026.
- It reports a Walk Score of 75, a Bike Score of 86 and a Transit Score of 36, with the East Harvard Gulch Trail running 0.79 miles through the neighborhood.
- In the postal area around the neighborhood, 9,938 of 17,713 occupied homes (56.1%) are owner-occupied and 7,775 (43.9%) are rented, and median household income is $127,270 (U.S. Census Bureau, 2020-2024).
- The Denver metropolitan median listing price fell from $589,000 in May 2026 to $569,900 in September, a decline of 3.2% (Realtor.com, median listing price).
- The Denver metropolitan median days on market rose from 43 in May to 58 in September, an increase of 15 days (Realtor.com, days on market).
What kind of neighborhood is University?
The July 2026 guide places University on Denver's south side, between the University of Denver campus and Washington Park, with the East Harvard Gulch Trail running through it. It gives a Walk Score of 75, which the scoring service calls very walkable, and a Bike Score of 86, very bikeable. The Transit Score of 36 is the weak spot: the guide says that people who depend on buses or light rail will notice the difference, and that most residents drive or bike.
It describes the housing as a real mix of styles. Walk a block, it says, and you might pass a well-maintained original, something gut-renovated and something brand new. The blocks feel more settled than the campus edge itself, with tree-lined streets, single-family homes and smaller multi-unit buildings nearer the university.
The neighborhood has three small parks, according to the guide: De Boer Park at about 5.6 acres, Dan's Garden at about 2.2 acres and Harvard Gulch Mini Park at about 1.1 acres, plus 24 restaurants, bars and cafes. It names several favorites, and notes that Washington Park's retail and dining strip is a short bike ride away.
The assigned public schools, the guide says, are University Park Elementary, Merrill Middle School and South High School, and it advises checking the address with the district's choice system because many areas fall in shared enrollment zones. These are the guide's statements, drawn from the sources it lists, and they were not re-checked here.
Who owns the homes, and who rents them?
The guide says that just over half of homes in the neighborhood are owner-occupied, 52%, lower than most of Denver's more residential districts, which it attributes to the campus and its apartments. It reports a median household income of $109,035 and says most households have one or two people.
The Census postal area that includes the neighborhood tells a similar story at a wider scale. It counts 18,856 housing units, 17,713 of them occupied, with 9,938 (56.1%) occupied by their owners and 7,775 (43.9%) rented. Only 1,143 units, 6.1%, have no usual resident, so the area is lived in year-round. The area is larger than University, so its 56.1% owner share is higher than the guide's 52% for the neighborhood alone, which is consistent with the guide's point that the campus edge pulls the share down.
Median household income in the postal area is $127,270, higher than the guide's figure for the neighborhood, and median gross rent is $1,996 a month. A renter paying the median spends $23,952 a year, 18.8% of the median income. Population in the postal area is 39,113.
For a seller, a high share of renters shapes the buyer pool in two ways. Some buyers are investors who see a rental near a university and value the house for its income. Others are families who value the school and park access and would live in it. The two groups value different features: investors count bedrooms and rent, and families count yards and quiet. A listing that appeals to one may not appeal to the other.
| Indicator | Value | Note |
|---|---|---|
| Population | 39,113 | Whole postal area |
| Housing units | 18,856 | All units |
| Owner-occupied homes | 9,938 | 56.1% of occupied homes |
| Renter-occupied homes | 7,775 | 43.9% of occupied homes |
| Units with no usual resident | 1,143 | 6.1% of all units |
| Median household income | $127,270 | Postal area |
| Median gross rent | $1,996 a month | 18.8% of median income |
Source: U.S. Census Bureau, American Community Survey 2020-2024 five-year estimates, tables B01003, B19013, B25003 and B25064.
What does a typical home cost, and how fast does it sell?
The guide says a typical University home lists around $799,000, at $447 a square foot, with higher-end homes around $1,044,000. That puts the neighborhood above the Denver-wide median list price of $589,000, which the guide takes from the same Federal Reserve data used below, and just below the single-family median of $825,000 across Denver. In the guide's words, you get real walkability and easy access to Washington Park without paying Cherry Creek prices.
It also says homes were selling in about 38 days, a little faster than Denver's 44-day pace, citing listing data from July 2026. A comparison of a neighborhood-level figure with a metropolitan one invites caution, since the two are computed differently, but the direction is clear enough: homes in the neighborhood were reported to sell somewhat faster than the typical Denver home in July.
The Census owner estimate for the wider postal area is $910,200, with a margin of error of $18,989, about 2.1%. It is higher than the guide's typical list price of $799,000, which is not a contradiction. One is what owners believe their homes would fetch, across a postal area that includes several districts, and the other is a list price for homes on the market in the neighborhood in July.
None of these figures is a price for a specific house. A well-kept brick house with a yard and a renovated kitchen belongs in one range, and a duplex near the campus in another.
Source: a Denver brokerage guide published July 18, 2026, which cites listing data and Federal Reserve data; the underlying data were not independently re-pulled for the neighborhood. Census figures from the American Community Survey 2020-2024 table B25077.
Has the Denver clock moved since July?
The guide's 38-day figure is for July. The Denver metropolitan series from Realtor.com show what happened over a longer period. The median days on market was 43 in May 2026, 48 in June, 51 in July, 57 in August and 58 in September, a rise of 15 days, or 34.9%, from May to September. The metropolitan figure for July, 51, is above the guide's Denver figure of 44 for the same month, which shows that the two sources define the figure differently, and it is a reminder not to mix them.
New listings fell during the same months. The metropolitan area added 5,664 in April, 5,876 in May, 5,392 in June and 4,596 in July (Realtor.com, new listings). July is 21.8% below the May peak. Seasonal patterns explain part of the drop, and the series stops in July in the data used.
Asking prices eased. The median listing price was $589,000 in May and June, $579,798 in July, $574,900 in August and $569,900 in September, a decline of 3.2% from May. That is a metropolitan median that covers every kind of property, including condominiums and new apartments, and it sits far below University's typical list price. It shows direction and not level.
For a seller, the direction is the point. Homes across the region are taking longer to sell and asking prices are softening a little. The neighborhood's July speed may have held, or it may not have, and the data here cannot say.
Source: Realtor.com via FRED, Housing Inventory: Median Days on Market, New Listing Count and Median Listing Price, Denver-Aurora-Lakewood, CO (CBSA).
What does a mixed block do to pricing?
The guide says that on a single block in University, one might pass an original home in good repair, a gut renovation and a new build. For pricing, that mix matters more than the neighborhood average. The three houses will not sell for the same price per square foot, and a buyer who sees all three on one walk will compare them.
A seller of the original has an awkward position. Buyers who want a finished house will compare it with the renovation and the new build and ask for a discount for the work they would have to do. Buyers who want a project will compare it with other projects, and ask what can be built on the lot. The seller's house is therefore competing on two fronts, with different groups of buyers on each.
The guide mentions smaller multi-unit buildings nearer the university. A house that sits near them has a different value as a rental and as a home. A buyer who plans to rent to students or staff will look at the number of bedrooms and the zoning, and a buyer who plans to live in it will look at noise and parking.
The conclusion is not that a house will be hard to sell. It is that the average price per square foot says little about it, and that the best evidence is the recent sales of similar houses on the same few blocks. An owner can ask an agent for those, or for written offers, and compare them.
How do walkability and transit shape who wants the house?
The guide's three scores tell a buyer a lot at a glance: 75 for walking, 86 for biking and 36 for transit. A Walk Score of 75 means most errands can be done on foot, and a Bike Score of 86 puts the neighborhood among the places where cycling is easy. A Transit Score of 36 means that public transport is limited, and the guide says that most people drive or bike.
Those numbers sort buyers. A household with one car and a bike will find the neighborhood easy to live in, with the trail, the parks and the cafes close by. A household that relies on rail to commute will find it harder. The guide's own summary is that University offers real walkability and easy access to Washington Park without paying Cherry Creek prices.
The scores also matter to the investor who buys near a campus. Students and staff often prefer to live where they can walk to class, and the proximity of the university is part of the rental case. The guide does not say how much rent a house near campus earns, and this report does not guess. The Census median gross rent for the postal area, $1,996 a month, is the only rent figure used here, and it is an average across every kind of rental.
For a seller, the scores are a reminder that the house is sold with its location. A buyer who values the walk will pay for it, and a buyer who needs transit will not. A listing that reaches both groups will find that one of them has less interest, and a direct buyer who has decided on the area can move without that sorting.
How do the schools factor in?
The guide lists the assigned schools as University Park Elementary for kindergarten through fifth grade, Merrill Middle School for sixth through eighth and South High School for ninth through twelfth, and notes that each is rated in the Performance Plan tier of the state accountability framework for 2024-25. It also warns that Denver Public Schools runs a district-wide choice system, so an address does not necessarily lock a family into one option.
That warning matters for a seller. A buyer with children will check the school assignment, and an agent who says that a house is zoned for a particular school may be wrong, or may be describing only one option. The safest course for an owner is to tell any buyer to verify the address with the district. A seller who states a school assignment as a fact takes a risk that the statement will be wrong later.
The guide is also clear that school ratings are one signal among several. A rating is a summary of test scores and other measures, and it does not say how a given child will do. This report does not rate the schools, and it does not link a price to them. It records only that the guide treats them as part of the neighborhood's appeal.
For households without children, the schools matter less to the choice and more to the resale. A buyer who plans to sell in a few years will think about who will buy next. That is one reason a neighborhood with a strong pull for families can hold its price, and one reason a seller may hear questions about it from every kind of buyer.
What should a seller with tenants ask first?
Near a campus, an owner may be selling a house with tenants in it. The sale then involves three parties, and the timing depends on the lease. A buyer who plans to live in the house needs it vacant, and a buyer who plans to rent it may want the tenants to stay. The owner should read the lease for its end date, its notice requirements and any rules on access for showings.
A public sale of a tenanted house means arranging showings around the tenants' schedules, which is slow and can strain the relationship. A direct sale to a buyer who will take the property subject to the lease avoids most of that. It also avoids the problem of a vacant house during the academic year, when the next tenants may be hard to find.
The owner should also gather the rent roll, the deposit records and any maintenance requests. A buyer will ask for them, and having them ready shortens the discussion. If the house is owner-occupied, the equivalent file is the list of improvements, the ages of the roof and furnace and the property tax bill. Readers comparing markets can also read the Platt Park brief and the Washington Park brief.
What does a private sale change near a campus?
A public sale near a university comes with its own rhythm. Showings cluster around weekends and the academic calendar, and a house with tenants raises questions about notice periods and access. An inspection of a house that, in this postal area, is more likely than not to be more than sixty years old will find something. A direct private sale to a buyer such as Maison Off-Market changes each of those, and the differences are the five benefits that owners most often value.
The first is privacy: no showings, and no neighbors talking about you selling. The second is a flexible closing date, which suits an owner who has tenants or a lease to end, or a move to plan. The third is no commission, the fourth is no closing costs, and the fifth is avoiding inspections and repairs, so the house is bought as it stands.
The first can be sized without assuming a rate. Each 1% of the guide's typical list price of $799,000 is $7,990, and each 1% of the Census owner estimate of $910,200 is $9,102. A commission at any ordinary rate is a multiple of those amounts. These are round-number illustrations and are not a quote or an offer.
The tradeoff is the usual one. A well-prepared house near the university, listed in a good week, might draw several offers and sell for more than one private bid. An owner who is confident of that and has no deadline should consider listing. An owner who values certainty, a quiet exit and no repairs has a reason to ask for a private offer first.
Methodology and limitations
Tenure, income, rent, population and owner-estimated value come from the American Community Survey 2020-2024 five-year estimates, tabulated for the postal-code area that includes the University neighborhood and Platt Park. The area is wider than the neighborhood, so the figures describe the area and not University alone. Percentages are calculated from published counts and rounded to one decimal place. Margins of error are those published by the Census Bureau at the 90% confidence level.
Days on market, new listings and median listing price are Realtor.com series published through the Federal Reserve Bank of St. Louis for the Denver-Aurora-Lakewood metropolitan area. The new-listing series ends in July 2026 and the others in September 2026. Listing prices are asking prices, not sale prices.
The neighborhood description, walk scores, typical list price, 38-day figure, schools and owner share are quoted from a Denver brokerage's July 2026 guide, which is marketing content by a firm that earns fees from sales and was not independently verified. The report makes no forecast and does not estimate what any particular house would sell for.
Conclusion
For an owner in University, the public record supports a short list of conclusions. The neighborhood is walkable and bikeable and has weak transit, its owner share is lower than much of Denver, a typical home was reported to list near $799,000 and sell in about 38 days in July, and the Denver market has since slowed, with longer waits and softer asking prices.
It does not support a price for any one house, and it does not support a forecast. The choice between a public listing and a private sale comes down to how much an owner values a possible higher price against privacy, a flexible closing date, no commission, no closing costs and no inspections or repairs.
Frequently Asked Questions
Why does the guide's owner share differ from the Census figure?
The guide describes the University neighborhood, and the Census figure describes a larger postal area. The larger area has a higher share of owners.
Does the 38-day figure still hold?
It is a July figure from one guide. Metropolitan days on market rose through September, and the data here cannot say whether the neighborhood followed.
Why are the guide's Denver figures different from the Realtor.com series?
They use different definitions and sources. The report does not mix the two.
Do the Denver listing series describe University?
Not directly. They cover the Denver metropolitan area, so they show the direction of the wider market.
Does a private sale always beat a public listing?
No. A public listing can attract competing bids and sometimes a higher price. A private sale offers privacy, a flexible closing date, no commission, no closing costs and no inspections or repairs, in exchange for a single offer.
Compare your options before committing. Request a written private offer for your property, with no obligation, then weigh it against your listing plan.
Sources
- Denver brokerage (Denver Property Advisors), 2026. University, Denver: A Walkable Pocket Near DU and Wash Park. https://www.denverpropertyadvisors.com/neighborhoods/university-neighborhood-spotlight.
- U.S. Census Bureau, 2026. American Community Survey 2020-2024 five-year estimates, the University area (via Census Reporter). https://censusreporter.org/profiles/86000US80210-80210/.
- Realtor.com, 2026. Housing Inventory: Median Listing Price in Denver-Aurora-Lakewood, CO (CBSA). https://fred.stlouisfed.org/series/MEDLISPRI19740.
- Realtor.com, 2026. Housing Inventory: Median Days on Market in Denver-Aurora-Lakewood, CO (CBSA). https://fred.stlouisfed.org/series/MEDDAYONMAR19740.
- Realtor.com, 2026. Housing Inventory: New Listing Count in Denver-Aurora-Lakewood, CO (CBSA). https://fred.stlouisfed.org/series/NEWLISCOU19740.
Related research

Seller Guide · October 6, 2026
How to Prepare Point Pleasant Beach Rental Records Before Selling
Separate rental approval, income history and booked stays before comparing sale terms.

Seller Guide · October 6, 2026
How to Prepare Rumson Flood and Waterfront Records Before Selling
Separate flood disclosure, elevation, repairs and waterfront rights before comparing sale terms.

Seller Guide · October 6, 2026
How to Prepare Sarasota Condo Inspection and Reserve Records Before Selling
Separate building condition, reserve funding and resale documents before comparing sale terms.