Market Brief · by Aidan Sowa · October 5, 2026
Is Bonnie Brae Really Selling Slower With So Few Listings? Reading the Listing Count and the Drop in the Asking Median
Reading the Listing Count and the Drop in the Asking Median for Bonnie Brae, CO, with each source dated and its limits noted, for owners weighing a listing against a direct sale.
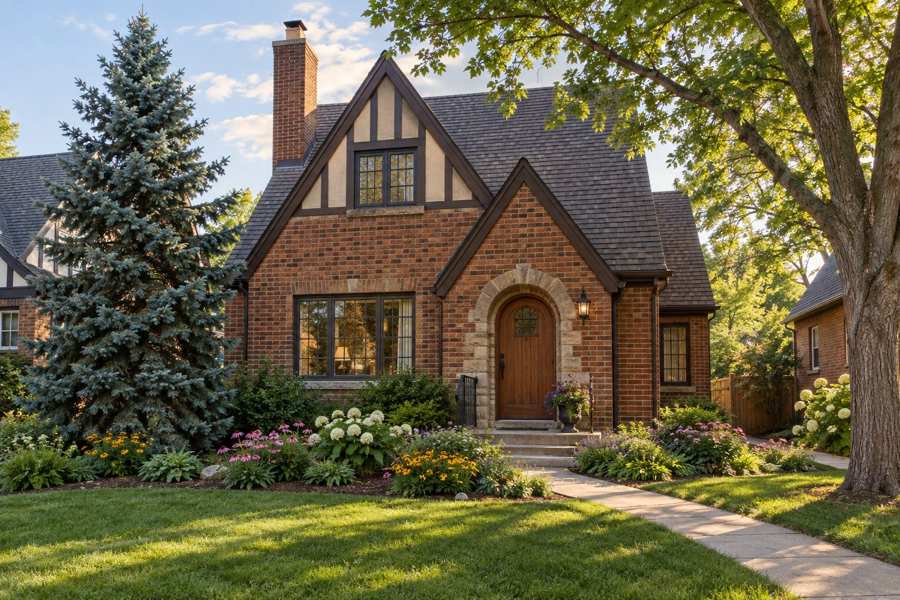
Thirteen homes are for sale in Bonnie Brae. That is the number behind a listing portal's statement that the neighborhood's median asking price, $1,695,000, is down 20.14% in a year and down 34.81% over three years, while the median wait has gone up 104.55%, to 45 days. Dramatic percentages are easy to produce from a small base, and these come from a handful of houses.
A second source, a local agent's comparison page, tells a calmer story. It gives a working median near $1,485,000 at $585 per square foot, average days on market near 30 and a year-over-year trend of plus 4%. One source says that asking prices have fallen by a fifth, and the other says that values have risen by four percent. Both are speaking about the same neighborhood and the same year.
This brief reads the two pages together, adds the Census profile of the postal area that includes Bonnie Brae and the Denver metropolitan series, and explains what a seller can take from them. Both neighborhood pages are commercial content and are labeled so. The brief prices no house.
Key Findings
- A listing portal reported, as of its latest update, a Bonnie Brae median listing price of $1,695,000 (down 20.14% on the year and 34.81% over three years), $577 per square foot (down 3.03%), 13 active listings (up 7.69%) and a median of 45 days on market (up 104.55%) (Realtor.com, Bonnie Brae).
- A local agent's page reported a working median near $1,485,000, $585 per square foot, average days on market near 30 and a year-over-year trend of plus 4% (Rick Janson, Bonnie Brae).
- The same agent's comparison page put Washington Park's median 13% above Bonnie Brae's, $1,685,000 against $1,485,000 (Rick Janson, comparison).
- In the Census postal area, 7,401 of 15,251 occupied homes (48.5%) are owner-occupied, median household income is $125,733 and 10,015 of 16,362 housing units (61.2%) were built before 1980 (U.S. Census Bureau, 2020-2024).
- The Denver-Aurora-Lakewood median days on market rose from 43 in May 2026 to 58 in September (Realtor.com, days on market).
How much can thirteen listings tell a seller?
A median of thirteen prices is the seventh one in the ranking. Change one home, and the median moves to a different house. If the seventh and sixth homes are $200,000 apart, a single new listing at the top of the range or a single sale at the bottom changes the median by about that amount. That is the arithmetic behind a fall of 20.14% in the median ask: a few homes with high prices left the list and a few with lower prices took their place.
The portal gives the count itself, which is the most honest number on the page. Thirteen active listings, up 7.69% on the year, means that a year ago there were twelve. The count of homes is nearly unchanged. The price has moved by a fifth and the number of homes by one. A reader who sees both knows that the price is the figure to doubt.
The wait is subject to the same arithmetic. A median of 45 days that is 104.55% higher than last year means a year ago the median was about 22 days. Those are the medians of a dozen or so listings, and a few slow ones can double them. It does not mean that every home in Bonnie Brae now takes twice as long to sell. It does suggest that buyers are less rushed than they were, and the direction matches the Denver metropolitan series.
For an owner, the practical rule is to treat any percentage change on a base of ten or fifteen homes as a sign of direction and not of size. The sign here points toward softer asking prices and a longer clock. It would be a mistake to subtract a fifth from a house value because of it, and equally a mistake to ignore it.
| Measure | Realtor.com | Rick Janson |
|---|---|---|
| Median | $1,695,000 (listing) | About $1,485,000 |
| Price per square foot | $577 (down 3.03%) | $585 |
| Days on market | 45 (up 104.55%) | About 30 (average) |
| Direction over a year | Listing price down 20.14% | Trend plus 4% |
| Active listings | 13 (up 7.69%) | Not shown |
Sources: Realtor.com and Rick Janson neighborhood pages. Commercial content; not independently verified.
Why do the two pages disagree about direction?
The first page measures asking prices and the second describes a working median whose definition it does not give. An asking price is what sellers hope to get. A working median is something nearer to what homes are worth. A fall in the first and a rise in the second can happen together when sellers who overpriced cut their prices, or when expensive homes leave the market unsold. The two pages agree on one thing, the price per square foot: $577 and $585, within 1.4% of each other.
That agreement is the most useful finding on either page. If the price per foot is close to $580, then a house of 2,000 square feet is in the range of about $1.16 million and one of 3,000 square feet near $1.74 million. This is arithmetic on two published numbers and not a valuation. It shows that median prices in the $1.5 to 1.7 million range correspond to homes of about 2,600 to 2,900 square feet, which is a large house for a neighborhood known for compact brick cottages. The medians may therefore be pulled by the larger homes.
The agent's page also says that Washington Park runs about 13% above Bonnie Brae, with a price per foot of $645 against $585. The gap on a per-foot basis is 10%. That is consistent with Bonnie Brae being a neighborhood of somewhat smaller, older homes next door to a more expensive one, and not a sign of a weaker market.
What an owner should take from the mismatch is the need for the recorded sale of a comparable house, not a headline. The sale price, the first asking price and the number of days it was listed are the three facts that tell the story of one house, and neither neighborhood page gives them.
There is a further reason for care with the asking median. Sellers who have already cut their price still appear in the list at the new price, and sellers who withdrew their homes disappear from it. A median ask that falls can reflect cuts, withdrawals or a change in which homes are listed, and the portal page does not separate them.
Sources: Realtor.com and Rick Janson pages. Square-foot examples are this brief's arithmetic ($580 times 2,000 and 3,000), not recorded sales. Commercial content; not independently verified.
What does a small neighborhood do to a seller's timing?
In a neighborhood with 13 homes for sale, the pool of comparable listings is tiny, and a buyer who is looking at Bonnie Brae can see all of them in an afternoon. That is both an advantage and a risk. It is an advantage because a well-presented house will be seen by nearly every serious buyer in the neighborhood. It is a risk because a house that is priced a little too high is compared directly against the other twelve, and the comparison is unforgiving.
The days on market figure is a measure of how long houses wait for the right buyer, and with a small pool, a few buyers set the pace. If two of them are looking at once, a house sells in a week. If none is looking, it sits for two months. A median of 45 days is a description of that uneven arrival, not a steady rate. The agent's average of 30 days describes a different mix of the same arrivals.
This is why a seller's timing matters as much as the price. A house that comes to market in a month when no buyer is active waits, and each week of waiting costs money in carrying costs and invites a price cut. A private sale does not depend on which month the buyers show up, since the buyer is already at the table when the offer is made.
The seller's other option is to wait for a better month. That works when the next home is not urgent and the carrying costs are low. It does not work when the seller has already bought elsewhere, or when the house is empty. In those cases the clock runs against the seller, and a fixed date for closing is worth more than a possible better price.
The sources used here do not report which months are best in Bonnie Brae, and the brief does not claim any seasonal pattern. The Denver metropolitan figures show that the market was slower in late summer than in spring, which is the only timing evidence in the record.
Sources: Realtor.com and Rick Janson neighborhood pages; Realtor.com via FRED for Denver. The description of how a small pool of buyers behaves is this brief's reasoning and not a measured finding.
Why do price per foot figures matter more here than medians?
Of all the numbers in the two pages, the price per square foot is the only one that nearly matches across sources, at $577 and $585. That is why it deserves more weight than the medians. A median depends on which homes happen to be in the sample, while a price per foot adjusts for size, and in a neighborhood of mixed home sizes the adjustment matters.
The figure also moves less. The portal says that the price per foot is down 3.03% on the year, against 20.14% for the median ask. A change of three percent is within the range of noise for a dozen homes, and it is a better description of where values are than the headline. If the neighborhood's values had truly fallen by a fifth, the price per foot would show it, and it does not.
The limits are plain. Price per foot does not capture the lot, the finish, the condition or the block. A smaller house on a deep lot with a renovated kitchen sells for more per foot than a larger house that needs work. A seller can use the figure as a rough check, multiplying it by the size of the house, and then adjust for those differences. The result is a starting point and not a price.
On the figures above, the rough check gives about $1.15 million for 2,000 square feet and $1.45 million for 2,500 square feet at $580 per foot. Those are examples of arithmetic and not statements about any house. They fall below the median ask of $1,695,000 and near the agent's $1,485,000, which is a reason to think the portal's median is weighted toward larger or more expensive homes.
A seller who wants more precision than this should ask for recorded sales of similar homes, with the price per foot of each. The pages used here do not provide them, and a private buyer will usually give an offer in a few days that reflects the buyer's own reading of the same facts.
Sources: Realtor.com and Rick Janson neighborhood pages. Square-foot examples are this brief's arithmetic ($580 times 2,000 and 2,500), not recorded sales.
What does the Census say about who lives around Bonnie Brae?
The Census profile describes the postal area that contains Bonnie Brae and its neighbors, which is much larger than the neighborhood. It counts 27,564 people and 16,362 homes, of which 1,111 (6.8%) are vacant. Owners occupy 7,401 homes (48.5%) and renters occupy 7,850 (51.5%). Median household income is $125,733 and median gross rent is $2,031 a month.
The rent and income give a rough sense of the household budgets. At $2,031 a month, a renter pays $24,372 a year, which is 19.4% of the median household income. Owners estimate a median home value of $1,018,300, with a margin of error of $65,096, or 6.4%. The estimate is lower than the neighborhood medians of $1.5 million or more, which says that the postal area is more modest than Bonnie Brae itself and that a buyer here is in a part of the market that is above the area average.
The homes in the area are old. Of the 16,362 units, 4,943 (30.2%) were built in 1939 or earlier, and 10,015 (61.2%) before 1980. There is also new construction, with 2,814 units from the 2010s (17.2%). Bonnie Brae is known for homes from the 1920s to 1950s, and for a seller that means a house old enough that its systems have probably been replaced at least once, and perhaps not recently.
The shape of the area has a consequence for sellers. A buyer who wants a Tudor cottage with a modern kitchen can find one only by buying and renovating, or by buying a house already renovated at a premium. In a market with a long clock, a house in the middle, neither restored nor original, sits the longest.
| Indicator | Value | Note |
|---|---|---|
| Population | 27,564 | Whole postal area |
| Housing units | 16,362 | All units |
| Owner-occupied homes | 7,401 | 48.5% of occupied |
| Renter-occupied homes | 7,850 | 51.5% of occupied |
| No usual resident | 1,111 | 6.8% of all units |
| Built before 1980 | 10,015 | 61.2% of units |
| Median household income | $125,733 | Estimate |
| Median gross rent | $2,031 | Monthly |
| Owner-estimated median value | $1,018,300 | Margin of error $65,096 |
Source: U.S. Census Bureau, American Community Survey 2020-2024 five-year estimates. Rent share of income is this brief's arithmetic.
How should an owner of an older brick house prepare?
A house from the 1920s or 1930s has features that buyers love and features that inspectors flag. The brick, the arched doorways, the hardwood floors and the leaded or divided windows are the first group. The second group is wiring that was upgraded in the 1960s, a furnace that is twenty years old, a sewer line made of clay and a roof that was replaced by the last owner. A seller who walks through the house with that second group in mind knows what a buyer's report will say.
The decision is between fixing, pricing and selling as is. Fixing costs money and time, and a buyer may not value the repair at what it cost. Pricing for condition gives the buyer a discount that the buyer decides, usually after the inspection. Selling as is to a buyer who plans to do the work moves the problem to the person who is ready for it. The fifth benefit of selling off-market, avoiding inspections and repairs, speaks to the third choice.
There is also the matter of the neighborhood's character. Many buyers in Bonnie Brae want to keep the details of an older house, and a seller who has renovated it in a modern style may find that the buyers who wanted the original are put off and the buyers who wanted modern would have bought elsewhere. A buyer who purchases directly is not looking for a staged house. The home is valued as it stands.
A seller should also gather the papers a buyer will ask for, whichever route is chosen: permits for past work, warranties, a survey if one exists, and the history of any insurance claims. None of the sources used here gives the cost of such work, and this brief does not estimate it.
Finally, the age of the neighborhood means that many owners have lived in their homes for a long time. A long-time owner often has little reason to know what the house would sell for, and the first step is simply to gather real offers. A private offer is one such data point, and it comes without the cost of a public listing.
Source: U.S. Census Bureau, American Community Survey 2020-2024, table B25034. The description of typical issues in older houses is general knowledge and not a figure from any source used here.
What does the Denver clock say?
The Denver-Aurora-Lakewood series from Realtor.com, published by the Federal Reserve Bank of St. Louis, show a metropolitan market that slowed through the summer. The median days on market was 43 in May, 48 in June, 51 in July, 57 in August and 58 in September. Active listings rose from 9,144 in March to 12,813 in July (Realtor.com, active listings).
New listings fell from 5,876 in May to 4,596 in July (Realtor.com, new listings). The median listing price slid from $589,000 in May to $569,900 in September (Realtor.com, median listing price), and the count of reduced listings grew from 5,528 to 6,848 over the same months (Realtor.com, price reduced listings).
Bonnie Brae's 45 days sits below the metropolitan 58 and above the local agent's 30. All three point toward a market where it takes longer to sell than it did in the spring.
None of these series describe Bonnie Brae. They say that the setting around it moved toward buyers in 2026. Readers comparing markets can also read the Washington Park brief and the Louisville brief.
Source: Realtor.com via FRED, Housing Inventory series for Denver-Aurora-Lakewood, CO (CBSA).
What would a private sale change for a Bonnie Brae owner?
A direct sale to a buyer who purchases homes off the market changes five things for a seller. There are no showings and no neighbors talking about you selling, which matters in a neighborhood of 13 listings where each one is noticed. The closing date can be flexible, giving time to find a new home. There are no commission costs and no closing costs for the seller. And there are no inspections or repairs, which for a house from the 1920s can be a long list.
The fee benefit requires no assumed rate. For every 1% of a sale price that would otherwise go to fees, a sale at $1,485,000 keeps $14,850 and a sale at $1,695,000 keeps $16,950. An owner can apply whatever percentage is in a listing agreement and compare net proceeds.
With so few homes for sale, a listing is visible to everyone who watches the neighborhood. A home that sits for 45 days and then cuts its price is a public event on a short list. A private sale keeps that history from forming.
The trade-off is the usual one. A public listing can find the buyer who wants this particular kind of house, and in a small neighborhood that buyer can be willing to pay more. A private sale offers privacy, a settled date and no repairs. The owner decides.
An owner who is still undecided can treat a private offer as information. It takes little time to receive, it carries no obligation, and it can be set against the thirteen public listings and the two published medians as one more reference point, the only one that is tied to the actual house.
Source: calculation from stated prices; no commission rate, closing cost or repair cost is assumed.
Methodology and limitations
Prices, price per square foot, days on market and listing counts for Bonnie Brae come from two commercial pages, a listing portal and a local agent's neighborhood page. They were not independently verified and do not share definitions, and the brief reports them side by side for that reason.
Age, tenure, vacancy, income, rent and owner-estimated value come from the American Community Survey 2020-2024 five-year estimates for the postal-code area that includes Bonnie Brae. The area is much larger than the neighborhood. Shares and examples are calculated from published figures.
Days on market, active and new listings, median listing price and price reduced counts are Realtor.com series published by the Federal Reserve Bank of St. Louis for the Denver-Aurora-Lakewood metropolitan area. The brief makes no forecast and does not estimate what any particular home would sell for.
Conclusion
The Bonnie Brae record supports a short list. The neighborhood is small, the headline percentages come from about a dozen homes, the two pages disagree about direction and agree on the price per foot, and the wait has lengthened.
It does not fix a price for any one home. The choice between a public listing and a private sale comes down to whether an owner values the chance of competing bids more than privacy, a flexible closing date, no commission, no closing costs and no inspections or repairs.
Frequently Asked Questions
What is the median home price in Bonnie Brae?
Sources differ. A listing portal reports a median ask of $1,695,000, and a local agent page reports a working median near $1,485,000.
Did Bonnie Brae prices fall 20 percent?
The median asking price fell 20.14% on the portal page, based on 13 listings. Another source reports a trend of plus 4%.
How long do Bonnie Brae homes take to sell?
The portal reports a median of 45 days, up 104.55%. The agent page reports an average near 30.
Does the Denver metropolitan data describe Bonnie Brae?
No. It covers a metropolitan area and shows direction only.
Does a private sale always beat a public listing?
No. A public listing can attract competing bids. A private sale offers privacy, a flexible closing date, no commission, no closing costs and no inspections or repairs.
Compare your options before committing. Request a written private offer for your property, with no obligation, then weigh it against your listing plan.
Sources
- Realtor.com, 2026. Bonnie Brae Neighborhood Housing Market. https://www.realtor.com/local/market/colorado/denver/bonnie-brae.
- Rick Janson, 2026. Bonnie Brae Real Estate. https://www.rickjanson.com/denver-neighborhoods/bonnie-brae/.
- Rick Janson, 2026. Bonnie Brae versus Washington Park. https://www.rickjanson.com/compare/bonnie-brae-vs-washington-park/.
- U.S. Census Bureau, 2026. American Community Survey 2020-2024 five-year estimates, the Bonnie Brae area (via Census Reporter). https://censusreporter.org/profiles/86000US80209-80209/.
- Realtor.com, 2026. Housing Inventory: Median Days on Market in Denver-Aurora-Lakewood, CO (CBSA). https://fred.stlouisfed.org/series/MEDDAYONMAR19740.
- Realtor.com, 2026. Housing Inventory: Active Listing Count in Denver-Aurora-Lakewood, CO (CBSA). https://fred.stlouisfed.org/series/ACTLISCOU19740.
- Realtor.com, 2026. Housing Inventory: New Listing Count in Denver-Aurora-Lakewood, CO (CBSA). https://fred.stlouisfed.org/series/NEWLISCOU19740.
- Realtor.com, 2026. Housing Inventory: Median Listing Price in Denver-Aurora-Lakewood, CO (CBSA). https://fred.stlouisfed.org/series/MEDLISPRI19740.
- Realtor.com, 2026. Housing Inventory: Price Reduced Count in Denver-Aurora-Lakewood, CO (CBSA). https://fred.stlouisfed.org/series/PRIREDCOU19740.
Related research

Seller Guide · October 6, 2026
How to Prepare Point Pleasant Beach Rental Records Before Selling
Separate rental approval, income history and booked stays before comparing sale terms.

Seller Guide · October 6, 2026
How to Prepare Rumson Flood and Waterfront Records Before Selling
Separate flood disclosure, elevation, repairs and waterfront rights before comparing sale terms.

Seller Guide · October 6, 2026
How to Prepare Sarasota Condo Inspection and Reserve Records Before Selling
Separate building condition, reserve funding and resale documents before comparing sale terms.