Market Brief · by Aidan Sowa · October 5, 2026
Is a High Pines Quarter Acre Priced as a Home or as a Lot? Reading the Quarterly Sales, the County Permit Desk and the Millage Line
Reading the Quarterly Sales, the County Permit Desk and the Millage Line for South Miami / High Pines, FL, with each source dated and its limits noted, for owners weighing a listing against a direct sale.
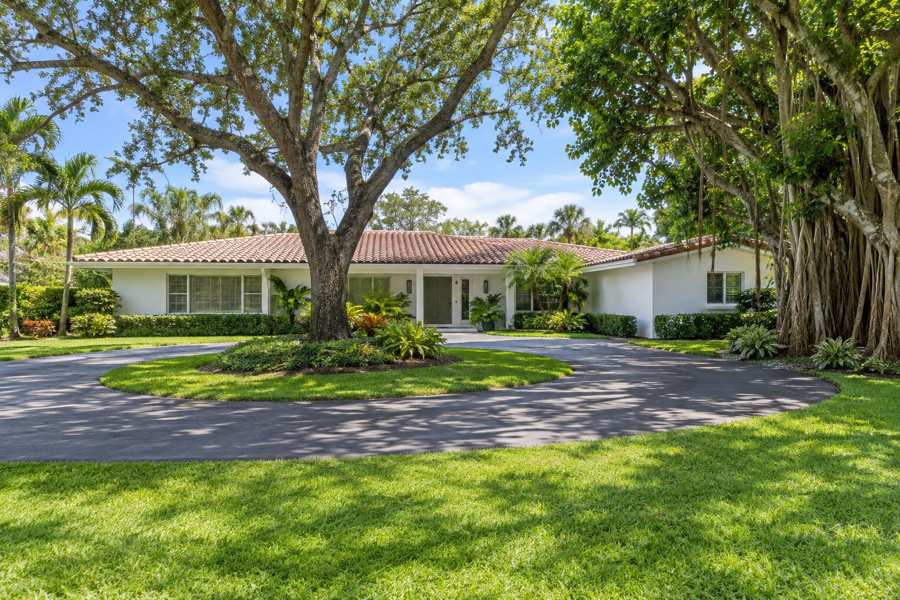
A homeowner on a quarter-acre lot in High Pines might hear two things in the same week. One broker says the second-quarter median for the area was $7,250,000. Another says the county median for single-family homes was $680,000 in May, and a third says South Miami posted a $1.6 million median in June. All three can be true. They describe different homes, different months and, in one case, a sample of just 15 sales.
This brief takes that problem as its subject. It reads the Census profile of the postal area that includes South Miami and High Pines, the market numbers that local brokerages published in 2026, the Miami metropolitan listing series from Realtor.com, and the practical rules that come with an unincorporated address. It asks what an owner can learn from them, and what none of them can say.
The limits come first. The Census figures cover a postal area wider than the two neighborhoods, so they describe the area and not a single street. The brokerage figures are commentary from sellers of homes and have not been independently verified. The Realtor.com series cover the whole metropolitan area from Miami to West Palm Beach. Nothing here prices any one house.
Key Findings
- A local brokerage reported 15 closed single-family sales in the second quarter of 2026 across High Pines and Ponce-Davis at a median of $7,250,000, and said the median moves with whatever mix happened to trade (Guanche, 2026).
- The same guide put the High Pines median lot at 0.27 acres, the Ponce-Davis median lot at 0.85 acres, and the combined millage for the unincorporated area at 16.9317 mills for 2025-26, with county-only permitting.
- A July 2026 market note reported a $1.6 million June median sale price for South Miami and a $2.01 million May median for Pinecrest, against $695,000 for Miami-Dade single-family homes overall (Pol Realty, July 2026).
- In the Census postal area, 9,507 of 15,704 housing units (60.5%) were built before 1980, and the median year built is 1975 (U.S. Census Bureau, 2020-2024).
- The metropolitan median days on market rose from 74 in March 2026 to 85 in July (Realtor.com, days on market).
What does a median of fifteen sales tell an owner?
The brokerage guide is unusually frank about its own headline. It reports that the combined High Pines and Ponce-Davis submarket closed 15 single-family sales in the second quarter of 2026 at a median of $7,250,000, and then says that at fifteen closings the median describes which homes happened to trade and says little about what any given house is worth. A quarter heavy on new-construction estates posts a high number, it says, and a quarter of original ranches posts a low one. The author does not publish a year-over-year median comparison for a quarter that small.
The trailing year makes the point. The same guide counted 50 sales in the twelve months through March 2026 at a median of $4,525,000. The two figures cover different periods and different groups of houses, so the distance between them is not a measure of appreciation. A reader who takes $4,525,000 and $7,250,000 as a rise of 60% has read a change in mix as a change in price.
Price per square foot behaves better, but only a little. The guide reports $1,255 for the second quarter, up 16.4% from a year earlier, and cautions that the figure does not remove the value of the land or the size of the house. A quarter-acre lot with an original ranch and a quarter-acre lot with a new two-story house can sit on the same street and sell at very different dollars per foot, because the buyer of the first is paying for land and the buyer of the second is paying for a finished building.
A short example shows the scale. Suppose two sales on the same street, one at $3,000,000 and one at $4,500,000. The median of the two is $3,750,000 and the average is the same, yet neither house sold for that price, and a third sale at $9,000,000 would pull the average to $5,500,000 while moving the median only to $4,500,000. Fifteen sales leave the same room for distortion, which is why the guide declines to compare the quarter with the year before.
The practical reading for an owner is narrow. An area median is a place to start a conversation, not a valuation. The guide itself says the honest unit of analysis is the block: the recent sales on the specific street, the permit activity on the lots around it and the school assignment for the exact address. That is also why a private buyer who purchases homes off the market usually asks for the address first and quotes a number second.
Source: Jorge Guanche, July 2026. MLS figures are the brokerage's own and were not independently verified.
Which lot is the owner actually selling?
The guide separates two communities that share a postal area and a county government. High Pines, it says, is the compact western piece, with a median lot of 0.27 acres, a trailing-year median of $3,450,000 on 21 sales and a median of 41 days on market. Ponce-Davis wraps it on the east and south, with a median lot of 0.85 acres, a median of $5,500,000 on 29 sales and 84 days on market. The guide says the two products barely overlap, and that a High Pines budget does not stretch across School House Road.
For an owner on a High Pines grid, the more useful comparison is between the house and the land beneath it. The guide describes a mix of original ranches, renovations and new construction on the quarter-acre lots, and calls the pattern one of the more active teardown-and-rebuild markets in southwest Miami-Dade. It gives mid-range custom construction in the county as $200 to $350 per square foot before site preparation, permits, demolition and carrying costs. Those are the guide's figures, and they are the kind of number that a buyer will use to subtract from the price of an old house.
That subtraction is why a house of the same age and size can attract a different offer from a buyer who plans to live in it than from one who plans to build. The first buyer looks at the kitchen and the roof. The second looks at the lot lines and the setbacks. A seller who knows which buyer is on the other side of the table has a better idea of how much condition matters.
The Census profile supports the teardown reading from another direction. Of the 15,704 housing units in the postal area, 2,737 were built in the 1950s, 2,549 in the 1960s and 3,521 in the 1970s. Together those three decades are 8,807 units, or 56.1% of the stock. A stock that old is full of houses near the end of their first life.
Source: Jorge Guanche, July 2026; U.S. Census Bureau, American Community Survey 2020-2024, table B25034. Construction costs are the brokerage's statements.
What changes when there is no city hall?
Both neighborhoods are unincorporated. The guide says Coral Gables applied to annex them in 2018 and that Miami-Dade County rejected the proposal in 2019, so the area stays under county government with no city layer. Police, fire, permits and code enforcement come from the county. The guide calls the single permitting layer a practical advantage for owners planning construction, and notes the trade-off: Coral Gables adds a Board of Architects review to exterior work, and some buyers want exactly that certainty about what can rise next door.
The tax bill shows the difference most clearly. The guide gives the combined rate for the unincorporated area as 16.9317 mills for 2025-26, the lowest of the eight areas it covers, against 18.1852 for Coral Gables. The formula is the taxable value times the rate divided by 1,000. On $2,000,000 of taxable value that is $33,863 a year, against $36,370 at the Gables rate, a gap of $2,507. Over a ten-year hold, the same gap is $25,070 before any change in value or rate.
A seller can use that arithmetic. A buyer comparing a High Pines house with one a few blocks away inside a city will look at the annual carrying cost as well as the price, and the lower rate is part of what the High Pines address is worth. A seller who has the current bill ready answers the question before it is asked.
Insurance is the other line in the carrying cost. The guide cites the state insurer's approved 2026 rates, which cut Miami-Dade homeowners premiums by an average of 14.0% across 42,386 policies, and then adds that a published average is not a guaranteed reduction on any one house. It also cites a 30-year fixed mortgage rate of 6.43% as of July 2. A buyer adds tax, insurance and financing together, and a seller who can show all three has a shorter conversation.
The gap cuts the other way on services. With no municipal layer there is no city-run park system, no village architectural board and no city police department. For some buyers that is a gain, and for others it is a gap. Either way it is a fact about the address, and it belongs in the first conversation and not the last.
Source: Jorge Guanche, July 2026, citing the Miami-Dade Property Appraiser millage chart and county annexation records. Not independently verified.
What does the nearby city market add?
The July note from another brokerage looks at South Miami and Pinecrest, the two cities that border the unincorporated area. It reports a Pinecrest median sale price of $2,011,296 for May, down 12.2% from a year earlier, with homes selling about 7% below list price, and a South Miami median of $1,600,000 for June, with the price per square foot easing to $554. It reads the South Miami jump as a sign that larger, higher-end homes drove the closings in a small market. The county single-family median was $695,000.
The two notes do not agree on the South Miami number. The first guide reports a South Miami second-quarter median of $1,020,000, down 7.3%, and the second reports $1,600,000 for June alone. Both can be right, because one covers three months and the other covers one, and a small city can swing by hundreds of thousands of dollars on a handful of closings. An owner who sees both numbers in the same week should treat the gap as a warning about sample size and not as a fact about price.
The county backdrop in the July note is that Miami-Dade posted its strongest June in three years, that single-family supply stood at 4.9 months, and that sales above $1 million rose 29.1% from a year earlier. A supply of 4.9 months is on the sellers' side of the usual six-month line, but the note also says that buyers have become selective and that pricing, condition and presentation decide who wins.
The same note observes that buyers in the corridor have leverage that did not exist two years ago, and it cites a 12.2% fall in the Pinecrest median. Read next to the High Pines figure of $7,250,000, the neighboring cities tell the owner that the top end is where the movement is, and that movement runs both ways.
Source: Pol Realty, July 27, 2026, citing Redfin, Zillow and MIAMI Realtors; Jorge Guanche, July 2026. Brokerage content, not independently verified.
Who lives here, and who owns?
The postal area has 33,711 residents and 15,704 housing units, of which 14,234 are occupied. Owners live in 7,478 homes (52.5% of occupied) and renters in 6,756 (47.5%). The other 1,470 units, 9.4% of the total, have no usual resident. Median household income is $83,008, and median gross rent is $1,928 a month, or $23,136 a year, which is 27.9% of the median income.
Owners estimate the median home at $857,200, with a margin of error of $83,063, about 9.7%. That sits far below the brokerage medians for High Pines and Ponce-Davis, and it says the postal area is much wider than the estate streets. It includes apartment buildings, condominiums and smaller houses, and the owners of those are most of the people the Census counted.
The owner share matters for a seller in a second way. Nearly half the occupied homes are rented, so a share of the neighbors are tenants, and a share of the competing sales are investors. In a postal area with 47.5% renters, a house that is empty for a few months before a sale is not unusual, and a buyer who plans to rent it out is a realistic buyer.
The age profile adds one more point. The median year built is 1975, and 60.5% of the units were built before 1980. Roofs, wiring, plumbing and windows on that stock are in their second or third replacement cycle. A buyer who hires an inspector will find items on that list, and each item becomes a request for a credit.
| Indicator | Value | Note |
|---|---|---|
| Population | 33,711 | Whole postal area |
| Housing units | 15,704 | All units |
| Owner-occupied homes | 7,478 | 52.5% of occupied |
| Renter-occupied homes | 6,756 | 47.5% of occupied |
| No usual resident | 1,470 | 9.4% of all units |
| Median household income | $83,008 | Estimate |
| Median gross rent | $1,928 | Monthly |
| Owner-estimated median value | $857,200 | Margin of error $83,063 |
Source: U.S. Census Bureau, American Community Survey 2020-2024 five-year estimates, tables B01003, B19013, B25003, B25034, B25064 and B25077.
What does the metro clock say?
Realtor.com publishes listing series for the Miami, Fort Lauderdale and West Palm Beach metropolitan area through the Federal Reserve Bank of St. Louis. They show direction and not the level for any one street. The median days on market rose from 74 in March 2026 to 77 in April, 79 in May, 82 in June and 85 in July. That is a rise of 11 days in four months.
Active listings stood at 43,929 in May and 40,908 in August, then rose to 41,277 in September (Realtor.com, active listings). The median listing price slipped from $499,000 in May to $490,000 in September (Realtor.com, median listing price). The count of listings with a price reduction fell from 10,942 in March to 8,810 in July (Realtor.com, price reduced listings). That is a count and not a share, and it fell along with the number of listings, so it does not show that fewer sellers are cutting.
Put the pieces together and the metropolitan picture is a market that slowed a little in the summer with listings falling slightly and asking prices drifting down by under 2%. That fits the county note that buyers have become selective. It does not tell an owner in High Pines how long a listing will take, because the metropolitan figures are dominated by condominiums and smaller houses, and the estate streets behave differently.
The guide gives a local clock that is closer to the point. It reports a median of 59 days on market for the second quarter and 24 active listings with 5 under contract on July 5, which works out to just under five months of supply at the quarter's closing pace. Those are small numbers, and a single large closing would change them. Readers comparing markets can also read the Marco Island brief and the Coconut Grove brief.
Source: Realtor.com via FRED, Housing Inventory: Median Days on Market, Active Listing Count, Median Listing Price and Price Reduced Count, Miami-Fort Lauderdale-West Palm Beach, FL (CBSA); Jorge Guanche, July 2026.
What would a private sale change here?
A direct sale to a buyer who purchases homes off the market changes five things for the seller. There are no showings and no neighbors talking about you selling, which is the privacy benefit. The closing date can be flexible, giving time to find a new home. There are no commission costs and no closing costs for the seller. And there are no inspections or repairs, which matters on a stock where 60.5% of the homes were built before 1980.
The fee benefit needs no assumed rate. For every 1% of a sale price that would otherwise go to fees, a sale at $1,600,000 keeps $16,000, a sale at $2,011,296 keeps about $20,113 and a sale at $3,450,000 keeps $34,500. An owner can set whatever percentage applies against a private offer and compare the two on net proceeds, and can do it before anyone visits the house.
The repairs benefit is easiest to see against the age profile. A buyer who inspects a house built in 1965 will find a list, and the list becomes a credit or a delay. A buyer who purchases as is does not ask for the list. For an owner who would rather not replace a roof in order to sell, the as-is route removes that decision.
The trade-off is the usual one. A public listing can bring competing bids, and in a thin market a single strong bid can move the result a long way. A private sale brings one offer. An owner who values privacy, a settled date and freedom from repairs may prefer it, and an owner who wants to test the market may not. The choice belongs to the owner.
Source: calculation from stated prices; no commission rate or closing cost is assumed.
Methodology and limitations
Age, tenure, vacancy, income, rent, population and owner-estimated value come from the American Community Survey 2020-2024 five-year estimates for the postal-code area that includes South Miami and High Pines. The area is wider than either neighborhood. Shares are calculated from published counts, and owner-estimated value carries a stated margin of error.
Days on market, active listings, median listing price and price reduced counts are Realtor.com series published by the Federal Reserve Bank of St. Louis for the Miami-Fort Lauderdale-West Palm Beach metropolitan area. The price-reduced series ends in July 2026 and the others in September 2026. Listing prices are asking prices and not sale prices.
The guide and the market note are brokerage content. Their medians, lot sizes, tax rates and sample counts were not independently verified, and the two do not use the same periods. The brief makes no forecast and does not estimate what any particular home would sell for.
Conclusion
The public record supports a short list for an owner here. A fifteen-sale quarter is too small to set a price, a quarter-acre lot is partly a land sale, an unincorporated address brings a lower millage and a single county permit desk, and more than half of the homes in the postal area are fifty years old or more.
It does not support a price for any one house, and it does not support a forecast. The choice between a public listing and a private sale comes down to how much an owner values a possible higher price against privacy, a flexible closing date, no commission, no closing costs and no inspections or repairs.
Frequently Asked Questions
Is High Pines the same as Ponce-Davis?
No. They are two unincorporated communities that share a postal area. The guide reports a median lot of 0.27 acres in High Pines and 0.85 acres in Ponce-Davis.
Why do the South Miami medians differ between sources?
One source covers the second quarter and another covers June alone, and in a small city a few closings can move a median a long way.
What is the millage for the unincorporated area?
The guide gives 16.9317 mills for 2025-26. On $2,000,000 of taxable value that is $33,863 a year.
Does the metro listing data describe High Pines?
No. It covers the whole Miami to West Palm Beach area and shows direction only.
Does a private sale always beat a public listing?
No. A public listing can attract competing bids. A private sale offers privacy, a flexible closing date, no commission, no closing costs and no inspections or repairs, in exchange for a single offer.
Compare your options before committing. Request a written private offer for your property, with no obligation, then weigh it against your listing plan.
Sources
- Jorge Guanche, 2026. High Pines and Ponce-Davis: Complete Guide. https://jorgeguanche.com/insights/complete-guide-high-pines-ponce-davis.
- Pol Realty, 2026. The $2 Million Question in Pinecrest, and Why South Miami Is Answering It. https://polrealty.com/the-2-million-question-in-pinecrest-and-why-south-miami-is-answering-it/.
- U.S. Census Bureau, 2026. American Community Survey 2020-2024 five-year estimates, the South Miami / High Pines area (via Census Reporter). https://censusreporter.org/profiles/86000US33143-33143/.
- Realtor.com, 2026. Housing Inventory: Median Days on Market in Miami-Fort Lauderdale-West Palm Beach, FL (CBSA). https://fred.stlouisfed.org/series/MEDDAYONMAR33100.
- Realtor.com, 2026. Housing Inventory: Active Listing Count in Miami-Fort Lauderdale-West Palm Beach, FL (CBSA). https://fred.stlouisfed.org/series/ACTLISCOU33100.
- Realtor.com, 2026. Housing Inventory: Median Listing Price in Miami-Fort Lauderdale-West Palm Beach, FL (CBSA). https://fred.stlouisfed.org/series/MEDLISPRI33100.
- Realtor.com, 2026. Housing Inventory: Price Reduced Count in Miami-Fort Lauderdale-West Palm Beach, FL (CBSA). https://fred.stlouisfed.org/series/PRIREDCOU33100.
Related research

Seller Guide · October 6, 2026
How to Prepare Point Pleasant Beach Rental Records Before Selling
Separate rental approval, income history and booked stays before comparing sale terms.

Seller Guide · October 6, 2026
How to Prepare Rumson Flood and Waterfront Records Before Selling
Separate flood disclosure, elevation, repairs and waterfront rights before comparing sale terms.

Seller Guide · October 6, 2026
How to Prepare Sarasota Condo Inspection and Reserve Records Before Selling
Separate building condition, reserve funding and resale documents before comparing sale terms.