Market Brief · by Aidan Sowa · October 5, 2026
Is a Coconut Grove House a Home or a Landmark in Waiting? Reading the Age Rule, the Price Cut Share and the Wait
Reading the Age Rule, the Price Cut Share and the Wait for Coconut Grove, FL, with each source dated and its limits noted, for owners weighing a listing against a direct sale.
A Coconut Grove owner who reads the market in 2026 will meet a puzzle. In April, a local broker wrote that 50% of Grove homes had reduced their price and called the market a negotiation. In October, a listing site reported that 14% of listings had seen a reduction. The first number sounds like a collapse. The second sounds like a quiet autumn. They come from different reports with different definitions, and an owner who treats either as a forecast is reading too much into it.
This brief sets the two side by side with the Census profile of the postal area that includes Coconut Grove, the Miami metropolitan listing series from Realtor.com, and a July 2026 report about a South Grove owner who asked the city to protect her 1925 house. That last story points at a rule every older Grove owner should know: a house that is at least fifty years old can be designated historic, and a designation changes what can be done to it.
The limits are plain. The Census figures cover a postal area, not a street. The brokerage and listing figures are commentary and have not been independently verified. The metropolitan series cover Miami to West Palm Beach. Nothing here prices a house.
Key Findings
- A local broker reported in April 2026 a median list price of $3,249,500, a price per square foot of $1,232, 115 average days on market, 46 median days and 50% of homes with a price reduction (Martinez, April 2026).
- A listing site reported in October 2026 66 active listings, a median asking price of $3.1 million, 107 average days on market and 14% of listings with a price reduction, with 65% priced at $2 million or more (Casa Simple, October 2026).
- A July 2026 report said a property at least 50 years old that meets the city's criteria can be designated historic, after which any alteration, new construction or demolition needs a certificate of appropriateness (WLRN, July 2026).
- In the Census postal area, 9,653 of 17,933 housing units (53.8%) were built before 1980, and 7,461 (41.6%) before 1970 (U.S. Census Bureau, 2020-2024).
- The Miami metropolitan median days on market rose from 74 in March 2026 to 85 in July (Realtor.com, days on market).
What does the fifty-year rule do to an older house?
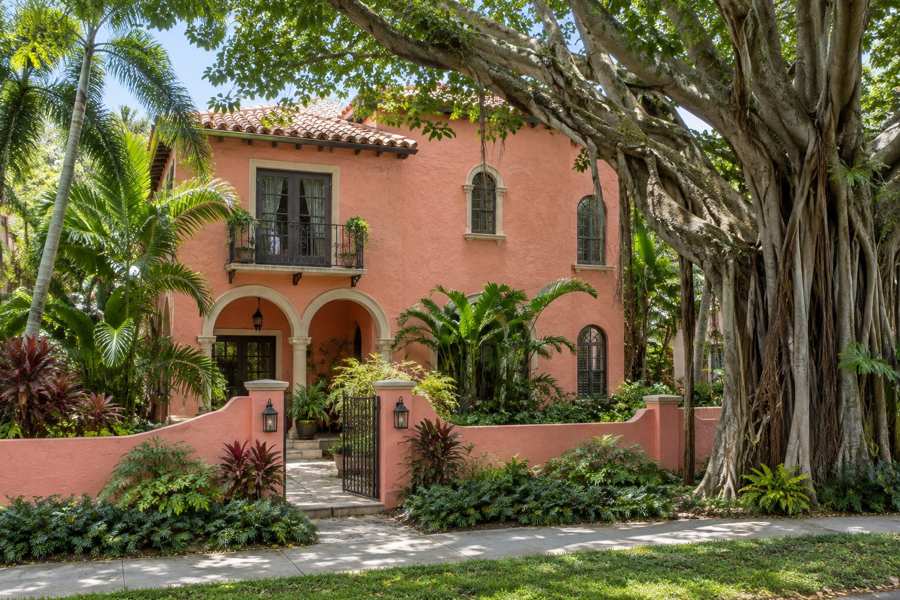
The July report follows a South Grove homeowner who applied this year for historic designation of her two-story 1925 house, built a year before the Coconut Grove Playhouse. She had watched older homes disappear from her neighborhood, replaced by boxy modern houses, and decided to take formal steps to keep one. The city's Historic and Environmental Preservation Board unanimously approved a preliminary evaluation on July 7. The property must still go through further evaluation and a public hearing before it can receive designation.
The timeline in the story is worth noting. The application was filed this year, the preservation board approved a preliminary evaluation in July, and a further evaluation and a public hearing are still ahead. An owner who wants to sell while an application is open has an unfinished question attached to the house, and a buyer will ask about it. That is a reason to learn the status early, whichever way the owner hopes it goes.
The report also describes what the staff found in that house: stucco walls, a tile roof, arched openings, balconies, twisted columns, and evidence that a prominent Miami architect designed it. Those are the features of a Grove house from the 1920s, and a good number of older houses nearby share some of them. The point for an owner is not that every old house qualifies. The point is that the question is a real one, and the answer sits with the city and not with the buyer or the seller.
The rule behind the story matters to anyone who owns an older Grove house. To qualify, the report says, a property must be at least 50 years old and meet the city's criteria for historical, cultural, archeological, paleontological, aesthetic or architectural significance. Once the preservation board designates it, any alteration, new construction or demolition requires a certificate of appropriateness from the city.
For a seller, the consequence is that the same house can mean different things to different buyers. A buyer who plans to renovate may welcome a designation. A buyer who plans to demolish and rebuild cannot, once the designation exists. A seller who is not sure whether the house has been evaluated, or could be, is selling an asset whose buyer pool depends on a fact that has not been checked.
The Census profile shows how many homes could be in play. In the postal area, 7,461 of the 17,933 units were built before 1970, and so are already past fifty years. Another 2,192 were built in the 1970s, and the oldest of those are reaching the line. The report does not say how many Grove houses are designated, and this brief does not guess.
Source: WLRN and Coconut Grove Spotlight, July 22, 2026; U.S. Census Bureau, American Community Survey 2020-2024, table B25034.
Why do two price-cut figures differ by thirty-six points?
The April report calls the market a slight buyer's advantage and lists a market action index of 28, down from 30. It reports a median list price of $3,249,500, a price per square foot of $1,232, 115 average days on market and a median of 46 days. Its headline is that 50% of homes are reducing their price, which it reads as half the market chasing buyers instead of attracting them. It describes three tiers: entry-level homes near $1.4 million, mid-range homes from about $3 million to $4 million, and luxury homes from $4 million to more than $8 million.
The October listing-site report shows 66 active listings, a median asking price of $3.1 million, an average of $1,568 per square foot, 107 average days on market and 14% of listings with a price reduction. It splits the listings by price: 18 (27%) between $1 million and $2 million, 43 (65%) above $2 million, and only five below $1 million. It breaks them down by type, with a median of $5.9 million for single-family homes, $3.3 million for condominiums and $2.8 million for townhouses.
A third explanation is timing. A market that cuts heavily in the spring may stabilize by the autumn because the sellers who would not cut have withdrawn, and the ones who remain are the ones who priced to sell. If that is what happened, a fall in the share of cuts would be a sign of a cleaner list and not of a stronger market. The data here cannot test that, but it shows why a single share should not be quoted without its date and its definition.
The gap between 50% and 14% is not a contradiction, and the sources do not say how each was counted. One may count every listing that cut at any point in the period, and the other may count only the listings with a cut on the day of the snapshot. One covers April and the other October, and one may include condominiums that the other treats differently. The honest reading is that both reports found a meaningful share of sellers adjusting their price, and that the size of the share depends on the definition.
The April report adds a plain statement of what it sees as the cost of waiting: homes that miss the market early lose leverage, and sellers anchored to peak pricing, to what neighbors listed for or to emotional value end up with longer times on the market, more cuts and lower final prices. That is the broker's view, and it comes from a firm that earns a fee when a house sells. It is still a fair description of how a price ladder works, because every cut is visible to the next buyer.
The days on market tell a similar story. The 115-day average in April and the 107-day average in October are close, while the 46-day median in April is far below both. When the average is more than twice the median, a few listings sat for a long time, and the typical listing moved faster than the average suggests. An owner who is told that the market takes 107 days should ask which listings are in the average.
Source: Jenilyn Martinez, April 7, 2026; Casa Simple, October 2026. Brokerage and listing-site content, not independently verified; the two use different definitions.
What do house, condominium and townhouse medians say about the owner's product?
The listing-site report shows how wide the spread is inside one neighborhood. Single-family listings carry a median of $5.9 million, condominiums $3.3 million and townhouses $2.8 million. By bedrooms, one- and studio units are at a median of $1.1 million, two-bedroom units $1.9 million, three-bedroom $3.9 million, four-bedroom $7.5 million and five-bedroom or larger $6.3 million. The report adds that townhouses are the best value by price per square foot, at $944, against a neighborhood average of $1,568.
A median asking price of $3.1 million is therefore a blend of products that do not compete with each other. A buyer of a one-bedroom condominium at $1.1 million is not looking at a four-bedroom house at $7.5 million. For an owner, the right comparison is the narrow one: the same type, the same size and the same street, not the headline.
The broker's April tiers say the same thing in another form. Entry-level homes sit near $1.4 million, the middle tiers near $3 million to $4 million and the top tier above $8 million. The brokerage guide for the neighboring unincorporated area reports a price per square foot of $1,105 for Coconut Grove in the second quarter of 2026, second to its own $1,255 (Guanche, 2026). Figures of $1,105, $1,232 and $1,568 per square foot are all published for the same neighborhood in 2026, and the spread is itself a finding.
For an owner of a single-family house, the useful figure in the October report is the $5.9 million median. For an owner of a condominium it is $3.3 million. For both, the listing count is small: 66 active listings across all types means that a buyer can read every competing listing in an afternoon. A seller should assume that the buyer has done so, and that the buyer knows how long each one has been on the market.
The spread also explains why sellers are told to price correctly from the first day. The April report says there is less room to test the market and that the first two or three weeks are when serious buyers engage and leverage is set. That is the broker's advice and not a measured fact, but it fits the pattern in the numbers: where half the listings are cutting, a high first price tends to cost time.
Source: Casa Simple, October 2026; Jenilyn Martinez, April 7, 2026; Jorge Guanche, July 2026. Brokerage and listing-site content, not independently verified.
Who lives in the postal area?
The postal area has 36,789 residents and 17,933 housing units, of which 15,544 are occupied. Owners live in 8,163 homes (52.5% of occupied) and renters in 7,381 (47.5%). The other 2,389 units, 13.3% of the total, have no usual resident, which is a higher share than in the neighboring postal area and fits a market with second homes and condominiums. Median household income is $103,420, and median gross rent is $2,068 a month, or $24,816 a year, which is 24.0% of the median income.
Owners estimate the median home at $1,022,400, with a margin of error of $76,174, about 7.5%. That figure is far below the median asking prices of $3.1 million to $3.2 million in the two listing reports. The difference is a reminder that the listings are the high end of a stock that also includes older condominiums and modest houses, and that asking prices are not sale prices.
The age profile is unusually even. The 2010s are the largest decade, with 2,513 units (14.0%), followed by the 1950s with 2,396 (13.4%) and the 1970s with 2,192 (12.2%). Since 2020, 801 units (4.5%) have been built. Homes built before 1940 number 1,626, or 9.1%. The median year built is 1977.
The owner share of 52.5% and the renter share of 47.5% are the same as in the neighboring postal area to the south, to the first decimal place, though the two areas differ in size, income and age of stock. It is a coincidence of the estimates and not a rule. It does mean that nearly half of the occupied homes are rented, and that a landlord who owns a Grove house is a realistic seller and a realistic buyer.
A stock that mixes 1920s houses with 2010s towers means that no single age fact describes the area. A seller of a house from the 1930s and a seller of a condominium from 2015 face different buyers, different rules and different carrying costs. The one thing they share is a postal address.
| Indicator | Value | Note |
|---|---|---|
| Population | 36,789 | Whole postal area |
| Housing units | 17,933 | All units |
| Owner-occupied homes | 8,163 | 52.5% of occupied |
| Renter-occupied homes | 7,381 | 47.5% of occupied |
| No usual resident | 2,389 | 13.3% of all units |
| Median household income | $103,420 | Estimate |
| Median gross rent | $2,068 | Monthly |
| Owner-estimated median value | $1,022,400 | Margin of error $76,174 |
Source: U.S. Census Bureau, American Community Survey 2020-2024 five-year estimates, tables B01003, B19013, B25003, B25034, B25064 and B25077.
What does the metro clock add?
Realtor.com publishes listing series for the Miami, Fort Lauderdale and West Palm Beach metropolitan area through the Federal Reserve Bank of St. Louis. They show direction and not the level for one neighborhood. The median days on market rose from 74 in March 2026 to 77 in April, 79 in May, 82 in June and 85 in July.
Active listings stood at 43,929 in May and 40,908 in August, and rose to 41,277 in September (Realtor.com, active listings). The median listing price slipped from $499,000 in May to $490,000 in September (Realtor.com, median listing price). The count of listings with a price reduction fell from 10,942 in March to 8,810 in July (Realtor.com, price reduced listings). That is a count and not a share, and it fell along with the number of listings.
The metropolitan median listing price of $490,000 is far below the Grove's $3.1 million, which makes the point that the Grove is a small luxury pocket inside a large market. The direction is still informative: a slower clock and slightly lower asking prices across the metro are the background against which a Grove seller competes for the attention of high-end buyers.
Insurance and flood exposure are the other costs that a Grove buyer will price. The sources used here do not give figures for the Grove, so this brief gives none. A seller who has the current insurance bill and any elevation or flood documents in a folder gives the buyer something to check, and a buyer who can check a number is less likely to assume a worse one.
None of the series says how long a particular Grove house will take. A reasonable range from the two neighborhood reports is a median of about 46 days and an average of 107 to 115 days, with the caution that the two come from different months and methods. Readers comparing markets can also read the South Miami / High Pines brief and the Santa Rosa Beach brief.
Source: Realtor.com via FRED, Housing Inventory: Median Days on Market, Active Listing Count, Median Listing Price and Price Reduced Count, Miami-Fort Lauderdale-West Palm Beach, FL (CBSA).
What would a private sale change in the Grove?
A direct sale to a buyer who purchases homes off the market changes five things for the seller. There are no showings and no neighbors talking about you selling, which is the privacy benefit in a neighborhood where owners often know each other. The closing date can be flexible, giving time to find a new home. There are no commission costs and no closing costs for the seller. And there are no inspections or repairs, which matters for a house that is a century old.
The fee benefit needs no assumed rate. For every 1% of a sale price that would otherwise go to fees, a sale at $1,400,000 keeps $14,000, a sale at $3,249,500 keeps about $32,495 and a sale at $5,900,000 keeps $59,000. An owner can set whatever percentage applies against a private offer and compare the two on net proceeds.
The historic question deserves a direct answer before any sale. If the house is old, ask whether it has been evaluated, whether an application is pending and whether a designation would change the buyer's plans. A private buyer will ask the same questions, and an owner who has the answers can talk about price sooner.
The trade-off is the usual one. A public listing can bring competing bids, and in a market where 14% to 50% of listings are cutting, a patient buyer has options. A private sale brings one offer, on a date the seller chooses. An owner who values privacy, a settled date and freedom from repairs may prefer it. The choice belongs to the owner.
Source: calculation from stated prices; no commission rate or closing cost is assumed.
Methodology and limitations
Age, tenure, vacancy, income, rent, population and owner-estimated value come from the American Community Survey 2020-2024 five-year estimates for the postal-code area that includes Coconut Grove. The area is wider than the neighborhood. Shares are calculated from published counts, and owner-estimated value carries a stated margin of error.
Days on market, active listings, median listing price and price reduced counts are Realtor.com series published by the Federal Reserve Bank of St. Louis for the Miami-Fort Lauderdale-West Palm Beach metropolitan area. The price-reduced series ends in July 2026 and the others in September 2026. Listing prices are asking prices and not sale prices.
The broker update, the listing-site report and the brokerage guide are commentary. Their medians, price-cut shares and price per square foot were not independently verified and do not use the same definitions. The historic-designation rules are as the news report describes them. The brief makes no forecast and does not estimate what any particular home would sell for.
Conclusion
The public record supports a short list for a Grove owner. Two reports a half-year apart disagree on the share of price cuts by 36 points, which says more about definitions than about the market. Houses over fifty years old can be designated historic, and a designation changes what a buyer can do. More than half of the homes in the postal area predate 1980, and the stock is a mix of ages that no single average describes.
It does not support a price for any one house, and it does not support a forecast. The choice between a public listing and a private sale comes down to how much an owner values a possible higher price against privacy, a flexible closing date, no commission, no closing costs and no inspections or repairs.
Frequently Asked Questions
What makes a house eligible for historic designation?
According to the July report, it must be at least 50 years old and meet the city's criteria for historical, cultural, archeological, paleontological, aesthetic or architectural significance.
What changes after designation?
Any alteration, new construction or demolition needs a certificate of appropriateness from the city.
Why do the price-cut shares differ so much?
The reports come from different months and the sources do not say how each was counted.
Does the metro listing data describe the Grove?
No. It covers the whole Miami to West Palm Beach area and shows direction only.
Does a private sale always beat a public listing?
No. A public listing can attract competing bids. A private sale offers privacy, a flexible closing date, no commission, no closing costs and no inspections or repairs, in exchange for a single offer.
Compare your options before committing. Request a written private offer for your property, with no obligation, then weigh it against your listing plan.
Sources
- Jenilyn Martinez, 2026. Coconut Grove Real Estate Market Update for April 2026. https://jenilynmartinezrealtor.com/blog/coconut-grove-real-estate-market-update-for-april-2026.
- Casa Simple, 2026. Coconut Grove Housing Market Report. https://casasimple.ai/en/market/coconut-grove.
- WLRN and Coconut Grove Spotlight, 2026. With an eye to history, Coconut Grove homeowner seeks to protect her home. https://www.wlrn.org/2026-07-22/with-an-eye-to-history-coconut-grove-homeowner-seeks-to-protect-her-home.
- U.S. Census Bureau, 2026. American Community Survey 2020-2024 five-year estimates, the Coconut Grove area (via Census Reporter). https://censusreporter.org/profiles/86000US33133-33133/.
- Realtor.com, 2026. Housing Inventory: Median Days on Market in Miami-Fort Lauderdale-West Palm Beach, FL (CBSA). https://fred.stlouisfed.org/series/MEDDAYONMAR33100.
- Jorge Guanche, 2026. High Pines and Ponce-Davis: Complete Guide. https://jorgeguanche.com/insights/complete-guide-high-pines-ponce-davis.
- Realtor.com, 2026. Housing Inventory: Active Listing Count in Miami-Fort Lauderdale-West Palm Beach, FL (CBSA). https://fred.stlouisfed.org/series/ACTLISCOU33100.
- Realtor.com, 2026. Housing Inventory: Median Listing Price in Miami-Fort Lauderdale-West Palm Beach, FL (CBSA). https://fred.stlouisfed.org/series/MEDLISPRI33100.
- Realtor.com, 2026. Housing Inventory: Price Reduced Count in Miami-Fort Lauderdale-West Palm Beach, FL (CBSA). https://fred.stlouisfed.org/series/PRIREDCOU33100.
Related research

Seller Guide · October 6, 2026
How to Prepare Point Pleasant Beach Rental Records Before Selling
Separate rental approval, income history and booked stays before comparing sale terms.

Seller Guide · October 6, 2026
How to Prepare Rumson Flood and Waterfront Records Before Selling
Separate flood disclosure, elevation, repairs and waterfront rights before comparing sale terms.

Seller Guide · October 6, 2026
How to Prepare Sarasota Condo Inspection and Reserve Records Before Selling
Separate building condition, reserve funding and resale documents before comparing sale terms.