Market Brief · by Aidan Sowa · October 5, 2026
Is Marco Island Empty or Just Away? Reading the Seasonal Homes, the Condo-House Split and the Clock
Reading the Seasonal Homes, the Condo-House Split and the Clock for Marco Island, FL, with each source dated and its limits noted, for owners weighing a listing against a direct sale.
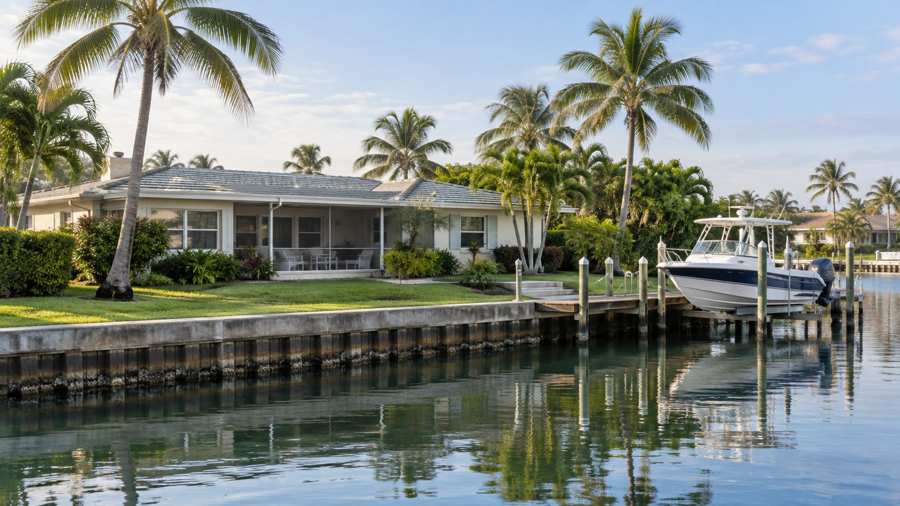
The Census says that 53.5 percent of the housing units in the postal area that includes Marco Island have no usual resident. A reader may take that for abandonment. It is the opposite. It is the signature of a barrier island where most owners live somewhere else for part of the year, in a condominium or house they keep ready for the winter. For a seller, that fact shapes everything: who the neighbors are, who the buyers are and why a headline price can mislead.
This brief sets that profile beside the 2026 sales record. It reads the Census age and tenure profile, an August 2026 report from the local association of REALTORS as relayed by a Naples brokerage, a July article on how condominiums and houses behave differently on the island, and the Naples metropolitan listing series for days on market, inventory, new listings, asking prices and price reductions. It then asks what a private direct sale changes for an owner who is not on the island half the year.
The limits are plain. The Census figures describe a postal area, the brokerage reports are marketing content, and the metropolitan series cover Naples and Marco Island together. Marco Island is small, and a handful of sales can swing a median. The brief says where each limit applies and does not estimate what any particular home would sell for.
Key Findings
- In August 2026 total inventory on Marco Island fell 34% from a year earlier to 378 active listings, sales rose 26% to 68, average days on market fell 43% to 77, the median house price fell 16% to $1.6 million and the median condominium price rose 26% to $663,000 (Downing-Frye Realty, September 2026).
- A July 2026 article says condominiums and single-family homes on the island are different markets, and that a few luxury waterfront closings can swing the median by double digits in a month (Skelly, July 2026).
- In the Census postal area that includes Marco Island, 9,891 of 18,500 housing units (53.5%) have no usual resident, and 7,698 of 8,609 occupied homes (89.4%) are owner-occupied (U.S. Census Bureau, 2020-2024).
- The Naples metropolitan median days on market rose from 87 in April 2026 to 106 in August, an increase of 19 days or 21.8% (Realtor.com, days on market).
- Naples metropolitan active listings fell 31.9% from 6,869 in April to 4,676 in August (Realtor.com, active listings).
Who actually lives on the island?
The postal area has 16,205 residents and 18,500 housing units. Only 8,609 of those units are occupied by a usual resident. Owners occupy 7,698 of them (89.4%) and renters 911 (10.6%). The other 9,891 units, 53.5% of the total, have no usual resident. That is one of the highest shares in this series, higher than the one in four in Boca Raton and the one in eight in West Palm Beach.
The explanation is the one the figures suggest. A home counts as vacant in the Census sense if no one lives in it as a usual residence, and that includes second homes, seasonal homes and units held for rent by the week. On Marco Island, a large share of the condominiums and houses are the winter homes of owners who live in other states for most of the year. The owner share among those who do live there is very high, at 89.4%, which says that the permanent population is overwhelmingly homeowners and not renters.
Median household income is $101,523 and median gross rent is $1,990 a month, or $23,880 a year, which takes 23.5% of the median income. Owners estimate the median home at $896,300, with a margin of error of $80,638, about 9.0%. That is below the August median house price of $1.6 million and above the median condominium price of $663,000, which is what one would expect from a mix of both.
For a seller, the point is that the typical owner is not nearby. A house or condominium that is empty for half the year may have a neighbor who also does not see it. A seller who lists will find that showings, inspections and negotiations all happen at a distance, with an agent or a property manager as the go-between. A seller who sells privately avoids much of that.
| Indicator | Value | Note |
|---|---|---|
| Population | 16,205 | Whole postal area |
| Housing units | 18,500 | All units |
| Owner-occupied homes | 7,698 | 89.4% of occupied |
| Renter-occupied homes | 911 | 10.6% of occupied |
| No usual resident | 9,891 | 53.5% of all units |
| Median household income | $101,523 | Estimate |
| Median gross rent | $1,990 | Monthly |
| Owner-estimated median value | $896,300 | Margin of error $80,638 |
Source: U.S. Census Bureau, American Community Survey 2020-2024 five-year estimates, tables B01003, B19013, B25003, B25064 and B25077.
How old are the buildings?
The age profile is concentrated. The 1980s are the largest decade with 6,064 units (32.8%), followed by the 1990s with 4,257 (23.0%) and the 1970s with 3,990 (21.6%). Together those three decades account for 14,311 units, 77.4% of the stock. The 2000s add 2,185 (11.8%), the 2010s 858 (4.6%) and 205 (1.1%) have been built since 2020. Homes built before 1970 are only 941, 5.1%. The median year built is 1987.
That is the pattern of a place that was developed in a burst. Marco Island's condominium towers and canal-front subdivisions mostly went up in the 1970s through the 1990s, and the stock is now thirty to fifty years old. A building of that age is facing a set of capital items at the same time: roofs, elevators, seawalls, windows, pipes and the structural reviews that Florida law now requires of older condominium buildings.
For owners, that matters in two ways. A condominium owner shares those costs through the association, and special assessments can arrive on a schedule the owner does not control. A house owner on a canal carries the seawall alone. Both are items a buyer will ask about, and both can reduce an offer.
Condominium sales in August rose 58% to 38 closings while home sales rose 8% to 26, which suggests that buyers are active in the condominium segment despite those questions. The brokerage does not say whether the buildings sold were recently renovated, so this brief does not claim a link.
| Decade built | Homes | Share of total |
|---|---|---|
| 1950s | 153 | 0.8% |
| 1960s | 788 | 4.3% |
| 1970s | 3,990 | 21.6% |
| 1980s | 6,064 | 32.8% |
| 1990s | 4,257 | 23.0% |
| 2000s | 2,185 | 11.8% |
| 2010s | 858 | 4.6% |
| 2020 or later | 205 | 1.1% |
Source: U.S. Census Bureau, American Community Survey 2020-2024 five-year estimates, table B25034. Shares are calculated from the published counts; homes built before 1950 are none in this area.
What did the August report show?
The August 2026 report, as summarized by a Naples brokerage, shows an island with shrinking inventory and rising sales. Total inventory was down 34% from August 2025, to 378 active listings. Houses were down 35%, condominiums down 29% and lots down 49%. Sales rose 26% to 68 transactions, with condominiums up 58% to 38 closings, houses up 8% to 26 and lots down 33% to 4.
Average days on market dropped 43% to 77 days. Lots sold 70% faster, houses 49% faster and condominiums were roughly flat, down 4%. Total sales volume reached $95 million, up 17%. Condominium volume rose 162% to $37 million, house volume fell 12% to $55 million and lot volume fell 75% to $3 million.
The median prices moved in different directions. The median house price fell 16% to $1.6 million. The median condominium price climbed 26% to $663,000. The median lot price dropped 72% to $503,000. On the face of it, houses are getting cheaper while condominiums are getting dearer, but a month with 26 house sales and 38 condominium sales is a small sample, and a few large or small closings explain a lot.
The more reliable reading is about supply. Inventory is down by a third while sales are up by a quarter, which says that buyers are finding fewer choices and still buying. For a seller, that is a favorable setup in principle. It is also true that the average sale takes 77 days, which is not fast, and that the August figures were a good month and not a trend.
Source: Downing-Frye Realty, Marco Island August 2026 Market Report, September 23, 2026, which cites the Marco Island Area Association of REALTORS. Brokerage content, not independently verified.
Why are condominiums and houses different markets here?
The July article calls this the single most important thing to understand about the island in 2026. It says that treating condominiums and single-family homes as one market gives the wrong answer, whether pricing a listing or sizing up a purchase. Houses, it says, are behaving like a market that is rebalancing on schedule, and condominiums are something else.
On houses, it cites the Downing-Frye April 2026 report: 44 single-family sales in the month, down 8% from a year earlier, at a median price of $1.7 million, up 8%, and a total sold volume of $103 million, up 5%. Average days on market for houses were 128, up 15%, though the same brokerage had them near 107 in February. Total active inventory on the island was 557 in April.
It also warns about scale: a handful of luxury waterfront closings can swing the island's median price by double digits in a single month, which would be noise in a market the size of Phoenix or Tampa. The advice is to read the trend lines and not any one month. That advice applies to the August report too. The 16% fall in the house median and the 26% rise in the condominium median are monthly figures from a small base.
For an owner, the lesson is to price against the right segment. A house on a canal is not compared with a condominium in a tower, and a sale in one says little about the other. An owner should ask for sales of the same kind of property, the same size and the same location, from the last six months.
Source: Danny Skelly, July 13, 2026, which cites Downing-Frye Realty's April 2026 report and national Realtor.com data. Brokerage content, not independently verified.
What have the Naples series done since April?
The Realtor.com series cover the Naples-Marco Island metropolitan area, which is larger than the island. The median days on market was 87 in April 2026, 95 in May, 102 in June, 104 in July and 106 in August, a climb of 19 days. That is longer than the island's own average of 77 days in August, which shows how different the island is from the wider area.
Active listings fell steadily, from 6,869 in April to 6,238 in May, 5,494 in June, 5,092 in July and 4,676 in August, a decline of 31.9%. New listings fell from 1,196 in April to 976 in May, 814 in June, 848 in July and 808 in August (Realtor.com, new listings), a decline of 32.4%. The median listing price slipped from $699,999 in April to $685,000 in August (Realtor.com, median listing price), a decline of 2.1%.
Listings with a price reduction fell from 1,388 in May to 796 in August and 810 in September (Realtor.com, price reduced listings), a drop of 41.6% from May to September. That fall mirrors the fall in listings and is not evidence that fewer sellers are cutting.
The picture is the same one the island report draws: fewer homes for sale, slower sales across the region, and asking prices that have eased a little. The metropolitan clock of 106 days in August is long, and the island's 77 days is shorter. A seller should expect the island to be faster than the region and slower than the headline suggests.
Source: Realtor.com via FRED, Housing Inventory: Median Days on Market, Active Listing Count, New Listing Count, Median Listing Price and Price Reduced Count, Naples-Marco Island, FL (CBSA).
What do the August numbers look like side by side?
Set the August figures in a row and the shape of the island is easier to see. Condominiums had 38 closings at a median of $663,000, which is about $25.2 million in closings if every unit sold at the median, and the report puts condominium volume at $37 million, so some units sold well above the median. Houses had 26 closings at a median of $1.6 million, about $41.6 million at the median, against a reported volume of $55 million. Lots had 4 closings and $3 million of volume.
The arithmetic shows that both segments have a tail of expensive sales. Condominium volume of $37 million over 38 sales averages about $974,000, well above the $663,000 median. House volume of $55 million over 26 sales averages about $2.1 million, against a median of $1.6 million. In both segments the average is a third to a half above the median, which is the same pattern seen in the other markets in this series: a few large sales lift the average and leave the median behind.
Inventory shows the other side. With 378 listings and 68 sales in the month, the island has about 5.6 months of supply at the August pace. That is a rough figure, because it mixes houses, condominiums and lots, and the brokerage did not publish one. It is a useful check against a headline that says inventory fell by a third: even after the fall, an owner who lists today joins a field of several hundred other listings.
The reader should treat these as back-of-the-envelope figures built from the report's own numbers. They do not replace a comparison of sales of the same kind of property in the same building or on the same street, which is the test an owner can run with the help of a local agent or the county records.
Source: calculation from Downing-Frye Realty, September 23, 2026; the averages and supply figure are derived from the stated counts and volumes and are not published by the source.
What does it cost to hold an island home for another season?
An owner who lives elsewhere carries the cost of an empty home through the year: taxes, insurance, utilities, association dues for a condominium, lawn and pool care for a house, and a manager or a trip to check on it. Those costs run whether or not the home sells, and in a market where the average sale takes 77 days and the regional median takes 106, a listing can add several months.
None of the sources in this brief publishes a carrying cost for the island, so this brief does not give one. An owner can supply the number. If the monthly cost is $2,500, a 77-day sale adds about $6,300 in holding costs and a 106-day sale about $8,700, before any price reduction. The point of the exercise is not the figure, which is the owner's, but that the cost of waiting belongs on the same page as the offer.
Hurricane season adds a further consideration for island owners. A home that sits unsold through a season carries the risk of storm damage and the cost of insurance during the period. The sources here do not quantify it, and it varies by building and lot. It is one more reason some owners prefer a sale with a firm date.
None of this tips the choice toward a private sale on its own. A public listing in a market with falling inventory may attract several bids, and a seller who can wait may do well. A seller who cannot wait, or does not want the home on the market through another season, has the arithmetic above to weigh against the possible gain. Readers comparing markets can also read the West Palm Beach brief and the South Miami / High Pines brief.
Source: illustrative calculation using an assumed monthly holding cost of $2,500; no source in this brief reports a carrying cost.
What does a private sale change for an owner who lives elsewhere?
A direct sale to a buyer who purchases homes off the market changes five things. There are no showings and no neighbors talking about you selling, which is the privacy benefit. The closing date can be flexible, giving time to find a new home. There are no commission costs and no closing costs for the seller. And there are no inspections or repairs, which matters for a thirty-year-old condominium or a canal house with an aging seawall and roof.
For an absentee owner there is a further benefit. A public listing requires access for showings and inspections, a property manager or agent on the island, and often a trip to sign. A private sale can be handled with far fewer visits. That is a convenience, not a financial gain, and an owner can decide what it is worth.
The arithmetic of the fee benefit needs no assumed rate. For every 1% of a sale price that would otherwise go to fees, a sale at $663,000 keeps $6,630, a sale at $896,300 keeps $8,963 and a sale at $1,600,000 keeps $16,000. An owner can set whatever percentage applies against a private offer and compare the two on net proceeds.
The tradeoff is the usual one. A public listing can attract competing bids, and a private sale draws one. In a market where inventory is down a third and sales are up a quarter, a competing bid may well come. An owner who values privacy, a settled date and freedom from repairs may still prefer the private offer. The choice belongs to the owner.
Source: calculation from stated sale prices; no commission rate or closing cost is assumed.
Methodology and limitations
Age, tenure, vacancy, income, rent, population and owner-estimated value come from the American Community Survey 2020-2024 five-year estimates, tabulated for the postal-code area that includes Marco Island. A unit with no usual resident includes second homes, seasonal homes and rentals. Shares are calculated from published counts. Owner-estimated value carries a stated margin of error.
Days on market, active listings, new listings, median listing price and price reduced counts are Realtor.com series published through the Federal Reserve Bank of St. Louis for the Naples-Marco Island metropolitan area. The price-reduced series ends in September 2026, the others in August 2026. Listing prices are asking prices and not sale prices.
The August report and the July article are brokerage content. Their sales, volume and median figures were not independently verified, and an island with a few dozen sales a month can swing sharply. The brief makes no forecast and does not estimate what any particular home would sell for.
Conclusion
For an owner on Marco Island, the public record supports a short list of conclusions. More than half of the housing units have no full-time resident, most of the stock dates from the 1970s through the 1990s, condominiums and houses behave as separate markets, inventory fell by a third in a year, and the wider Naples area has become slower since April.
It does not support a price for any one home, and it does not support a forecast. The choice between a public listing and a private sale comes down to how much an owner values a possible higher price against privacy, a flexible closing date, no commission, no closing costs and no inspections or repairs.
Frequently Asked Questions
Does a vacancy share of 53.5% mean the island is empty?
No. It means the units have no usual resident. Many are seasonal or second homes whose owners live elsewhere part of the year.
Why did the median house price fall while the condominium median rose?
Both are monthly medians from a small sample, and a few large closings can swing them. The July article advises reading trends and not a single month.
Do the Naples series describe Marco Island?
Not directly. They cover the wider metropolitan area, so they show the direction of the regional market.
Why does the age of the buildings matter?
Buildings from the 1970s through the 1990s face roofs, elevators, seawalls and structural reviews at the same time, and buyers ask about each.
Does a private sale always beat a public listing?
No. A public listing can attract competing bids and sometimes a higher price. A private sale offers privacy, a flexible closing date, no commission, no closing costs and no inspections or repairs, in exchange for a single offer.
Compare your options before committing. Request a written private offer for your property, with no obligation, then weigh it against your listing plan.
Sources
- Downing-Frye Realty, 2026. Marco Island August 2026 Market Report: Sales Activity Climbs Despite Shrinking Inventory. https://www.downingfrye.com/marco-island-august-2026-market-report/.
- Danny Skelly, 2026. Marco Island Market Check: Has the Slide Stopped?. https://agentsgather.com/marco-island-market-check-has-the-slide-stopped/.
- U.S. Census Bureau, 2026. American Community Survey 2020-2024 five-year estimates, the Marco Island area (via Census Reporter). https://censusreporter.org/profiles/86000US34145-34145/.
- Realtor.com, 2026. Housing Inventory: Median Days on Market in Naples-Immokalee-Marco Island, FL (CBSA). https://fred.stlouisfed.org/series/MEDDAYONMAR34940.
- Realtor.com, 2026. Housing Inventory: Active Listing Count in Naples-Immokalee-Marco Island, FL (CBSA). https://fred.stlouisfed.org/series/ACTLISCOU34940.
- Realtor.com, 2026. Housing Inventory: New Listing Count in Naples-Immokalee-Marco Island, FL (CBSA). https://fred.stlouisfed.org/series/NEWLISCOU34940.
- Realtor.com, 2026. Housing Inventory: Median Listing Price in Naples-Immokalee-Marco Island, FL (CBSA). https://fred.stlouisfed.org/series/MEDLISPRI34940.
- Realtor.com, 2026. Housing Inventory: Price Reduced Count in Naples-Immokalee-Marco Island, FL (CBSA). https://fred.stlouisfed.org/series/PRIREDCOU34940.
Related research

Seller Guide · October 6, 2026
How to Prepare Point Pleasant Beach Rental Records Before Selling
Separate rental approval, income history and booked stays before comparing sale terms.

Seller Guide · October 6, 2026
How to Prepare Rumson Flood and Waterfront Records Before Selling
Separate flood disclosure, elevation, repairs and waterfront rights before comparing sale terms.

Seller Guide · October 6, 2026
How to Prepare Sarasota Condo Inspection and Reserve Records Before Selling
Separate building condition, reserve funding and resale documents before comparing sale terms.