Data Report · by Aidan Sowa · October 5, 2026
What Is a Palma Ceia Home Worth When Different Sites Give Different Prices? Reading the Sale Medians, the Value Index and the Days on Market
Reading the Sale Medians, the Value Index and the Days on Market for Palma Ceia, FL, with each source dated and its limits noted, for owners weighing a listing against a direct sale.
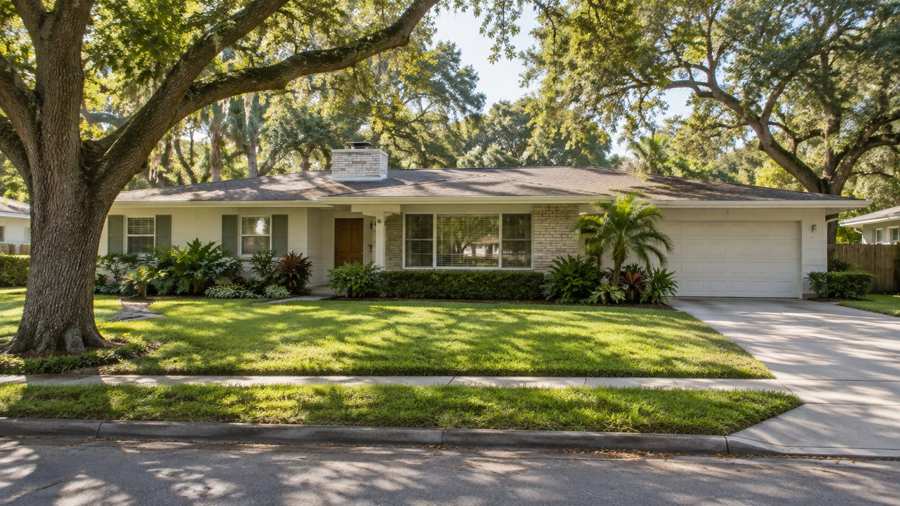
A homeowner in Palma Ceia who opens four home-value sites on the same afternoon will see four different answers, and may reasonably ask which one to believe before choosing a price. The honest reply is that none of them is wrong and none of them is the price of one particular house. Published figures for the neighborhood this summer ranged from a typical value of $920,157 to a trailing median sale price of $1,037,500, a spread of $117,343 on a single neighborhood name (a Tampa brokerage's September 2026 comparison).
That spread is not a data error. It comes from small numbers of sales, from different definitions of the neighborhood, and from different statistics being applied to those sales. This report lays the pieces next to each other: the age of the housing stock, what owners themselves estimate, what four commercial sites publish, and what the Tampa-area listing counts say about how long a seller waits. It then asks what a seller gives up by going to market in public, and what a direct private sale avoids.
The mechanics matter because the choice of price anchor changes the decision. An owner who believes the neighborhood is worth $1.04 million and an owner who believes it is worth $920,000 will make different calls about waiting, repairing and accepting offers.
Key Findings
- The age profile is mixed: 56.4% of the 11,330 housing units in the study area were built before 1980, the median year built is 1973, and 1,800 units (15.9%) went up in 2010 or later (U.S. Census Bureau, 2020-2024).
- Owners in the area estimate their median home at $851,400, with a margin of error of plus or minus $33,908, which is below every commercial figure published for the neighborhood this summer.
- Four sites quoted by a Tampa brokerage in September 2026 gave a typical value between $920,157 and $1,037,500, and one site gave two conflicting year-over-year changes for the same page, down 8% and down 16%.
- The Tampa-St. Petersburg-Clearwater metropolitan area had 17,965 active listings in September 2026, essentially flat from 17,967 in May (Realtor.com, active listings).
- The median listing spent 76 days on the market in September 2026, up from 67 in May (Realtor.com, days on market).
How old is the housing around Palma Ceia?
The Census Bureau tabulates housing by the year each structure was built, and for the postal-code area that holds Palma Ceia and a few neighbors the five-year survey counts 11,330 housing units. The largest single decade is the 1950s, with 2,359 units, or 20.8% of the total. Another 1,952 units (17.2%) date from before 1950. Together the pre-1960 stock is 4,311 homes, 38.0% of everything in the area. Adding the 1960s and 1970s brings the pre-1980 total to 6,387 units, which is 56.4%.
The newer end is not small. The Census counts 1,321 units from the 2010s and 479 from 2020 onward, so 1,800 homes, 15.9% of the area, are less than seventeen years old. That is a large share for a neighborhood where the older cottages and ranch houses get most of the attention. It reflects years of rebuilding on existing lots, which is the pattern a seller will see on nearly any block: a house from 1955 next to a house from 2019 on a lot of similar size.
The median year built, 1973, sits in the middle of that spread and says very little by itself. Two sellers on neighboring streets can hold a 1938 bungalow and a 2021 rebuild, and the median describes neither. For pricing, the decade counts matter more than the median, because they show how many direct comparisons exist. A 1950s ranch house has 2,359 siblings in the area. A house from the 1990s has only 835, and any sale comparison drawn from that decade rests on a thin pool.
The survey also gives tenure. Of 10,746 occupied homes, 8,610 (80.1%) are owner-occupied and 2,136 are rented. An 80% owner share is high for a city neighborhood, and it means most of the homes that change hands are sold by people who live in them, not by investors. Owners who live in a house usually have more freedom over timing than landlords, but they also carry the move itself, which is why flexibility over the closing date tends to matter to them.
| Decade built | Housing units | Share of area |
|---|---|---|
| Before 1950 | 1,952 | 17.2% |
| 1950s | 2,359 | 20.8% |
| 1960s | 1,105 | 9.8% |
| 1970s | 971 | 8.6% |
| 1980s | 1,379 | 12.2% |
| 1990s | 835 | 7.4% |
| 2000s | 929 | 8.2% |
| 2010 or later | 1,800 | 15.9% |
Source: U.S. Census Bureau, American Community Survey 2020-2024 five-year estimates, table B25034, the postal-code area covering Palma Ceia.
What do owners in the area say their homes are worth?
The same survey asks owners to estimate what their home would sell for. The median answer in the study area is $851,400. The survey publishes a margin of error, and here it is plus or minus $33,908, about 4.0% of the estimate. That is a reasonably tight band for an expensive area, and it reflects a large sample of 8,610 owner-occupied homes.
Two cautions apply. Owners answer from memory and from what they have seen on their street, so the figure trails a market that is moving, up or down. And the median covers all owner-occupied homes, including condominiums and smaller older houses, so it should not be read as the price of a renovated or rebuilt property on a prime lot. Across the area, the median household income is $164,355 with a margin of error of $15,351, and the median rent is $1,891, so the area is expensive, but not uniformly at the top of the market.
The owner estimate is also lower than every commercial figure in the next section. That gap is useful. It says that the sites quoting $1 million or more are describing sales that happen in the upper part of the neighborhood, while the middle owner believes the home is worth about $170,000 less. A seller should not assume the middle owner is wrong. The commercial figures describe what recently sold, and recent sales skew toward larger, newer and rebuilt homes.
Source: U.S. Census Bureau, American Community Survey 2020-2024 five-year estimates, tables B25077, B25003, B19013 and B25064.
Why does one neighborhood have five different prices?
A September 2026 comparison by a Tampa brokerage collected the figures that different sites published for the neighborhood within a few weeks of each other. Redfin showed a recent median sale price near $1,019,657. The Zillow Home Value Index put the typical value at $920,157, down 0.5% over a year. Homes.com listed a trailing twelve-month median sale price of $1,037,500, down 16% from the prior twelve months, and on the same page a median list price of $1,099,999 and an average sale price of $1,216,189. Movoto showed a median list price of $989,000, down 10% year over year.
The brokerage points out that two of those figures come from the same provider on the same page and disagree about the direction of the market: one line says prices are down 8% over the year, and another says the median sale price is down 16% over the same window. This is what happens when a small set of high-priced sales is described by an average, a median and a model estimate at once. A single closing at $2.5 million lifts an average sharply, moves a median slightly, and barely touches a model built on every home in the area.
The second cause is geography. The neighborhood name is used for at least four overlapping areas: the historic core around the golf course, one named park section, a western section, and the broader postal area that also takes in Virginia Park and Golfview. A statistic computed over the broader area can differ by tens of thousands of dollars from one computed over the core. The brokerage notes that one market update described the broader area as the hottest and most expensive pocket of Tampa, with prices up nearly 15% over a year, while other sites showed declines.
For a seller, the lesson is to treat any single published number as one reading of a narrow instrument. A second brokerage makes the matching point from the pricing side: a home in the area priced by looking at Tampa as a whole can miss by a wide margin, because lot patterns, architectural fit, condition and block-by-block buyer demand matter more than a citywide median (a second Tampa brokerage, July 2026). Both of these sources are brokerage commentary, not official statistics, and they have a commercial interest in appraisals and listings. The figures they quote are from public sites, which anyone can check.
| Source | Measure | Figure |
|---|---|---|
| Redfin | Recent median sale price | About $1,019,657 |
| Zillow Home Value Index | Typical home value, July 2026 | $920,157 (down 0.5% in a year) |
| Homes.com | Trailing 12-month median sale price | $1,037,500 (down 16%) |
| Homes.com | Median list price, July 2026 | $1,099,999 |
| Movoto | Median list price, August 2026 | $989,000 (down 10%) |
Source: figures as reported in a September 10, 2026 Tampa brokerage article that compares Redfin, Zillow, Homes.com and Movoto.
Is it often said that Tampa-area listings are flooding the market?
It is often said that Tampa has too many homes for sale. The Realtor.com counts for the metropolitan area do not show a flood. Active listings stood at 17,965 in September 2026, 17,996 in August, 18,292 in July, 18,022 in June and 17,967 in May. Over those five months the count never moved more than 325 from its starting point, a range of about 1.8%. A count that stays within two percent for five months describes a market that is carrying a high but steady stock, not one that is filling up.
New listings tell the same story from the supply side. The metropolitan area added 5,534 new listings in July 2026, 6,026 in June, 6,200 in May, 6,148 in April and 6,012 in March. July was the lowest of the five months, 10.7% below May. When new listings fall while the active count holds flat, homes are leaving the market at about the pace they arrive, whether by sale or by withdrawal. The series does not say which.
The asking price confirms a flat picture. The median listing price in the metropolitan area was $397,450 in July 2026, compared with $399,925 in June, $400,000 in May, $406,500 in April and $400,000 in March. The median ask has stayed in a $9,000 band for five months, and the price per square foot slid slowly from $243 in March to $236 in July, a decline of 2.9%.
These are metropolitan figures, and the neighborhood sits far above the metropolitan median. The median ask for Tampa-area listings is roughly $400,000, while the lowest neighborhood figure quoted above is $920,157. So the neighborhood's prices are more than double the median ask across the metropolitan area. A seller in the area is not selling into the median market, and should use these series only for the shape of demand: steady inventory, slightly slower selling, a mild drift in the asking price. No public series splits Tampa listings by neighborhood. For the full monthly history of each series, see the Realtor.com tables for new listings, median list price and price per square foot.
Source: Realtor.com via FRED, Housing Inventory: Active Listing Count, New Listing Count, Median Listing Price and Median Listing Price per Square Foot, Tampa-St. Petersburg-Clearwater, FL (CBSA).
How long does a Tampa-area listing wait for a buyer?
The median days on market for the metropolitan area was 76 in September 2026. In August it was 74, in July 72, in June 68 and in May 67. Each month was longer than the one before, and the September figure is 9 days, or 13.4%, above May. Seasonal slowing is normal in Florida as summer heat and hurricane season reduce showings, so the climb does not by itself prove a weaker market. But it is a consistent direction, and it affects anyone planning a move around a date.
For a seller, 76 days is about eleven weeks, and a median means half of the listings waited longer. That figure counts the time from listing to the point where a contract is signed or the listing is removed, not the time to close. A buyer who signs in week eleven still needs a financing and inspection period afterward. A seller who needs to be out by a certain date and lists in September may be asked to wait until December or later to close.
Waiting also has a carrying cost that the median does not show. Eleven weeks of property tax, insurance, utilities and maintenance on a home worth around $850,000 to $1,000,000 are real money, and so are the showings that go with them. The Realtor.com series do not measure that cost, and this report does not estimate it, because the amounts depend on the house. An owner can add them up from their own bills.
Source: Realtor.com via FRED, Housing Inventory: Median Days on Market, Tampa-St. Petersburg-Clearwater, FL (CBSA).
How many Tampa-area listings have cut their price?
The Realtor.com price-reduction count for the metropolitan area is the one series for this market that stopped updating early: its latest reading is May 2026, when 7,596 listings carried a price cut. That compares with 7,824 in April, 7,938 in March, 7,482 in February and 7,004 in January (Realtor.com, price reductions). The report therefore uses the May active-listing count of 17,967 to put the May cut count in context: 7,596 of 17,967 is 42.3%. More than two listings in five had cut their price by the last month the series reports.
That is a higher share than the one-in-three seen in some other large markets, and it is consistent with the slowing selling times above. It does not say how deep the cuts were. A cut of 1% and a cut of 10% count the same, so a high share can reflect a market that corrects asking prices gently and often. The series also cannot be broken out for a single neighborhood.
The figure should not be projected past May. Since the series stopped, any statement about the current share of price cuts in Tampa would be a guess, and this report does not make one. The pattern from January to May, a cut count that rose from 7,004 to 7,938 and then eased to 7,596, shows a spring peak and a start of decline, and says no more. Readers comparing markets can also read the Cape Coral brief and the Sunset Park brief.
Source: Realtor.com via FRED, Housing Inventory: Price Reduced Count, Tampa-St. Petersburg-Clearwater, FL (CBSA); latest observation May 2026.
What does an owner avoid by selling privately instead of listing?
Everything above describes the public route: pick a price from conflicting sources, list, host showings, wait a median of 76 days, and then manage a buyer's inspection and repair requests. A direct private sale to a buyer such as Maison Off-Market works differently, and the differences are the reason some owners choose it. There are five of them.
The first is privacy. There are no showings and no neighbors talking about you selling, which matters in a neighborhood where, according to the Census, 80.1% of homes are owner-occupied and neighbors know one another. The second is flexible closing dates, which gives the owner time to find a new home instead of working backward from a buyer's deadline. The third and fourth are cost: there is no commission, and no closing costs. The fifth is that the owner avoids inspections and repairs.
The cost points can be put in numbers without assuming a rate. On the owner-estimated median of $851,400, each 1% of the price is $8,514. At the Zillow value of $920,157 it is $9,202, and at the Homes.com trailing median of $1,037,500 it is $10,375. Any commission that would otherwise apply to a sale at these prices is a multiple of those amounts. The same logic applies to closing costs and to a repair bill. These figures are arithmetic on public prices, not a quote, and the cost of any actual sale depends on its terms.
The tradeoff should be stated plainly. A private direct sale is a single offer from a single buyer, so the owner does not get the competing bids that a successful public listing can produce, and in the strongest weeks of the year a public sale might produce a higher gross price. What the owner buys with a private sale is certainty, speed, quiet and control over the date. Whether that is worth more than the possible extra price is the owner's decision, and the data in this report is meant to show how wide the uncertainty on the public side can be.
Methodology and limitations
Housing age, tenure, value, income and rent come from the American Community Survey 2020-2024 five-year estimates, tabulated for the postal-code area that holds Palma Ceia. These areas approximate postal delivery areas and extend beyond the two named neighborhoods, so the figures describe the area, not the neighborhoods alone. Percentages were calculated from the published counts and rounded to one decimal place. Margins of error are those published by the Census Bureau at the 90% confidence level.
Listing counts, days on market, listing prices and price reductions are Realtor.com series published through the Federal Reserve Bank of St. Louis and cover the Tampa-St. Petersburg-Clearwater metropolitan area, not the neighborhood. Different series end in different months, as noted in the text. Listing prices are asking prices, not sale prices. The price-reduction series ends in May 2026 and is not extended.
The five published price figures are quoted from a Tampa brokerage's article of September 10, 2026, and a second brokerage's article of July 23, 2026 is cited for its pricing guidance. Both are marketing content by firms that earn fees from listings. The figures were not independently re-pulled from Redfin, Zillow, Homes.com or Movoto. The report makes no forecast and does not estimate what any particular house would sell for.
Conclusion
For an owner in Palma Ceia, the data support a few narrow conclusions. The neighborhood's published values range over more than $100,000 depending on the site, owners' own median estimate sits below all of them, and the Tampa-area market is steady in supply but slowing in selling time. The housing stock is mixed in age, so comparisons need to be made house by house.
They do not support a single price for any one home, and they do not support a forecast. The choice between a public listing and a private sale comes down to how much an owner values a possible extra price against privacy, a flexible closing date, no commission, no closing costs and no inspections or repairs.
Frequently Asked Questions
Why do home-value sites disagree about Palma Ceia?
They measure different things over different areas. One uses a model of every home, another uses a median of recent sales, and a third uses listing prices. In a small high-priced neighborhood a handful of sales can shift each of those numbers by a different amount.
Is the Census owner estimate of $851,400 what my house is worth?
No. It is the median of all owners' estimates in the area, including condominiums and older smaller homes. It describes the middle of the area, not any one house.
Why does the report use metropolitan listing data?
No public source publishes listing counts, days on market or price cuts for a single neighborhood. Metropolitan series are the nearest open data, and this report labels them as such.
Why is there no current price-cut figure for Tampa?
The Realtor.com price-reduction series for the metropolitan area has not updated since May 2026. The report gives the May figure and does not estimate later months.
Does a private sale always beat a public listing?
No. A public listing can attract competing bids and sometimes a higher price. A private sale offers privacy, a flexible closing date, no commission, no closing costs and no inspections or repairs, in exchange for a single offer.
Compare your options before committing. Request a written private offer for your property, with no obligation, then weigh it against your listing plan.
Sources
- Tampa brokerage (The Lewkowicz Group), 2026. Why Palma Ceia's Median Home Price Depends on Which Site You're Reading. https://thelewkowiczgroup.com/blog/why-palma-ceias-median-home-price-depends-on-which-site-youre-reading.
- U.S. Census Bureau, 2026. American Community Survey 2020-2024 five-year estimates, the Palma Ceia area (via Census Reporter). https://censusreporter.org/profiles/86000US33629-33629/.
- Realtor.com, 2026. Housing Inventory: Active Listing Count in Tampa-St. Petersburg-Clearwater, FL (CBSA). https://fred.stlouisfed.org/series/ACTLISCOU45300.
- Realtor.com, 2026. Housing Inventory: Median Days on Market in Tampa-St. Petersburg-Clearwater, FL (CBSA). https://fred.stlouisfed.org/series/MEDDAYONMAR45300.
- Tampa brokerage (Middleton), 2026. Pricing a Palma Ceia or Virginia Park Home in Today's Market. https://middletontampabay.com/blog/pricing-a-palma-ceia-or-virginia-park-home-in-todays-market.
- Realtor.com, 2026. Housing Inventory: New Listing Count in Tampa-St. Petersburg-Clearwater, FL (CBSA). https://fred.stlouisfed.org/series/NEWLISCOU45300.
- Realtor.com, 2026. Housing Inventory: Median Listing Price in Tampa-St. Petersburg-Clearwater, FL (CBSA). https://fred.stlouisfed.org/series/MEDLISPRI45300.
- Realtor.com, 2026. Housing Inventory: Median Listing Price per Square Feet in Tampa-St. Petersburg-Clearwater, FL (CBSA). https://fred.stlouisfed.org/series/MEDLISPRIPERSQUFEE45300.
- Realtor.com, 2026. Housing Inventory: Price Reduced Count in Tampa-St. Petersburg-Clearwater, FL (CBSA). https://fred.stlouisfed.org/series/PRIREDCOU45300.
Related research

Seller Guide · October 6, 2026
How to Prepare Point Pleasant Beach Rental Records Before Selling
Separate rental approval, income history and booked stays before comparing sale terms.

Seller Guide · October 6, 2026
How to Prepare Rumson Flood and Waterfront Records Before Selling
Separate flood disclosure, elevation, repairs and waterfront rights before comparing sale terms.

Seller Guide · October 6, 2026
How to Prepare Sarasota Condo Inspection and Reserve Records Before Selling
Separate building condition, reserve funding and resale documents before comparing sale terms.