Market Brief · by Aidan Sowa · October 5, 2026
Is a West Palm Beach Bungalow in the Median or in the Barbell? Reading the Clock, the Condo Towers and the Older Block
Reading the Clock, the Condo Towers and the Older Block for West Palm Beach, FL, with each source dated and its limits noted, for owners weighing a listing against a direct sale.
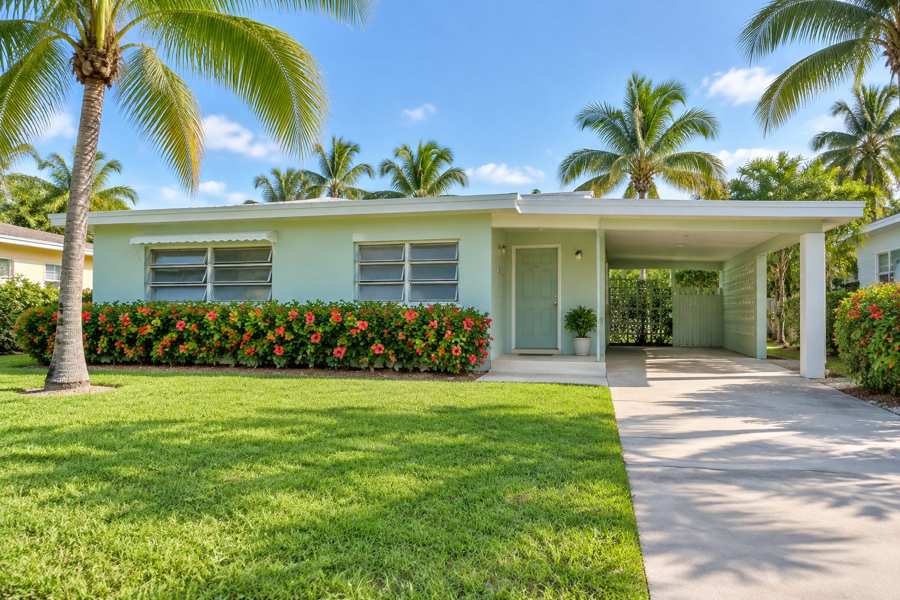
A West Palm Beach owner reading the news sees two cities. In one, a Palm Beach County broker reports a July 2026 median sale price of $424,900, up 18.03% from a year earlier, with homes selling in a median of 44 days. In the other, a different brokerage says the citywide median in the low $400s describes neither of two markets that no longer behave alike: a soft middle, and a top where waterfront condominium towers are recording sales above $70 million. A bungalow from the 1950s is neither a tower unit nor a waterfront estate, and it matters which market it is priced against.
This brief sets those two readings beside the public record. It reads the Census age and tenure profile of the postal area that includes this part of the city, a July 2026 market report, a summer article on the city's two markets, and the South Florida metropolitan listing series for days on market, inventory, asking prices and price reductions. It then asks what a private direct sale changes for an owner of an older house who does not want a long public listing.
The limits are plain. The Census figures describe a postal area and not a single neighborhood, the reports are brokerage content, and the metropolitan series cover Miami, Fort Lauderdale and West Palm Beach together. The brief says where each limit applies and does not estimate what any particular home would sell for.
Key Findings
- In July 2026 West Palm Beach had 247 closed sales, 1,846 active listings and 6.76 months of supply, a median sale price of $424,900 (up 18.03%), an average of $681,838 (up 26.19%), a median of 44 days on market and an average of 79 (Townsend, RE/MAX Excellence, August 2026).
- A July 2026 article puts the June median at $425,000 and average time on market at 80 days, up from 72 a year earlier, and says the middle of the market is soft while the top transacts at numbers few South Florida cities see (Power Duo Group, July 2026).
- In the Census postal area that includes this part of the city, 7,845 of 9,653 homes (81.3%) were built before 1980, and the median year built is 1956 (U.S. Census Bureau, 2020-2024).
- The South Florida metropolitan median days on market rose from 74 in March 2026 to 85 in July (Realtor.com, days on market).
- Active listings in the metropolitan area fell 6.0% from 43,929 in May to 41,277 in September (Realtor.com, active listings).
How old is the stock, and what does that mean for a seller?
The Census counts 9,653 housing units in the postal area that includes this part of West Palm Beach. The 1950s are the largest decade with 2,874 homes, or 29.8% of the total. Homes built in 1939 or earlier add 1,600 (16.6%) and the 1940s add 1,543 (16.0%). Together, homes built before 1960 are 6,017, or 62.3% of the stock. Including the 1960s and 1970s, homes built before 1980 total 7,845, or 81.3%, and the median year built is 1956.
Newer homes are scarce. The 1980s added 854 homes (8.8%), the 1990s 375 (3.9%), the 2000s 323 (3.3%) and the 2010s 256 (2.7%). The Census shows none built since 2020 in this postal area. That is the opposite of the tower pipeline the summer article describes: nearly all new construction in the city is happening in downtown condominium buildings, not in this older fabric.
For an owner, an older house in South Florida has a particular set of questions that a buyer will raise. A house from the 1950s may have an original roof structure, older wiring and plumbing, and a layout built before air conditioning was standard. A buyer's inspection will test all of it, and an insurer's underwriter will ask about the age of the roof. A listing invites those questions from every buyer, and each answer can become a request for a credit.
The age profile also explains why the middle of the market is described as soft. Buyers who want a finished house have plenty of choices and the older houses compete with them. The houses that move are those priced to account for the work. A seller who prefers not to price in repairs, or negotiate them, has a reason to look at a sale without inspections.
| Decade built | Homes | Share of total |
|---|---|---|
| 1939 or earlier | 1,600 | 16.6% |
| 1940s | 1,543 | 16.0% |
| 1950s | 2,874 | 29.8% |
| 1960s | 909 | 9.4% |
| 1970s | 919 | 9.5% |
| 1980s | 854 | 8.8% |
| 1990s | 375 | 3.9% |
| 2000s | 323 | 3.3% |
| 2010s | 256 | 2.7% |
| 2020 or later | 0 | 0.0% |
Source: U.S. Census Bureau, American Community Survey 2020-2024 five-year estimates, table B25034. Shares are calculated from the published counts.
Who lives here, and who owns?
The postal area has 19,780 residents and 8,455 occupied homes. Owners occupy 4,764 of them (56.3%) and renters occupy 3,691 (43.7%). Another 1,198 housing units, 12.4% of the 9,653 total, have no usual resident. Median household income is $87,341 and median gross rent is $1,566 a month, or $18,792 a year. A renter at the median pays 21.5% of the median income.
Owners estimate the median home at $467,100, with a margin of error of $32,455, about 6.9%. That is above the July closed-sale median of $424,900 for the city, which is unusual in this series, and it reflects an area where houses and not condominiums make up most of the stock. The owner estimate is for houses that are mostly detached, and the citywide median pulls in condominium sales.
More than four in ten occupied homes are rented. That has two effects on a seller. A neighborhood with many renters has more sales by landlords who bought for income, and some of those sellers are motivated. And a house that has been rented may show wear that an owner does not see, which a buyer's inspector will.
None of these figures speaks to a single address. They place an older house in a pool of neighbors and competing sellers and let an owner judge whether a quiet sale fits.
| Indicator | Value | Note |
|---|---|---|
| Population | 19,780 | Whole postal area |
| Housing units | 9,653 | All units |
| Owner-occupied homes | 4,764 | 56.3% of occupied |
| Renter-occupied homes | 3,691 | 43.7% of occupied |
| No usual resident | 1,198 | 12.4% of all units |
| Median household income | $87,341 | Estimate |
| Median gross rent | $1,566 | Monthly |
| Owner-estimated median value | $467,100 | Margin of error $32,455 |
Source: U.S. Census Bureau, American Community Survey 2020-2024 five-year estimates, tables B01003, B19013, B25003, B25064 and B25077.
What does the July report say?
A Palm Beach County broker's report on July 2026 gives the plainest snapshot. The city had 247 closed sales and 267 pending listings, with 1,846 active listings at month end. The median sale price was $424,900, up $64,901 or 18.03% from $359,999 a year earlier. The average sale price was $681,838, up 26.19% from $540,341. The absorption rate tightened to 6.76 months, which the broker says moved the market closer to balance, and homes sold in a median of 44 days with an average of 79.
Three oddities in that report deserve attention. First, the median active list price was $324,940, down 4.15%, while the average active list price was $1,226,749, up 31.47%. The gap between a median near $325,000 and an average of $1.2 million says the listing pool includes a small number of very expensive properties. Second, the median sale price is far above the median list price, which suggests the houses and condominiums that sold were different from those that are listed. Third, the gap between the 44-day median and the 79-day average shows a tail of listings that sit.
The broker reads the 18% rise in the median as momentum. A careful owner should read it with caution. A monthly median in a city with 247 sales moves with the mix of what sold, and the report itself notes that the average rose even faster than the median. The summer article, written weeks earlier, called the same market sleepy at the median and extreme at the top.
For a seller, the practical numbers are the 6.76 months of supply and the 79-day average. They mean that a typical house competes with more than six months of other listings, and that the ones that sit take nearly three months. Median days of 44 apply to the houses that sell first.
Source: Rhonda Townsend, RE/MAX Excellence, West Palm Beach July 2026 Market Report, August 2, 2026. Brokerage content, not independently verified.
What is the barbell, and which end is a bungalow on?
The summer article describes a market with two ends. At the center, it says the June 2026 median sale price was $425,000 with homes averaging 80 days on market, slower than the 72 days a year earlier, while the May average home value from an automated model was $405,069, down 1.5%, and a separate May read put the single-family median at $390,000. None of that, it says, suggests a boom.
At the top, it lists a pipeline of towers: a 108-unit building on South Flagler Drive financed with a $600 million debt package, with recorded sales above $70 million; a two-tower project with 168 units whose sales began in March 2026; a 98-unit, 28-story building with a $157 million construction loan closed in February; a Ritz-Carlton residence project on the waterfront with completion targeted for 2027; a $55 million land purchase in May for a block of 100 to 130 units; and a 457-apartment tower under construction. One developer is behind much of it.
The article's conclusion is that a citywide median averages the two ends into a figure that describes neither. An older house a mile or more from the waterfront is not competing with a tower unit that sells for tens of millions. It competes with other older houses, with the soft middle, and with the 80-day clock.
For a seller, the barbell cuts two ways. The luxury pipeline brings money and attention to the city, which can lift nearby land values over time. But it does not lift the price of an older house this month, and the median that headlines quote is not a price for it. A seller should ask for comparable sales of houses of the same age in the same area and ignore the headline.
Source: Power Duo Group, July 23, 2026, which cites public project and loan announcements. Brokerage content, not independently verified.
What have the South Florida series done since spring?
The Realtor.com series cover the Miami-Fort Lauderdale-West Palm Beach metropolitan area and show direction only. The median days on market was 74 in March 2026, 77 in April, 79 in May, 82 in June and 85 in July, a climb of 11 days or 14.9%. The median listing price slipped from $499,000 in May to $490,000 in September (Realtor.com, median listing price), a decline of 1.8%.
Listings with a price reduction fell from 10,942 in March to 8,810 in July (Realtor.com, price reduced listings), a decline of 19.5% that follows the seasonal fall in listings. Active listings fell from 43,929 in May to 40,908 in August, then rose to 41,277 in September.
These are regional figures, but they match the local reports in one respect. The clock is slower than it was in the spring, and the local averages of 79 and 80 days sit close to the regional median of 85. The regional median asking price of $490,000 is above the city's median sale price of $424,900, so the city, in the middle at least, is cheaper than the region around it.
Source: Realtor.com via FRED, Housing Inventory: Median Days on Market, Active Listing Count, Median Listing Price and Price Reduced Count, Miami-Fort Lauderdale-West Palm Beach, FL (CBSA).
What does a 6.76-month supply mean in practice?
Months of supply is a simple ratio: how long it would take to sell the current inventory at the recent pace of sales. The July report puts it at 6.76 months for West Palm Beach, with 1,846 active listings against 247 closings in the month. A figure between five and seven months is usually read as balanced, leaning toward the buyer. The broker says it moved the market closer to balance from the year before.
The arithmetic hides a split. If the towers and the waterfront account for a large share of the 247 closings, then the supply of ordinary houses is longer than 6.76 months, and a seller of a 1950s house is facing a deeper pile than the headline. The reverse could also be true, but the summer article's description of a soft middle points the first way. Neither report breaks the figure down by product, and this brief does not guess.
What a seller can do is count. How many comparable houses are for sale within a mile? How many have sold in the last three months? How many of those had a price cut? Those answers are available to any owner, and they give a local supply figure that is more useful than any citywide ratio. A house that is one of two on the market is in a different position from one that is one of twenty.
The 79-day average also deserves a second look. If the median is 44 days and the average is 79, then some listings sit for more than 100 days. Those listings are the ones that were priced above the market at the start, and their presence raises the apparent time to sell for every house. A seller who prices correctly at the start sells near the median. A seller who tests the market with a high price joins the tail.
Source: calculation from Rhonda Townsend, RE/MAX Excellence, August 2, 2026; the product split is not reported by the source.
What should an owner of an older house gather first?
An owner of an older house can assemble five facts without anyone's help. The age of the roof and whether it has been replaced since the last insurance renewal. The electrical panel and wiring type. The plumbing material. The condition of the windows and doors. And the flood zone and elevation of the lot, which in this part of Florida can decide an insurance quote before a buyer decides to make an offer.
Each of those facts matters because a buyer's inspector and insurer will ask for it. A roof near the end of its life can cost tens of thousands of dollars, and an insurer may decline to cover it. A buyer who learns this late will ask for a credit, and the seller who learns it late will be negotiating from behind. An owner who knows the facts in advance can decide whether to fix, to credit or to sell to a buyer who takes the house as it stands.
The last of those choices is the one a private sale offers. A direct buyer who purchases homes off the market, without inspections or repairs, prices the house with its age included. The offer reflects what the buyer expects to spend, and the seller does not have to bargain over each item. That is the trade, and it is a fair one to weigh against a possible higher bid from a public listing.
The numbers in this brief help frame the choice. A median house sells in about six weeks and an average one in nearly three months. An older house with open items is more likely to be in the longer group. An owner who wants a date and a number can ask which path is more likely to deliver both. Readers comparing markets can also read the Boca Raton Riviera brief and the Marco Island brief.
Source: calculation and analysis from the figures above; no item cost is reported by the sources and none is assumed.
What does a private sale change for an older house?
A direct sale to a buyer who purchases homes off the market changes five things. There are no showings and no neighbors talking about you selling, which is the privacy benefit. The closing date can be flexible, giving time to find a new home. There are no commission costs and no closing costs for the seller. And there are no inspections or repairs, which matters for a house from the 1950s with an original roof structure, older wiring and a long list of items an inspector would flag.
The arithmetic of the fee benefit needs no assumed rate. For every 1% of a sale price that would otherwise go to fees, a sale at $424,900 keeps $4,249, a sale at $467,100 keeps $4,671 and a sale at $681,838 keeps $6,818. An owner can set whatever percentage applies against a private offer and compare the two on net proceeds.
Repairs are the second yardstick. If an inspection of an older house leads to a $15,000 credit, that is 3.5% of a $424,900 sale. A seller who expects such a request can add it to the cost of a public sale. A private buyer who takes the house as is removes the request.
The tradeoff is the same one every private sale carries. A public listing can attract competing bids, and a private sale draws one. In a market with 6.76 months of supply and a soft middle, a competing bid for an older house may not come. An owner who values a settled date and freedom from repairs may find the private offer worth more in the ways that count.
Source: calculation from stated sale prices; no commission rate or closing cost is assumed, and the repair credit is illustrative.
Methodology and limitations
Age, tenure, vacancy, income, rent, population and owner-estimated value come from the American Community Survey 2020-2024 five-year estimates, tabulated for the postal-code area that includes this part of West Palm Beach. The area is not the whole city, so the figures describe the area and not West Palm Beach as a whole. Shares are calculated from published counts. Owner-estimated value carries a stated margin of error.
Days on market, active listings, median listing price and price reduced counts are Realtor.com series published through the Federal Reserve Bank of St. Louis for the Miami-Fort Lauderdale-West Palm Beach metropolitan area. The price-reduced series ends in July 2026 and the others in September 2026. Listing prices are asking prices and not sale prices.
The July report and the summer article are brokerage content. Their medians, averages, absorption rate and project details were not independently verified. The brief makes no forecast and does not estimate what any particular home would sell for.
Conclusion
For an owner in West Palm Beach, the public record supports a short list of conclusions. Four in five homes in the surrounding area predate 1980, more than four in ten occupied homes are rented, the citywide median hides a soft middle and a tower-driven top, the average listing takes nearly three months, and the regional clock has stretched since spring.
It does not support a price for any one house, and it does not support a forecast. The choice between a public listing and a private sale comes down to how much an owner values a possible higher price against privacy, a flexible closing date, no commission, no closing costs and no inspections or repairs.
Frequently Asked Questions
Why is the average sale price so far above the median?
A few very expensive sales lift the average. The July report shows an average of $681,838 against a median of $424,900.
Does the 18.03% rise in the median mean my house gained that much?
Not necessarily. A monthly median moves with the mix of homes that sold, and the same report shows the average rising faster.
Do the South Florida series describe West Palm Beach?
Not directly. They cover a large metropolitan area, so they show the direction of the wider market.
Do the new towers lift the price of an older house?
The summer article describes them as a separate market. An older house competes mainly with other older houses.
Does a private sale always beat a public listing?
No. A public listing can attract competing bids and sometimes a higher price. A private sale offers privacy, a flexible closing date, no commission, no closing costs and no inspections or repairs, in exchange for a single offer.
Compare your options before committing. Request a written private offer for your property, with no obligation, then weigh it against your listing plan.
Sources
- Rhonda Townsend, RE/MAX Excellence, 2026. West Palm Beach July 2026 Market Report. https://rhondatownsendrealtor.livinginpalmbeachcountyfl.com/blog/west-palm-beach-july-2026-market-report/.
- Power Duo Group, 2026. West Palm Beach Has Two Housing Markets Right Now and the Median Price Is Hiding One of Them. https://powerduogroup.com/blog/west-palm-beach-has-two-housing-markets-right-now-and-the-median-price-is-hiding-one-of-them.
- U.S. Census Bureau, 2026. American Community Survey 2020-2024 five-year estimates, the West Palm Beach area (via Census Reporter). https://censusreporter.org/profiles/86000US33405-33405/.
- Realtor.com, 2026. Housing Inventory: Median Days on Market in Miami-Fort Lauderdale-West Palm Beach, FL (CBSA). https://fred.stlouisfed.org/series/MEDDAYONMAR33100.
- Realtor.com, 2026. Housing Inventory: Active Listing Count in Miami-Fort Lauderdale-West Palm Beach, FL (CBSA). https://fred.stlouisfed.org/series/ACTLISCOU33100.
- Realtor.com, 2026. Housing Inventory: Median Listing Price in Miami-Fort Lauderdale-West Palm Beach, FL (CBSA). https://fred.stlouisfed.org/series/MEDLISPRI33100.
- Realtor.com, 2026. Housing Inventory: Price Reduced Count in Miami-Fort Lauderdale-West Palm Beach, FL (CBSA). https://fred.stlouisfed.org/series/PRIREDCOU33100.
Related research

Seller Guide · October 6, 2026
How to Prepare Point Pleasant Beach Rental Records Before Selling
Separate rental approval, income history and booked stays before comparing sale terms.

Seller Guide · October 6, 2026
How to Prepare Rumson Flood and Waterfront Records Before Selling
Separate flood disclosure, elevation, repairs and waterfront rights before comparing sale terms.

Seller Guide · October 6, 2026
How to Prepare Sarasota Condo Inspection and Reserve Records Before Selling
Separate building condition, reserve funding and resale documents before comparing sale terms.