Market Brief · by Aidan Sowa · October 5, 2026
Is University Park Down a Little or Down a Lot? Reading Both Sold Medians and Their Different Declines
Reading Both Sold Medians and Their Different Declines for University Park, NC, with each source dated and its limits noted, for owners weighing a listing against a direct sale.
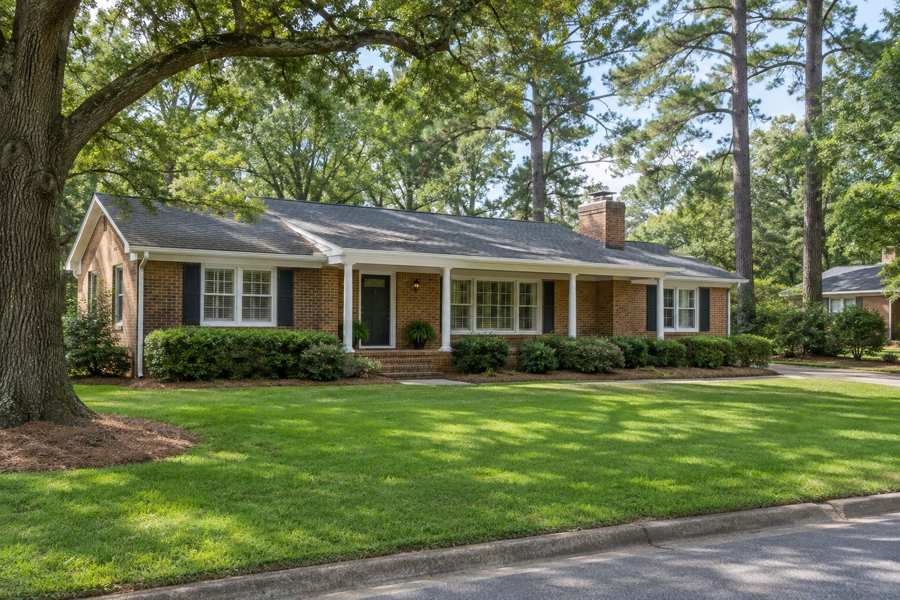
Is University Park down 23% or down 12.6%? Two pages for the same Raleigh neighborhood give those answers. Homes.com shows a median sale price of $825,000 over the last 12 months, down 23% on the previous 12 months. Realtor.com shows a median sold price of $893,750 for September 2026, down 12.59% on the year. A third figure sits above both: the same Homes.com page shows a median list price of $970,000, and its question and answer section says prices in University Park are down 10% over the last 12 months. One page, then, gives two different declines.
The counts differ as well. Realtor.com shows 38 homes for sale and a median of 75 days on market, with a monthly rise in supply of 15.15%. Homes.com shows 25 homes for sale, 76 days on market and 1.90 months of supply. Realtor.com calls University Park a buyer's market in one place and a warm market in another. A seller who wants to know whether the neighborhood is rising, falling or flat will find that the answer depends on which page is open.
Maison Off-Market buys luxury homes and estates directly from their owners and speaks only to sellers. We do not appraise homes, and nothing here is a valuation. This brief sets the published figures side by side, shows what each one measures, adds a Census cut on when owners and renters moved in that differs from the one used in the neighboring West Raleigh brief, and states what a percentage of a price is worth in dollars. Every figure is attributed, every calculation is this brief's own arithmetic and every inference is labeled as one.
Key Findings
- Realtor.com showed, for September 2026, a median listing price of $925,000 (down 19.60% on the year), a median sold price of $893,750 (down 12.59%), $454 per square foot, 38 active listings, 75 days on market and a median rent of $2,138 (Realtor.com, University Park neighborhood market data).
- Homes.com showed a median sale price of $825,000 over 12 months, down 23%, a median single-family sale price of $1,005,000, a median townhouse price of $860,000, 159 sales, 25 homes for sale, a median list price of $970,000 and 1.90 months of supply (Homes.com, University Park homes for sale and market trends).
- A Raleigh brokerage blog dated August 27, 2026 put the city median between about $420,000 and $459,000, said homes sell at 97.5% to 98.4% of list, and said listings above roughly $700,000 carry the most inventory and the longest time on market of any price band (Local brokerage blog, Raleigh real estate market 2026).
- The Wake County Register of Deeds showed a countywide median of $440,000 for August, after rebuilding its report method (Wake County Government, median real estate price report). Resideline showed $422,000 for all of Raleigh across 3,243 closings in six months (Resideline, Raleigh housing market 2026).
- The Census shows that of 4,592 owner-occupied homes in the postal area, 1,957 (42.6%) have owners who moved in before 2010, and that of 5,849 rented homes, 3,791 (64.8%) have renters who moved in since 2020.
Is the University Park median down 23%, 12.6% or 10%?
Three declines are published for University Park, and they cover different periods. Homes.com computes a median sale price of $825,000 for the last 12 months and compares it with the 12 months before, a fall of 23%. Realtor.com compares a single month, September 2026, with the same month a year earlier, a fall of 12.59%. The Homes.com question and answer section says prices are down 10% in the last 12 months, and the page's own table says negative 23%. This brief takes the table, and it flags the sentence.
The first comparison is the longer one, and it means the 12 months to now were 23% lower than the 12 months before. If that is right, the previous 12-month median was about $1,071,000, a figure this brief infers by working back from $825,000 and 23%, and it is not published. A fall from about $1,071,000 to $825,000 is a large change for a neighborhood where, on the same page, 159 homes sold in a year. A neighborhood with 159 sales a year has about 13 a month, and the median of a small group changes when the mix of homes changes. A shift from more single-family homes to more condominiums in the sales would pull a median down with no change in the price of any one home.
The Realtor.com sold median of $893,750 is 8.3% above the Homes.com $825,000, a gap this brief computes. The two are not the same measure. One is a September figure and the other is a 12-month median. The Realtor.com monthly change from August is up 11.72%, which shows how much a single month can move. A seller who read the September median as a trend would conclude that prices jumped by more than 11% in a month, and the same page says they fell more than 12% in a year.
Neither page says which homes it counts. Homes.com describes University Park as part of West Raleigh, and Realtor.com lists it as a separate neighborhood with its own table. The neighboring West Raleigh brief shows how much the same name can cover, and the postal area behind this neighborhood is the same as the one behind that brief. A seller should treat both medians as a band, and ask how many homes of the same type, size and condition sold in the last year in the same few streets.
| Source | Figure | What it measures |
|---|---|---|
| Homes.com | $825,000 | Median sale price, 12 months, down 23% |
| Realtor.com | $893,750 | Median sold price, September, down 12.59% |
| Realtor.com | $925,000 | Median listing price, September, down 19.60% |
| Homes.com | $970,000 | Median list price, shown on the page |
| Homes.com | $1,005,000 | Median single-family sale price, 12 months |
Sources as cited. The measures, periods and areas differ and the figures are not directly comparable. Commercial content; not independently verified.
What do home types and asking prices say about the neighborhood?
The Homes.com page breaks the 12-month sales by type, and the spread is wide. The median single-family sale price is $1,005,000, the median townhouse price is $860,000, the median two-bedroom price is $668,400 and the median one-bedroom price is $510,500. The single-family median is 1.97 times the one-bedroom median, a ratio this brief computes, and 21.8% above the all-types median of $825,000. The all-types median is therefore a blend, and the page does not show how many sales sit in each group.
The page describes the housing as ranging from midcentury modern homes of the 1950s to newly built brick condominiums and mixed-use developments. Its listings include new construction condominiums, new construction houses and older bungalows. That mix is why a single median misleads. A seller of an older bungalow on a tree-lined street and a seller of a new condominium near the shopping district sell different products to different buyers, and a blended median describes neither of them.
The asking prices tell a similar story. The Homes.com median list price is $970,000 and the Realtor.com median listing price is $925,000, which is 4.6% lower, a gap this brief computes. The Homes.com answer to a question about what a buyer would need to earn uses the $970,000 figure and calls it the median home price. A list price is not a price that anyone has paid, and the same page shows a median sale price of $825,000. The difference between the median list price and the median sale price is $145,000, or 17.6% of the sale price.
Realtor.com's neighborhood table gives a narrower view of supply. Forest Hills has 9 homes for sale with a listing median of $930,000 and $432 per square foot. Wilmont has 6, Bedford Heights has 4, Beaver Dam has 3, and College Crest, Dixie Forest and Fairground Park have 1 each. Those named areas add to 25, which is the same as the Homes.com count, though the Realtor.com neighborhood total is 38. Several other named areas on the page, including Bagwell, Blue Moon Ridge, Fairmont and Grove Park, have no homes for sale.
Source: Homes.com and Realtor.com, as cited above. Percentages and ratios are this brief's arithmetic.
How long does a University Park sale take, and how many homes compete?
The pages agree on about 75 days. Realtor.com shows a median of 75 days on market, down 18.22% on the year and up 12.18% on the month. Homes.com shows 76 days and compares it with a national average of 48. The agreement is close enough to suggest the pages draw on the same listing data, and not close enough to prove it. A median of 75 days is half again as long as the 48 days Homes.com quotes for the country, a ratio of 1.56 that this brief computes.
The postal areas around the neighborhood do not match the neighborhood figure. Realtor.com's table of days on market by postal area shows 53, 72, 85 and 88 days. The area that the sheet pairs with University Park has the longest, at 88 days, up 2.70% on the year, while the neighborhood figure of 75 days is down 18.22%. The neighborhood is a subset of the area and the two measures move in opposite directions on the year, which is possible when the neighborhood has a different mix of homes and a smaller number of sales.
The counts of homes are 38 on Realtor.com and 25 on Homes.com. The Homes.com count and its 159 sales in 12 months give the months of supply the page states, 1.90. The check is simple: 159 sales over 12 months is 13.25 a month, and 25 homes divided by 13.25 is 1.89. If the Realtor.com count of 38 is used with the same sales rate, the supply is 2.9 months, an inference this brief makes. Both counts imply a short supply, the pages do not say how they define a balanced market, and a Realtor.com label of a buyer's market sits oddly beside them.
Realtor.com shows rentals at 56, up 21.15% on the year and up 23.53% on the month, with a median rent of $2,138, up 6.53% on the year. The named areas list 10 rentals in total. For an owner who lives in the home, the rentals are a reminder of how many nearby homes are held by investors and students. The Homes.com page puts the median age at 29 and says 74.4% of residents are college graduates, and it describes a college-town feel because of the proximity to North Carolina State University and Meredith College.
The sale-to-list ratio on Realtor.com is 98%, with homes selling 1.54% under the asking price. On a home that sells at $893,750 a 1.54% gap is about $13,800, a figure this brief computes. The Raleigh brokerage blog says ratios of 97.5% to 98.4% are typical for the city, so the neighborhood sits inside the city range. It also warns that the figure hides wide variation between well-prepared listings and stale ones.
| Source | Figure | What it measures |
|---|---|---|
| Realtor.com | 75 days | Median days on market, neighborhood |
| Homes.com | 76 days | Average days on market |
| Realtor.com | 88 days | Median days on market, the sheet postal area |
| Realtor.com | 38 | Homes for sale, neighborhood |
| Homes.com | 25 | Homes for sale |
| Homes.com | 1.90 | Months of supply |
Sources as cited. Commercial content; not independently verified.
When did University Park owners and renters move in?
The Census asks each household when it moved in, and the answer for this postal area shows a place that has turned over. Of 4,592 owner-occupied homes, 601 (13.1%) have owners who moved in in 1989 or earlier, 495 (10.8%) in the 1990s, 861 (18.8%) in the 2000s, 1,802 (39.2%) in the 2010s, 766 (16.7%) in 2020 to 2022 and 67 (1.5%) in 2023 or later. Owners who moved in before 2010 number 1,957, or 42.6%. Owners who moved in since 2010 number 2,635, or 57.4%.
The renters are newer still. Of 5,849 renter-occupied homes, 1,005 (17.2%) have renters who moved in in 2023 or later, 2,786 (47.6%) in 2020 to 2022 and 1,931 (33.0%) in the 2010s. Only 127 renters, or 2.2%, moved in before 2010. Renters who moved in since 2020 number 3,791, or 64.8%. That is what a college-town rental market looks like, and it is why the median age on Homes.com is 29.
The owner figures matter to a seller in a specific way. An owner who bought in the 2010s, and 1,802 did, bought longer ago than the 766 who bought in 2020 to 2022. This brief infers that a median sale price that fell 12.59% or 23% means something different for each group, though no page says so. Those 766 owners are 16.7% of owners. The 601 owners who moved in during or before 1989 may own a home with little or no mortgage, and the choice of when to sell is theirs alone.
The Census data on ownership also gives a split that differs from the Homes.com figure. Homes.com says 65% of residents rent and 35% own. The Census figures for the postal area show 56.0% of occupied homes rented and 44.0% owned, a difference of 9 points that this brief computes. The Homes.com figure is for the neighborhood and the Census is for the postal area, so the two are not in conflict. They suggest, as an inference, that the neighborhood is more rented than the area around it.
The Census median owner-occupied value for the postal area is $707,800, with a margin of error of $49,820, or 7.0%. It is the median of what owners say their homes are worth, in an area that includes parts of other neighborhoods. It is 14.2% below the Homes.com sale median of $825,000, a gap this brief computes. The two cover different areas and periods, and the gap is one more reason to read each figure as a band and not a point.
Source: Census Reporter, American Community Survey 2020-2024 five-year estimates, tables B25038, B25077, B25003 and B19013. Percentages and ratios are this brief's arithmetic.
What does the luxury tier of Raleigh look like around University Park?
The Raleigh brokerage blog says the high end behaves like a separate market. It puts the luxury threshold at about $630,000 to $700,000 and the rarefied tier at about $1.3 million or more, and it says listings above roughly $700,000 carry the most inventory and the longest time on market of any price band in Raleigh. It also says cash-heavy buyers cushion the upper tiers from mortgage rates. These are the blog's own statements, and the blog is a brokerage's marketing page, not a statistical release.
University Park sits on the upper side of that line. The Realtor.com sold median of $893,750 and the Homes.com single-family median of $1,005,000 are both above the blog's $700,000 line, and the Realtor.com listing median of $925,000 is too. By the blog's own account, a home priced in that range is in the band with the most inventory and the slowest sales, which fits a neighborhood median of 75 days, against the 22 days from listing to contract that Resideline shows for Raleigh as a whole.
The county data add the other end. The Wake County Register of Deeds shows 234 transactions between $1 million and $30 million in August, and 5,954 of 6,191 transactions at or under $1 million. A deed-based count of homes above $1 million is therefore a small share, about 3.8% of the month's recorded transactions, a share this brief computes and one that includes commercial property. A home above $1 million in University Park is part of a thin tier, and its buyers are few. Readers comparing markets can also read the West Raleigh brief and the Wake Forest brief.
Sources as cited above. Percentages and ratios are this brief's arithmetic. Commercial content; not independently verified.
What should an owner ask, and what does a private sale change?
Ask which area a figure covers: the neighborhood, the postal area, all of Raleigh or all of Wake County. Ask for what period it is, a single month or 12 months, and whether it is a list price or a sale price. Ask which homes are counted, single-family homes, townhouses or condominiums. A seller who has the answers can read a page, and a seller who does not will find that two pages give two declines.
A private sale changes how a home reaches a buyer. With Maison Off-Market there are no showings and no neighbors talking about a sale, the closing date can be flexible so that an owner has time to find a new home, there are no commission costs, there are no closing costs and there are no inspections or repairs. For an owner whose home dates from the 1950s, one of the housing types the Homes.com page names for the neighborhood, a sale without inspections or repairs removes a list of work that a buyer would otherwise raise. This brief does not claim that a private sale always brings a higher price than a public listing.
Fee arithmetic shows what the commission point means in dollars, without assuming any rate. Each 1% of a sale price is $8,250 at $825,000, $8,937.50 at $893,750 and $10,050 at $1,005,000. At 3% those amounts are $24,750, $26,812.50 and $30,150. At 5% they are $41,250, $44,687.50 and $50,250. These are illustrations of what a percentage means on the figures in this brief, and they are not a statement of what any agent charges or what any sale would cost.
Timing is the other thing an owner controls. A public listing starts a clock, and the pages above show 75 or 76 days for the neighborhood and 88 for the postal area. A private sale lets the owner choose the closing date, which matters most to owners who need to find the next home first, or who would rather close outside the cycle of the university calendar.
Privacy is often the first thing owners raise. A public listing puts photographs, a price and every price change in front of anyone, and in a neighborhood where two pages show falls of 12.59% and 23% the price history of a home is the first thing a buyer reads. A private sale keeps those details out of view. That is a matter of preference and not a claim about price.
If you are weighing a sale of a University Park home, one conversation costs nothing and obliges you to nothing. We ask about the home, the timing you would like and what you would need from a buyer, and we say plainly whether a private sale fits.
If you would like a private, no-obligation offer for a University Park home, call 401-219-4207 or use the contact form on this site.
Methodology and limitations
Prices, days on market, counts and ratios come from a Realtor.com page with indicators as of September 2026, a Homes.com page with 12-month figures and no stated date, a Raleigh brokerage blog dated August 27, 2026, a Resideline page updated October 2, 2026 and a Wake County Register of Deeds release for August 2026 whose headline names July. The pages cover different periods and boundaries, and most are commercial pages, so they are not independent of each other. The Homes.com page gives a 10% decline in text and a 23% decline in its table, and calls a list price the median home price in its text; both are flagged above. The Census figures are five-year estimates and lag the market.
Conclusion
The University Park record shows sold medians of $825,000 and $893,750, listing medians of $925,000 and $970,000, declines of 12.59% and 23%, and 25 to 38 homes for sale with waits of 75 to 88 days. The pages differ because they measure different periods and homes, and the Census shows that 42.6% of owners moved in before 2010 while 64.8% of renters moved in since 2020.
Frequently Asked Questions
What is the median home price in University Park, Raleigh?
Pages differ. Homes.com shows a median sale price of $825,000 over 12 months, Realtor.com shows $893,750 for September 2026, and Homes.com shows a median single-family sale price of $1,005,000.
Are home prices falling in University Park?
Homes.com shows a fall of 23% in the median sale price in its table, and a fall of 10% in its text. Realtor.com shows a sold median down 12.59% on the year and a listing median down 19.60%.
How long do homes take to sell in University Park?
Realtor.com shows a median of 75 days on market and Homes.com shows 76 days. Realtor.com shows 88 days for the postal area the sheet pairs with it.
How much is 1% of a University Park home price?
It is $8,250 at $825,000 and $8,937.50 at $893,750. At 3% those amounts are $24,750 and $26,812.50. This is arithmetic and not an agent's rate.
Can I sell my University Park home privately?
Yes. Maison Off-Market buys luxury homes and estates directly from their owners with no showings, flexible closing dates, no commission costs, no closing costs and no inspections or repairs. Call 401-219-4207 or use the contact form.
Compare your options before committing. Request a written private offer for your property, with no obligation, then weigh it against your listing plan.
Sources
- Realtor.com, 2026. University Park Neighborhood Housing Market Data. https://www.realtor.com/local/market/north-carolina/raleigh/university-park.
- Homes.com, 2026. University Park Real Estate and Homes for Sale. https://www.homes.com/raleigh-nc/university-park-neighborhood/.
- Local brokerage, 2026. Raleigh NC Real Estate Market 2026. https://steeloak.co/raleigh-nc-real-estate-market-2026-prices-inventory-luxury-homes-what-buyers-and-sellers-should-know/.
- Wake County Government, 2026. Median Real Estate Price Report. https://www.wake.gov/news/wake-countys-median-real-estate-price-decreased-18500-july-2026-ending-month-440000.
- Resideline, 2026. Raleigh Housing Market 2026. https://resideline.com/blog/raleigh-housing-market-2026.
Related research

Seller Guide · October 6, 2026
How to Prepare Point Pleasant Beach Rental Records Before Selling
Separate rental approval, income history and booked stays before comparing sale terms.

Seller Guide · October 6, 2026
How to Prepare Rumson Flood and Waterfront Records Before Selling
Separate flood disclosure, elevation, repairs and waterfront rights before comparing sale terms.

Seller Guide · October 6, 2026
How to Prepare Sarasota Condo Inspection and Reserve Records Before Selling
Separate building condition, reserve funding and resale documents before comparing sale terms.