Market Brief · by Aidan Sowa · October 5, 2026
Is West Raleigh a Seller's Market or a Buyer's Market? Reading a Sold Median and a Falling Listing Median
Reading a Sold Median and a Falling Listing Median for West Raleigh, NC, with each source dated and its limits noted, for owners weighing a listing against a direct sale.
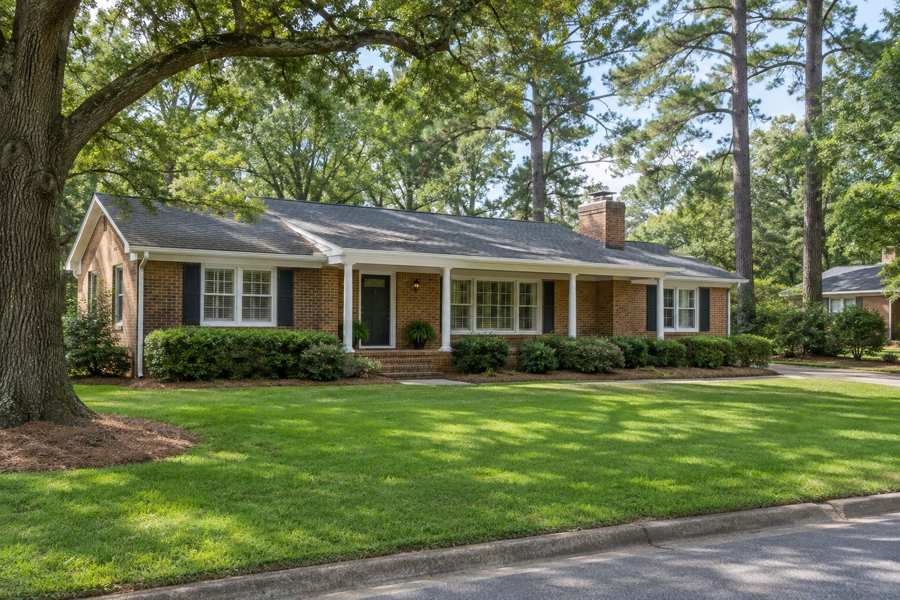
Is West Raleigh a seller's market or a buyer's market? The Realtor.com page for the neighborhood says both, one paragraph apart. Its summary for September 2026 says homes sold for about the asking price, with a sale-to-list ratio of 99%, and that West Raleigh is a seller's market because more people want to buy than there are homes available. Its quick insights say the median listing price fell 20.25% on the year, to $315,000, which signals that buyers have greater negotiating leverage. A seller who reads only one of the two paragraphs will take away the opposite of the other.
The numbers underneath are no easier. The same page shows a median sold price of $372,500, down 11.15% on the year, and a median listing price of $315,000, which is 15.4% below the sold figure, a gap this brief computes. A listing median below a sold median is a sign, this brief infers, that the two medians describe different homes. A Redfin page for the neighborhood shows a median sale price of $409,000 for March 2026, up 10.0% on the year. One page has prices falling by double digits and the other has them rising by 10%.
Maison Off-Market buys luxury homes and estates directly from their owners and speaks only to sellers. We do not appraise homes, and nothing here is a valuation. This brief sets the published figures for West Raleigh side by side, shows what each one measures, adds Census counts on the age and ownership of homes, and states what a percentage of a price is worth in dollars. Every figure is attributed, every calculation is this brief's own arithmetic and every inference is labeled as one.
Key Findings
- Realtor.com showed, for September 2026, a median listing price of $315,000 (down 20.25% on the year), a median sold price of $372,500 (down 11.15%), $221 per square foot, 130 active listings, 51 days on market and a median rent of $1,561 (Realtor.com, West Raleigh neighborhood market data).
- Redfin showed a median sale price of $409,000 for March 2026, up 10.0% on the year, $237 per square foot, 48 homes sold against 68 a year earlier, 38 days on market against 30, a sale-to-list ratio of 97.8% and a Compete Score of 67 out of 100 (Redfin, West Raleigh housing market).
- Rocket's market report for the neighborhood is dated April 2025, which is 17 months before the Realtor.com figures. It showed a median sold price of $405,000, 107 homes for sale and 26 homes sold or pending, of which 54% sold under asking (Rocket, West Raleigh housing market report).
- For all of Raleigh, Resideline showed a median closing price of $422,000 across 3,243 closings in the last six months, with the middle half of sales between $310,000 and $650,000 (Resideline, Raleigh housing market 2026). The Wake County Register of Deeds showed a countywide median of $440,000 for August (Wake County Government, median real estate price report).
- The Census describes a postal area with a median household income of $96,775 and a median owner-occupied value of $707,800, where 56.0% of occupied homes are rented and 34.7% of all homes were built before 1980.
Why does one page call West Raleigh a seller's market and a buyer's market?
The label comes from the sale-to-list ratio and the count of homes for sale, and the advice comes from the price change. The Realtor.com page says West Raleigh homes sold for about the asking price in September, a ratio of 99%, and calls that a seller's market. It then says the median listing price fell 20.25% on the year and that buyers have greater negotiating leverage. Both statements are generated from the same table, and neither is a forecast. A ratio of 99% describes the homes that sold. A falling listing median describes the homes that are on the market, and a different mix of homes on the market can move the median even if no seller changed a price.
The page also contradicts its own table on supply. The table shows 130 active listings, with a monthly change of negative 4.62% and a yearly change of 5.98%. The quick insights paragraph says active listings are down year over year by 4.62%, which is the monthly figure, and says supply is tighter. The yearly figure in the table is an increase. A reader who takes the paragraph at its word will think supply has fallen over the year when the table says it has risen about 6%. This brief uses the table, and it flags the paragraph as a mislabel.
The days on market figure has a similar pattern. The table shows 51 days, up 18.61% on the month and down 15% on the year. The insights paragraph says the pace is faster than a year ago, which matches the yearly figure. The monthly increase of 18.61% points the other way, and it is a reminder that a single month is a short window. A median of 51 days is not a measure of any one home. Half of the homes counted sold or were removed faster and half took longer.
None of this makes the page wrong. It makes it an automated summary, and the summary sentences are chosen by a template. The practical point for an owner is that the words seller's market and buyer's market on a page do not tell an owner what a particular home would bring. A home in a better location, in better condition or with a larger lot does not follow the neighborhood median.
| Measure | Value | Monthly change | Yearly change |
|---|---|---|---|
| Median listing price | $315,000 | -3.82% | -20.25% |
| Median sold price | $372,500 | 1.22% | -11.15% |
| Price per square foot | $221 | 0.40% | -7.88% |
| Active listings | 130 | -4.62% | 5.98% |
| Median days on market | 51 | 18.61% | -15% |
| Rental properties | 711 | 0.68% | 36.63% |
| Median rent | $1,561 | 0.90% | -0.26% |
Source: Realtor.com Economic Research, as shown on the page. Commercial content; not independently verified.
Which West Raleigh median is the real one?
Five published medians for West Raleigh and its surroundings run from $372,500 to $440,000, and each is correct for what it measures. The Realtor.com sold median of $372,500 is for September and for the neighborhood. The Redfin figure of $409,000 is for March, and it is 9.8% above the Realtor.com figure, a gap this brief computes. The Rocket figure of $405,000 is for April 2025, and it is 8.7% above the Realtor.com figure. The Resideline median of $422,000 covers all of Raleigh for six months, and the county's $440,000 is a median of recorded deed transactions for all of Wake County in August.
The county figure carries a note that matters. The Register of Deeds says it rebuilt its reports for the new fiscal year and now calculates the median from the full set of applicable deed transactions, including those with lower or zero excise values. It gives an example in which the June median, previously reported as $475,000, now calculates to $443,000. A change of $32,000 from a method alone is a reminder that a median is a product of the way it is counted. The page's headline says the median decreased by $18,500 in July to end the month at $440,000. The body says $440,000 was the August figure and $458,500 was July's. The headline mislabels the month, and this brief uses the body.
The county page has a second inconsistency. It says 5,954 of the 6,191 transactions in August were in the core market of $1 million or less, which is 96.2%, a share this brief computes. In the same release it says 88% of transactions recorded in August occurred in the core market. Both cannot be right for the same month, and the counts are the better evidence. The page also says three transactions were above $30 million and 234 were between $1 million and $30 million. Those three figures add to 6,191, so the counts are consistent with one another.
An owner should read the figures as a band and not as a point. West Raleigh homes in these pages sell in a band that starts in the low $370,000s and reaches above $400,000 depending on the source, the month and the mix of homes. Raleigh's middle half of sales runs from $310,000 to $650,000, a spread of $340,000, with the top of the range 2.1 times the bottom. No median tells an owner where in that band a particular home sits.
| Source | Figure | What it measures |
|---|---|---|
| Realtor.com | $315,000 | Median listing price, West Raleigh, September 2026 |
| Realtor.com | $372,500 | Median sold price, West Raleigh, September 2026 |
| Rocket | $405,000 | Median sold price, West Raleigh, April 2025 |
| Redfin | $409,000 | Median sale price, West Raleigh, March 2026 |
| Resideline | $422,000 | Median closing price, all Raleigh, six months |
| Wake County Register of Deeds | $440,000 | Median deed transaction price, all Wake County, August 2026 |
Sources as cited. The measures, areas and months differ, and the figures are not directly comparable. Commercial content; not independently verified.
How long does a West Raleigh sale take, and how many homes compete?
The pages give a time that runs from 21 to 51 days, and the differences come from what is being timed. Realtor.com shows a median of 51 days on market for homes for sale, down 15% on the year. Redfin shows 38 days on average for March, against 30 a year earlier, and says elsewhere on the same page that homes sell in 31 days. Rocket showed an average listing age of 21 days in April 2025 and said 69% of the homes that sold did so within 30 days. Resideline shows, for all of Raleigh, a median of 22 days from listing to contract and a median of 34 days from contract to closing.
The Redfin page gives two numbers for what looks like the same thing, 38 and 31 days. The first is an average for March and the second is the headline of the competitiveness section, and the page does not say how the second was calculated. This brief reports both and does not choose one. The Resideline pair is the most useful for an owner planning a move, because it separates the time to find a buyer from the time to close. Added together, 22 and 34 days is 56 days, a sum this brief computes and one that does not apply to any one home, since the medians are for different sets of closings.
The count of competing homes is more confusing. The Realtor.com page shows 130 active listings for the neighborhood. Its table of postal areas shows 192, 140, 107, 99 and 64 homes for sale in the five areas it lists, which sum to 602. The neighborhood count is 21.6% of that sum. The page's table of named subdivisions shows 7 homes for sale in Sunset Terrace, 4 in Dutch Village, 2 in Athens Grove, 2 in Deboy Land and 1 each in Ashworth Townes, Cardinal Hills and Fairview Hills, a total of 18. Eighteen named homes against 130 for the neighborhood means most of the listings do not belong to a named subdivision on the page, or the page does not match them.
Rocket's April 2025 report counted 107 homes for sale. The Realtor.com count of 130 is 21.5% higher, a gap this brief computes, though the two pages are 17 months apart and do not share a boundary. The Rocket report also gave the mix of results for 26 homes sold or pending: 54% sold under asking, 31% at asking and 15% over. The Redfin page for March 2026 shows 16.7% of homes sold above the list price, down 2.5 points on the year, and a sale-to-list ratio of 97.8%. Realtor.com shows 99% for September. A ratio of 97.8% means the typical sale closed 2.2% under the asking price, and a ratio of 99% means 1%. The difference between them is small on a $400,000 home, about $4,800, and it is large enough to remind a seller that the list price is a starting point.
| Source | Figure | What it measures |
|---|---|---|
| Rocket (April 2025) | 21 days | Average listing age |
| Resideline (Raleigh) | 22 days | Median, listing to contract |
| Redfin (March 2026) | 31 days | Stated for the neighborhood, method not given |
| Resideline (Raleigh) | 34 days | Median, contract to closing |
| Redfin (March 2026) | 38 days | Average days on market |
| Realtor.com (September 2026) | 51 days | Median days on market for homes for sale |
Sources as cited. Commercial content; not independently verified.
Do the postal areas under the West Raleigh name price alike?
The Realtor.com page for West Raleigh breaks the neighborhood into five postal areas, and the prices are not alike. The median listing prices are $355,000, $394,900, $595,000, $1,011,250 and $1,092,000. The highest is 3.1 times the lowest, a ratio this brief computes. The price per square foot runs from $229 to $460, a factor of 2.0, and the median rent from $1,485 to $2,149, a factor of 1.45. A neighborhood median of $315,000 is below the lowest of the five, which is another sign that the neighborhood median is built from a different set of homes from the postal areas.
The sheet that guides this brief pairs West Raleigh with one postal area, and that one has a median listing price of $1,092,000, $444 per square foot, a median rent of $1,683, 99 homes for sale and 340 rentals. It is the most expensive of the five. The Census value for the same postal area is $707,800, with a margin of error of $49,820, or 7.0%. A listing median of $1,092,000 is 54% above the Census value, and the neighborhood's sold median of $372,500 is 47% below it. The Census value is the owners' own estimate of what a home is worth, so the figure is not a sale price. It sits between the two pages, which is a warning that none of them describes the home down the street.
The practical meaning is that West Raleigh is not one market. A sale of a home on a large lot in one of the high-priced areas and a sale of a small house in the low-priced area are different transactions with different buyers. The Realtor.com neighborhood median of $372,500 sold is a figure for the mix. An owner of a high-end home should not use it as a guide, and an owner of a modest home should not use the postal area figure of $1,092,000.
Source: Realtor.com, as cited above, and the U.S. Census Bureau, American Community Survey 2020-2024. Percentages and ratios are this brief's arithmetic.
What does the Census say about the age and ownership of West Raleigh homes?
The Census describes the postal area as a place of renters and newer homes. Of 11,681 homes, 10,441 are occupied, and 5,849 of those (56.0%) are rented and 4,592 (44.0%) are owner-occupied. A further 1,240 homes, or 10.6%, are vacant. The median household income is $96,775 and the median rent is $1,610, which is 3.1% above the Realtor.com median rent of $1,561 for the neighborhood. The postal area has a population of 28,438.
The age of the stock is mixed. The largest group, 3,433 homes or 29.4%, was built in the 2010s, and a further 816 have been built since 2020, which brings the share built since 2010 to 36.4%. At the other end, 4,051 homes (34.7%) were built before 1980, including 526 built in 1939 or earlier and 522 in the 1940s. The median year built is 1996. A postal area with a third of its homes from before 1980 and a third from since 2010 has two kinds of seller, and the second kind will not face the same repair list as the first.
The ownership split affects who buys a home here. With 56% of occupied homes rented, many nearby sales are of investment properties, and an owner who lives in the home sells to a different pool from a landlord. It also means that a listing median, which is made of homes the owners chose to sell, is a thin guide to the stock. Of 11,681 homes, 130 are on the market in the neighborhood at one time on the Realtor.com count, which is 1.1% of the Census count. The two counts cover different boundaries and the share is only an indication of scale.
The Census value of $707,800 has to be read with care. It is the median of what owners say their homes would sell for, in a postal area where 4,592 homes are owner-occupied, and the margin of error is $49,820. The figure of $707,800 is 1.9 times the Realtor.com sold median of $372,500, which shows how far the neighborhood figure is from the postal area. The Census release is a five-year estimate, so it lags the market by years, and it should not be read as a current price. Readers comparing markets can also read the Bald Head Island brief and the University Park brief.
Source: Census Reporter, American Community Survey 2020-2024 five-year estimates, tables B25034, B25077, B25003, B25002, B19013 and B25064. Percentages and ratios are this brief's arithmetic.
What should an owner ask, and what does a private sale change?
Ask which area a figure covers: the neighborhood, one of its five postal areas, all of Raleigh or all of Wake County. Ask which month and which kind of price, listing, sold or recorded in a deed. Ask whether a count of homes is a live feed or a sample. A seller who has the answers can read a page, and a seller who does not will find that five pages give five medians.
A private sale changes how a home reaches a buyer. With Maison Off-Market there are no showings and no neighbors talking about a sale, the closing date can be flexible so that an owner has time to find a new home, there are no commission costs, there are no closing costs and there are no inspections or repairs. For an owner whose home was built before 1980, which describes 34.7% of the homes in the postal area, a sale without inspections or repairs removes a list of work that a buyer would otherwise raise. This brief does not claim that a private sale always brings a higher price than a public listing.
Fee arithmetic shows what the commission point means in dollars, without assuming any rate. Each 1% of a sale price is $3,725 at $372,500, $4,090 at $409,000 and $10,920 at $1,092,000. At 3% those amounts are $11,175, $12,270 and $32,760. At 5% they are $18,625, $20,450 and $54,600. These are illustrations of what a percentage means on the figures in this brief, and they are not a statement of what any agent charges or what any sale would cost.
Timing is the other thing an owner controls. A public listing starts a clock, and the pages above show 51 days on the market and a further 34 days from contract to closing for Raleigh. A private sale lets the owner choose the closing date, which matters most to people who need to find the next home first, or to landlords who would rather close between leases.
Privacy is often the first thing owners raise. A public listing puts photographs, a price and every price change in front of anyone, and a listing median that fell 20.25% in a year is the kind of figure that neighbors notice. A private sale keeps those details out of view. That is a matter of preference and not a claim about price.
If you are weighing a sale of a West Raleigh home, one conversation costs nothing and obliges you to nothing. We ask about the home, the timing you would like and what you would need from a buyer, and we say plainly whether a private sale fits.
If you would like a private, no-obligation offer for a West Raleigh home, call 401-219-4207 or use the contact form on this site.
Methodology and limitations
Prices, days on market, counts and ratios come from a Realtor.com page with indicators as of September 2026, a Redfin page with data for March 2026, a Rocket report dated April 2025, a Resideline page updated October 2, 2026 and a Wake County Register of Deeds release for August 2026 whose headline names July. The pages cover different periods and boundaries, and most are commercial pages, so they are not independent of each other. The Realtor.com summary text contradicts its own table on the direction of supply, and the county release gives two different shares for the core market; both are flagged above. The Census figures are five-year estimates and lag the market.
Conclusion
The West Raleigh record shows a sold median of $372,500 down 11.15%, a listing median of $315,000 down 20.25%, a Redfin sold median of $409,000 for March, a Raleigh median of $422,000 and a county median of $440,000, with waits of 21 to 51 days. The pages disagree because they measure different areas, months and kinds of price, and the neighborhood's five postal areas have listing medians that differ by a factor of 3.1.
Frequently Asked Questions
What is the median home price in West Raleigh?
Pages differ. Realtor.com shows a median sold price of $372,500 for September 2026, Redfin shows $409,000 for March 2026, and Resideline shows $422,000 for all of Raleigh over six months.
Is West Raleigh a seller's market?
One Realtor.com page calls it a seller's market and says in the same summary that buyers have greater negotiating leverage, because the median listing price fell 20.25% on the year.
How long do homes take to sell in West Raleigh?
Realtor.com shows a median of 51 days on market. Redfin shows 38 days for March and Resideline shows 22 days to contract and 34 days from contract to closing for all of Raleigh.
How much is 1% of a West Raleigh home price?
It is $3,725 at $372,500 and $4,090 at $409,000. At 3% those amounts are $11,175 and $12,270. This is arithmetic and not an agent's rate.
Can I sell my West Raleigh home privately?
Yes. Maison Off-Market buys luxury homes and estates directly from their owners with no showings, flexible closing dates, no commission costs, no closing costs and no inspections or repairs. Call 401-219-4207 or use the contact form.
Compare your options before committing. Request a written private offer for your property, with no obligation, then weigh it against your listing plan.
Sources
- Realtor.com, 2026. West Raleigh Neighborhood Housing Market Data. https://www.realtor.com/local/market/north-carolina/raleigh/west-raleigh.
- Redfin, 2026. West Raleigh Housing Market. https://www.redfin.com/neighborhood/548765/NC/Raleigh/West-Raleigh/housing-market.
- Rocket, 2025. West Raleigh Housing Market Report. https://rocket.com/homes/market-reports/nc/west-raleigh.
- Resideline, 2026. Raleigh Housing Market 2026. https://resideline.com/blog/raleigh-housing-market-2026.
- Wake County Government, 2026. Median Real Estate Price Report. https://www.wake.gov/news/wake-countys-median-real-estate-price-decreased-18500-july-2026-ending-month-440000.
Related research

Seller Guide · October 6, 2026
How to Prepare Point Pleasant Beach Rental Records Before Selling
Separate rental approval, income history and booked stays before comparing sale terms.

Seller Guide · October 6, 2026
How to Prepare Rumson Flood and Waterfront Records Before Selling
Separate flood disclosure, elevation, repairs and waterfront rights before comparing sale terms.

Seller Guide · October 6, 2026
How to Prepare Sarasota Condo Inspection and Reserve Records Before Selling
Separate building condition, reserve funding and resale documents before comparing sale terms.