Market Brief · by Aidan Sowa · October 5, 2026
Why Does One Wake Forest Community Close Fast and Another Slowly? Reading the Median and the Clocks of Different Communities
Reading the Median and the Clocks of Different Communities for Wake Forest, NC, with each source dated and its limits noted, for owners weighing a listing against a direct sale.
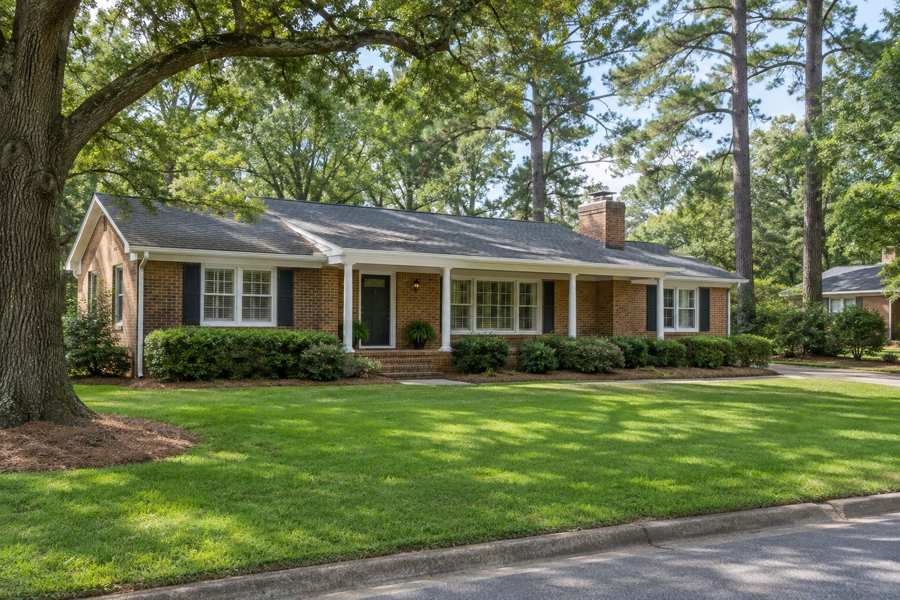
Why does one Wake Forest community close in 25 days and another in 134? A brokerage report dated August 13, 2026 breaks the town into communities and finds a gated golf neighborhood at 25 days on market in March, two established subdivisions at 26, a mixed older area at 53, and two communities at 134 days, one of them in May. The same report says the town's median sale price, which Redfin put at $490,000 for the three months to May, hides the split. A townwide number cannot tell a seller whether a house sells in four weeks or in four months.
The town-level pages disagree as well. A first-half report gives a June median of $515,000 and a median of 22 days on market, while Redfin's page for the three months to June gives a median of $490,000, up 1.0%, and 32 days. A data site gives a median of 30 days from listing to contract and 34 more to closing, which is 64 days in all. The same first-half report calls 3.8 months of supply a balanced market, though it defines balance as 4 to 6 months. This brief sets the pages side by side and checks the arithmetic.
Maison Off-Market speaks only to sellers. The last section sets out what a private sale changes in a town where the pages show builders competing with resale homes in the communities that wait longest.
Key Findings
- Redfin showed a Wake Forest median sale price of $490,000 for the three months to June 2026, up 1.0%, a median price per square foot of $189, down 7.4%, 291 homes sold in June against 257, an average of 32 days on market against 38, and an average sale about 1% below list price (Redfin, Wake Forest housing market).
- A brokerage report dated August 13, 2026 showed March days on market of 25 in a gated golf community, 26 in two established subdivisions, 53 in northeast Wake Forest, 92 in a master-planned community in February and 134 in an established subdivision and in a walkable lake-and-park community in May, where the median price was $360,000, down 23.2% (Local brokerage blog, three Wake Forest markets).
- A first-half 2026 report showed a Wake Forest June median sale price of about $515,000, up 3.6% on a trailing three-month basis, 22 median days on market, a 98.4% sale-to-list ratio, about 249 homes sold in May and 3.8 months of supply, against a Wake County median of $490,000 (Local brokerage blog, Raleigh and Wake Forest first half of 2026).
- A data site tracked 528 closings in six months with a median of $450,000, a middle half of sales between $350,000 and $600,000, a median of 30 days from listing to contract and 34 days from contract to closing (Resideline, Wake Forest housing market), and Zillow showed an average home value of $530,009, down 0.2% over the year, with homes going pending in around 16 days (Zillow, Wake Forest home values).
- The Census postal area that includes Wake Forest has 31,117 housing units, 89.7% of them built in 1980 or later, a median year built of 2006, 81.0% of occupied homes owned and a median owner-occupied value of $497,800, which is 96.7% of the first-half report's $515,000 median, a ratio this brief computes.
Why do the Wake Forest price and sales figures differ?
The June medians sit within 5.1% of each other, $490,000 on Redfin and about $515,000 in the first-half report, a gap this brief computes. The report says its Wake Forest figures reflect Redfin and Movoto data as of June, so the difference is not explained by the sources it names. A third median, $450,000, comes from the data site over six months, and Zillow's average home value is $530,009. The Wake County median is $490,000 in the report and $478,500 for May in the community report, which attributes it to the county's listing service.
The direction of the year-over-year change varies by page. Redfin's page shows the median up 1.0% for three months to June. The community report quotes Redfin at $490,000 up 3.6% for three months to May. The first-half report gives 3.6% too, for a different median and a trailing three months. Zillow's current page shows an average value down 0.2%, while the community report quotes Zillow at $509,872 down 2.7% as of May 31. The two Zillow readings differ by 4.0% in value, a figure computed here, and the page does not say whether the index was revised or the figures are for different measures.
The price per square foot adds a puzzle. Redfin shows $189, down 7.4%, beside a median price up 1.0%. A rate that falls while the median rises means the homes that sold were larger or the mix shifted, and the page does not say which. At $189 a foot, a $490,000 median implies a typical sold home of about 2,590 square feet, an inference this brief computes from the page's two figures.
The sales counts are the largest disagreement. Redfin says 291 homes sold in June, up from 257, a rise of 13.2%. The first-half report counts about 249 in May. The data site tracked 528 closings in six months, about 88 a month. Redfin's June figure is 3.3 times that pace, a ratio computed here. The same pattern appears on other Redfin city pages in this series, where a single-month count runs several times what local sources give, and a count covering more than one month or a wider area is the likeliest reading, though the page does not say.
| Source | Figure | What it measures |
|---|---|---|
| Redfin | $490,000 | Median sale price, three months to June, up 1.0% |
| First-half report | $515,000 | Median sale price, June, up 3.6% on a trailing basis |
| Resideline | $450,000 | Median sold price, 528 closings, six months |
| Zillow | $530,009 | Average home value, down 0.2% |
| Community report | $509,872 | Zillow value as of May 31, down 2.7% |
| Community report | $360,000 | Median price in one community, May, down 23.2% |
Sources as cited. The periods, measures and counts differ and the figures are not directly comparable. Commercial content; not independently verified.
How long does a Wake Forest sale take?
The town clocks run from 16 days to 64. Zillow says homes go pending in around 16 days. The first-half report says a median of 22 days on market for June. Redfin says an average of 32 days on market, and in its compete score section says homes go pending in around 40 days. The community report quotes Redfin at about 38 days under contract for the three months to May. The data site gives a median of 30 days to contract and 34 days from contract to closing, which sum to 64, an addition of two medians over different closings and so an approximation. The ranges are wide because the pages measure different stops on the road, a listing to a contract, a listing to a closing, or a model of when a home will go pending.
The community report splits the town. In March it shows 25 days in a gated golf community, 26 in an established golf-course community and 26 in an established subdivision, 53 in northeast Wake Forest, 92 in a master-planned community in February, and 134 in an established subdivision in March and in a walkable community in May. The slowest is 5.4 times the fastest, a ratio this brief computes. The walkable community's clock stretched from 49 days a year earlier to 134, a rise of 2.7 times, also computed here, with a median price of $360,000, down 23.2%.
The report's explanation is that the variable that predicts speed is whether a resale seller is competing against a builder actively selling a near-identical new home nearby. It says builders are using rate buydowns, design credits and closing cost concessions, and that the two slowest communities still have new-construction phases. That is the report's reading, and it offers no count of resale listings or of builder incentives. It also says that the golf communities have no incentive-backed new alternative across the street. A seller should read this as a hypothesis from a brokerage and test it against the sales on the seller's own street.
The report adds contrast on price. It describes the walkable community's median as close to entry-level pricing and the gated golf community's homes as typically running from the 800,000s to past 2 million dollars. So the slowest and fastest clocks sit at opposite ends of the price range, which is why the report says the pattern is not about price bracket. It also lists new downtown-adjacent condo and townhome projects that it says will keep adding walkable new-construction inventory next to resale homes. Those are the report's statements about projects, and this brief has not checked any of them.
The report's own numbers also hold a flag. It gives a $360,000 median for the walkable community in May, down 23.2%, and a $360,000 median for the master-planned community in February, down 32.7%. Two different communities at the same median in different months is possible, but the report's source for each is a single Redfin figure, and a small community's median can move by tens of thousands of dollars on a few sales. The percentages should be read with that in mind. The year-earlier figures they imply, about $469,000 and $535,000, are inferences from the page's percentages.
Is Wake Forest balanced, and what do supply and offers show?
The first-half report says inventory grew through the spring, up roughly 21% across Wake County, and that Wake Forest stood at about 3.8 months of supply, which it calls a genuinely balanced market. The same page says a market is generally considered balanced between 4 and 6 months. A figure of 3.8 is below that range, so by the report's own definition the market sits just on the seller's side of balance, and the headline overstates the shift. The report also says its Wake Forest sale-to-list ratio is 98.4% against about 99% for the county, which means the typical home sold for 1.6% under list, a figure this brief computes.
Redfin says the average home sells about 1% below list and goes pending in around 40 days, and that homes receive 2 offers on average. The first-half report also says about 2 offers per home. The community report says the county's median was $478,500 in May, with active inventory up 5.4% on the year, homes selling in an average of 24 days at 99.1% of list. The two inventory figures, 21% and 5.4%, are for different periods and may be for different scopes, and the pages do not reconcile them.
The two growth stories fit the same market. The community report says the town's population reached an estimated 64,618 in 2026, up 4.25%, citing a local business partnership's profile, and that a passenger rail project and new downtown supply are adding to growth. The Census counts 82,886 residents in the postal area that includes the town, which is 1.28 times that estimate, a ratio computed here, so the postal area is wider than the town limits. A seller should expect a stream of new construction to keep competing with resale, and the pages describe it.
None of the pages gives days on market by price band for the whole town. The data site's middle half of sales runs from $350,000 to $600,000, so a home above $600,000 sits in the top quarter of the town's sales and is likely to face fewer comparable sales. That is an inference from the quartiles and does not describe how long such homes take.
What does the Census say about the Wake Forest housing stock?
The Census postal area that includes Wake Forest has 31,117 housing units, and the stock is young. Of those, 9,702 were built in the 2010s, 31.2%, 8,800 in the 2000s, 28.3%, 4,193 in the 1990s, 13.5%, and 2,467 in 2020 or later, 7.9%. Homes built before 1980 number 3,199, or 10.3%. The median year built is 2006. A seller in this area owns a house that is, in the typical case, twenty years old, and about 67% of the stock was built since 2000, a figure computed here.
Ownership is deep and recent. Of 29,545 occupied homes, 23,944 are owner-occupied, 81.0%, and 5,601 are rented, 19.0%. Among owners, 3,682 moved in during 2020 to 2022 and 815 from 2023 on, which together are 18.8% of owners. Another 11,513 moved in during the 2010s, 48.1%. Owners who arrived in the 1990s or earlier number 2,903, or 12.1%. Among renters, 3,444 of 5,601 moved in from 2020 on, 61.5%, all computed here. Two-thirds of owners arrived in 2010 or later, which is the group that bought into the recent run of new construction.
Vacancy is low. Of 31,117 units, 1,572 are vacant, 5.1%. Of those, 639 are in the other category, 374 are for rent, 296 are held for seasonal, recreational or occasional use, 152 are for sale, 95 are sold and not yet occupied and 16 are rented and not yet occupied. The 152 for-sale units sit beside the community report's county inventory and the first-half report's 3.8 months of supply, and the survey is a five-year average, so the counts do not measure the same day. The Census median household income is $133,743 and the median rent is $1,544 a month.
The Census median owner-occupied value is $497,800, with a margin of error of $16,028. The value is owners' own estimate of what their homes would sell for, over five years. It is 96.7% of the first-half report's $515,000, 101.6% of Redfin's $490,000, 110.6% of the data site's $450,000 and 93.9% of Zillow's $530,009, all computed here. Of the sources in this brief, the Census sits within a few points of the town-level medians, which suggests that the postal area and the town are alike in price even though they differ in size. Readers comparing markets can also read the University Park brief and the Mooresville brief.
Source: Census Reporter, American Community Survey 2020-2024 five-year estimates, tables B25034, B25038, B25004, B25077, B25003, B25002, B25064 and B19013. Percentages and ratios are this brief's arithmetic.
What should an owner ask, and what does a private sale change?
The first question is which community a pricing opinion describes. A townwide median of $490,000 and a range of clocks from 25 to 134 days describe a place in which the street matters more than the town. A seller should ask for the closed sales in the home's own subdivision over the last year, for the days to contract on each, and for the share that sold below the original ask.
The second question is nearby new construction. The community report says the variable that predicts speed is a builder selling a near-identical new home close by, with incentives. A resale seller should ask what incentive the builder next door is offering on a similar plan, and what that does to the offers a resale home draws. The pages say nothing about the size of such incentives, and this brief invents none.
The third question is the commission, and the arithmetic is simple. Each 1% of a $490,000 price is $4,900. At 3% the figure is $14,700 and at 5% it is $24,500. These illustrate the size of each percentage point and are not quotes of any rate a seller would be charged. No page in this brief names a Wake Forest commission rate, and $490,000 is Redfin's median and not the price of any one home. At the data site's $450,000, each 1% is $4,500.
The fourth question is exposure and repairs. A public listing in a community where the clock is 134 days means a long period of showings, open houses and a price history that every buyer sees. In a postal area where most homes are under twenty-five years old, a buyer's inspector reviews first-generation roofs, systems and finishes, and the pages do not give the share of Wake Forest sales that needed repairs or credits. A private sale has no showings and avoids inspection repairs.
The benefits are plain. Maison Off-Market buys luxury homes and estates directly from their owners and speaks only to sellers. A private sale has no showings and no neighbors talking about a sale. It allows closing dates that give a seller time to find a new home. It has no commission costs and no closing costs, and it avoids inspection repairs. The company does not say that a private sale always beats a public listing, and in a town where clocks run from 25 to 134 days by community, an owner is right to ask what each route yields. If you would like a private, no-obligation offer for a Wake Forest home, call 401-219-4207 or use the contact form on this site.
Methodology and limitations
Redfin's figures run to June 2026, and its count of 291 June sales is not matched by the other pages, which suggests the count covers more than one month or a wider area. The community report is a brokerage's August 13 article that mixes dates from February to May and quotes several sources, including a Zillow figure that differs from Zillow's current page. The first-half report is a July brokerage article whose Wake Forest figures it attributes to Redfin and Movoto as of June, and whose 3.8 months of supply is called balanced against its own 4 to 6 month definition. The data site's median and quartiles are from closings it tracked and were updated October 2, 2026. The pages cover different periods and measures and are commercial, so they are not independent of each other. The Census figures are five-year estimates for a postal area that is larger than the town.
Conclusion
The Wake Forest record shows June medians from $490,000 to $515,000, clocks from 16 to 64 days in the town and from 25 to 134 days by community, a supply figure called balanced that sits below its own definition, and a postal area where 89.7% of homes were built in 1980 or later. The pages differ because they measure different stops and areas, and the useful figure for an owner is the one for the home's own community.
Frequently Asked Questions
What is the median home price in Wake Forest?
Pages differ. Redfin shows $490,000 for three months to June 2026, a first-half report shows about $515,000 for June, and a data site shows $450,000 for six months of closings.
How long does it take to sell a home in Wake Forest?
Pages differ. Zillow shows about 16 days to pending, a first-half report shows a median of 22 days, Redfin shows an average of 32 days, and a data site shows 30 days to contract plus 34 to close. One report shows communities from 25 to 134 days.
Is Wake Forest a buyer's or seller's market?
A first-half report shows 3.8 months of supply and calls it balanced, though it defines balance as 4 to 6 months. Redfin calls the market somewhat competitive with 2 offers on average.
How old are the homes in Wake Forest?
In the Census postal area that includes Wake Forest, 89.7% of homes were built in 1980 or later, 31.2% were built in the 2010s, and the median year built is 2006.
Can I sell my Wake Forest home privately?
Yes. Maison Off-Market buys luxury homes and estates directly from their owners with no showings, flexible closing dates, no commission costs, no closing costs and no inspections or repairs. Call 401-219-4207 or use the contact form.
Compare your options before committing. Request a written private offer for your property, with no obligation, then weigh it against your listing plan.
Sources
- Redfin, 2026. Wake Forest Housing Market. https://www.redfin.com/city/35710/NC/Wake-Forest/housing-market.
- Local brokerage blog, 2026. Wake Forest's Median Price Is Hiding Three Different Markets. https://hodgekittrellsir.com/blog/wake-forests-median-price-is-hiding-three-different-markets.
- Local brokerage blog, 2026. Raleigh and Wake Forest Housing Report: First Half of 2026. https://stoicpropertiesllc.com/raleigh-wake-forest-housing-report-2026.
- Resideline, 2026. Wake Forest, NC Home Sales 2026: Prices and Days on Market. https://resideline.com/blog/wake-forest-nc-housing-market.
- Zillow, 2026. Wake Forest, NC Housing Market. https://www.zillow.com/home-values/55006/wake-forest-nc/.
Related research

Seller Guide · October 6, 2026
How to Prepare Point Pleasant Beach Rental Records Before Selling
Separate rental approval, income history and booked stays before comparing sale terms.

Seller Guide · October 6, 2026
How to Prepare Rumson Flood and Waterfront Records Before Selling
Separate flood disclosure, elevation, repairs and waterfront rights before comparing sale terms.

Seller Guide · October 6, 2026
How to Prepare Sarasota Condo Inspection and Reserve Records Before Selling
Separate building condition, reserve funding and resale documents before comparing sale terms.