Market Brief · by Aidan Sowa · October 5, 2026
Is Santa Rosa a Seller's Market if Prices Are Falling? Reading a Seller's Market That Is Slipping and the Clock
Reading a Seller's Market That Is Slipping and the Clock for Santa Rosa, CA, with each source dated and its limits noted, for owners weighing a listing against a direct sale.
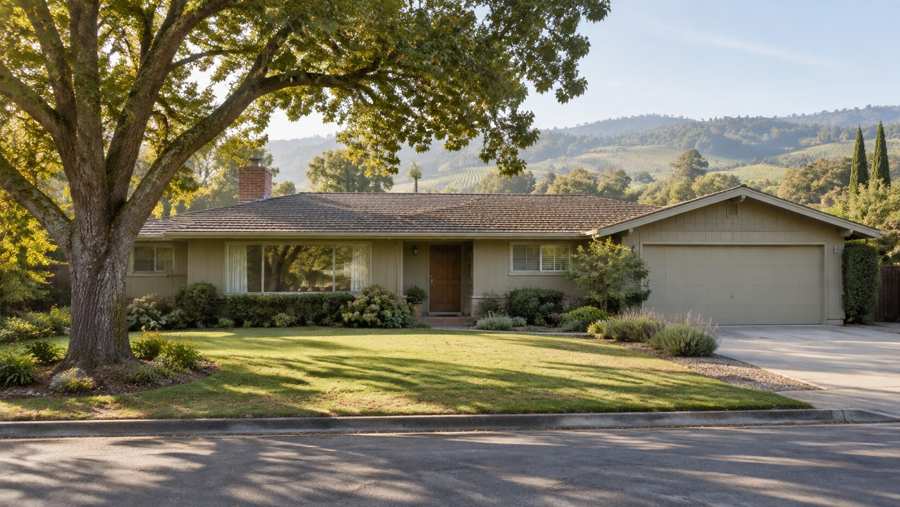
A listing portal says that Santa Rosa is a seller's market, which it defines as more buyers than homes. The same page shows that the median sold price fell 1.66% in a year and the median listing price fell 1.75%. Redfin's page for the city says that prices are down 3.2% on the year, at a median of $715,526, and that homes receive two offers and sell in about 40 days.
A seller's market in which prices are falling is a puzzle, and it is a useful one. The label describes the balance of buyers and homes, and the price describes what happened to the typical sale. Sales were also fewer: 430 in August against 454 a year ago. The signals disagree because they measure different things, and a seller who reads only the label would believe that prices are rising.
Santa Rosa carries another piece of context that no median shows. In October 2017 the Tubbs fire destroyed thousands of homes in the city, and the rebuilding that followed has changed the housing stock. This brief reads the portal and Redfin pages with the Census profile of the postal area, news reports on the rebuild and the Santa Rosa metropolitan series. The local figures are commercial content and are labeled so. The brief prices no house.
Key Findings
- Redfin reported a Santa Rosa median sale price of about $715,526 for the three months to August 2026 (down 3.2%), a price per square foot of $464 (up 0.7%), two offers on average, about 40 days on market against 46 a year earlier, and 430 homes sold in August against 454 (Redfin, Santa Rosa).
- A listing portal reported, for August 2026, a citywide median listing price of $812,298 (down 1.75%), a median sold price of $740,000 (down 1.66%), $471 per square foot, 804 active listings (down 12.61%), a median of 45 days on market (down 10.20%), a sale-to-list ratio of 100%, and called the market a seller's market (Realtor.com, Santa Rosa).
- The Tubbs fire destroyed over 5,600 structures in October 2017, and nearly 80% of the 4,700 homes it burned had been rebuilt as of April 2025, according to a Los Angeles Times analysis (Los Angeles Times).
- In the Census postal area, 559 of 16,861 housing units (3.3%) were built since 2020 and 1,408 (8.4%) in the 2010s, and 10,039 (59.5%) were built before 1980 (U.S. Census Bureau, 2020-2024).
- The Santa Rosa-Petaluma median days on market rose from 37 in April 2026 to 55 in August (Realtor.com, days on market).
How can it be a seller's market with prices falling?
The portal defines a seller's market as one with more people looking to buy than homes available, and it bases the label on a sale-to-list ratio of 100%, meaning that homes sold at about their asking price. By that measure, sellers are doing fine: the typical sale closes at the ask. But the ask itself fell, by 1.75% over the year, so selling at the ask meant selling for less than a year earlier.
Redfin's figures show the same direction more sharply: a median sale price down 3.2% and sales down by 24, from 454 to 430, which is 5.3%. Fewer sales and lower prices do not fit a market in which buyers are crowding in. They fit a market in which sellers who price at the market get their price, and in which sellers who do not wait or cut.
The two pages agree on the wait. Redfin reports 40 days, against 46 a year earlier, and the portal 45 days, down 10.20%. Both say that homes sell faster than a year ago. A faster clock with lower prices is the signature of a market that has repriced. Sellers cut their asking prices, and buyers moved in at the lower numbers.
For an owner, the useful point is that the label is the least informative part of the page. The price direction, the sale-to-list ratio and the wait are the figures to use. They say that a well-priced home in Santa Rosa sells at its ask in about six weeks, and a home priced above the market does not.
| Measure | Redfin | Realtor.com |
|---|---|---|
| Median sale price | $715,526 (down 3.2%) | $740,000 (down 1.66%) |
| Median listing price | Not shown | $812,298 (down 1.75%) |
| Days on market | About 40 (46 a year earlier) | 45 (down 10.20%) |
| Price per square foot | $464 (up 0.7%) | $471 |
| Offers or ratio | 2 offers per home | Sale-to-list 100% |
| Sales or listings | 430 sold in August | 804 active listings |
Sources: Redfin and Realtor.com pages as cited. The 5.3% figure is this brief's arithmetic. Commercial content; not independently verified.
What did the fire change about the housing stock?
In October 2017 the Tubbs fire destroyed over 5,600 structures, the Los Angeles Times reports, and burned nearly 4,700 homes in the area. In the city of Santa Rosa, the fire destroyed about 1,800 homes in one hillside neighborhood and about 1,300 in another, on a different side of the highway, according to a magazine report from 2025. That report says that about 1,200 parcels in the flatter neighborhood have been rebuilt or are in the process, 92% of homes lost, and about two-thirds of those lost in the hillside neighborhood.
A fire department spokesperson told a local news report in October 2025 that the flatter neighborhood is over 96% to 97% rebuilt with few vacant lots, while the hillside neighborhood still has a lot of construction underway. The Times analysis says nearly 80% of the homes burned in the Tubbs fire have returned. The three figures use different bases and dates, and they agree that most of the homes were rebuilt and that the hillside neighborhood is behind.
The Census profile carries the trace of this. In the postal area, 1,408 homes were built in the 2010s and 559 since 2020, a total of 1,967 or 11.7% of the stock. The Census does not say which were rebuilds, and the postal area may or may not include the burned neighborhoods, so this brief makes no claim that the new homes are rebuilds. They are evidence that a meaningful share of the area's housing is new.
For an owner, the fire shapes the market in three ways. Rebuilt homes are new and sell as new construction, at higher prices per foot than the older homes. Insurance and rebuilding costs have become part of what buyers weigh. And a seller whose home sits near a burned area may find that buyers ask about wildfire risk, defensible space and insurance. The sources used here give no figures for insurance costs, and the brief does not estimate them.
Sources: Los Angeles Times, CBS News San Francisco and The Real Deal as cited; U.S. Census Bureau, table B25034.
What does a 100 percent sale-to-list ratio hide?
The portal reports that homes in Santa Rosa sold for about the asking price on average in August, a ratio of 100%. That sounds like a strong market, and in one respect it is: sellers are not giving up much from their asking price. It does not mean that sellers are getting more than they would have a year ago, since the median asking price itself fell by 1.75%, from about $827,000 to $812,298, a figure that is this brief's arithmetic from the stated change.
A ratio of 100% also depends on how the ask is set. A seller who lists low to start a bidding contest gets a ratio above 100%. A seller who lists at a realistic number gets close to 100%. A seller who lists high and cuts gets a ratio below 100% on the original price and close to it on the last price. The portal does not say which price it uses, and the answer changes what the figure means.
What the ratio does say is that, in the aggregate, the market is not forcing steep discounts. Together with the wait of 40 to 45 days, it describes an orderly market, in which buyers take about six weeks, pay about the asking price and expect to be shown a reasonable number. That is a market in which a well-prepared home sells, and in which a home with an unrealistic price sits.
It also fits the picture of a market that repriced. Prices fell a little, asking prices fell with them, and the gap between the ask and the sale closed. The most useful reading for a seller is that the market is steady at a level somewhat lower than a year ago.
A seller deciding how to sell can set that steadiness against the costs of a public sale: preparation, showings, fees and the time to close. In a steady market there is no rush premium, and the case for a quick, quiet sale rests on the five benefits and not on a fear of falling prices.
Source: Realtor.com page as cited. The $827,000 figure and the interpretation of the ratio are this brief's arithmetic and reasoning, not recorded figures. Commercial content; not independently verified.
What does the Census say about Santa Rosa homes?
The Census profile describes the postal area that includes parts of Santa Rosa. It counts 37,011 people and 16,861 housing units, of which 15,478 are occupied and 1,383 (8.2%) are not. Owners live in 9,430 homes (60.9%) and renters in 6,048 (39.1%). Median household income is $105,437 and median gross rent is $1,949 a month.
The stock is old, and it is also, in places, new. The largest group, 2,469 homes (14.6%), was built in the 1970s, but 2,255 (13.4%) were built before 1940 and 1,503 (8.9%) in the 1940s. Together, 10,039 homes (59.5%) predate 1980. The 1950s and 1960s ranches and bungalows make up another 22.7%. At the other end, 11.7% were built in the last sixteen years.
Owners estimate the median home at $903,900, with a margin of error of only $20,647, or 2.3%. That figure is above the citywide sold medians of $716,000 and $740,000, which says that the postal area is a more expensive part of the city than the average, and that a seller here should be careful with the citywide medians.
The age of the housing is the main preparation issue. A house from before 1940 may have original wiring, a stone or brick foundation and no seismic retrofit. A house from the 1950s to 1970s may have aging roofs and windows. Buyers and their inspectors will examine each, and in California the seismic and fire-hardening questions come with them.
| Indicator | Value | Note |
|---|---|---|
| Population | 37,011 | Whole postal area |
| Housing units | 16,861 | All units |
| Owner-occupied homes | 9,430 | 60.9% of occupied |
| Renter-occupied homes | 6,048 | 39.1% of occupied |
| No usual resident | 1,383 | 8.2% of all units |
| Built before 1980 | 10,039 | 59.5% of units |
| Median household income | $105,437 | Estimate |
| Median gross rent | $1,949 | Monthly |
| Owner-estimated median value | $903,900 | Margin of error $20,647 |
Source: U.S. Census Bureau, American Community Survey 2020-2024 five-year estimates.
What should an owner of a 1950s to 1970s ranch expect?
The Census counts 1,897 homes in the postal area built in the 1950s, 1,915 in the 1960s and 2,469 in the 1970s, a total of 6,281, or 37.3% of the stock. Most are single-story ranches and bungalows on modest lots, in a region where land is valuable. Buyers are drawn to them for the lot and the location, and many plan to update.
An inspector looking at a house from these decades in Sonoma County will usually report on the roof, the heating and cooling, the plumbing, the electrical panel and the foundation. In California, buyers also ask about seismic retrofitting, such as foundation bolting and cripple wall bracing, and about wildfire hardening, such as ember-resistant vents, a non-combustible roof and defensible space around the house. None of the sources used here gives costs for these items, and the brief does not estimate them.
The seller faces the usual choices. Repair before listing, with the cost and the risk that the work will not be repaid in price. Price for condition, which hands the buyer a discount. Or sell to a buyer who purchases as is, who takes on the work and does not return after an inspection with a list. The last is the fifth benefit of a private sale.
For an owner whose house has an unpermitted addition, a converted garage or other changes that were made without paperwork, there is a further issue. A public sale invites scrutiny of permits, and a buyer's lender may ask for them. A direct buyer who purchases as is may value the property without that step, though the seller should still disclose what the law requires.
The owners of these homes are often long-time residents with low cost bases and a lot of equity. The right time to learn what a private buyer would pay is before a decision to renovate, since a renovation that costs more than it adds is a loss that cannot be undone.
Source: U.S. Census Bureau, American Community Survey 2020-2024, table B25034. The description of typical inspection and disclosure items is general knowledge and not a figure from any source here.
What does the Santa Rosa-Petaluma clock say?
Realtor.com's series for the Santa Rosa-Petaluma area, published by the Federal Reserve Bank of St. Louis, show a market that slowed after spring. The median days on market was 37 in April 2026, 40 in May, 49 in June, 53 in July and 55 in August. Active listings rose from 794 in March to 1,153 in July (Realtor.com, active listings).
New listings eased from 578 in April to 516 in June (Realtor.com, new listings). The median listing price slipped from $999,496 in April to $945,000 in August (Realtor.com, median listing price), and the count of reduced listings climbed from 304 in April to 414 in July (Realtor.com, price reduced listings).
The metropolitan wait of 55 days is above the city figures of 40 to 45, and the median listing price of $945,000 is above the city's $812,298, since the area includes the wine country towns. The direction, a longer wait and a slipping ask, matches the city pages.
None of these series describe a particular Santa Rosa neighborhood.
Source: Realtor.com via FRED, Housing Inventory series for Santa Rosa-Petaluma, CA (CBSA).
How do new homes and old homes share one median?
A citywide median of $716,000 or $740,000 mixes two kinds of sale. One is a resale of an older home, which makes up most of the volume. The other is a new or rebuilt home, which sells at a higher price per foot and in smaller numbers. The mix changes from month to month, and the median moves with it. A month with a few more rebuilt homes closing can lift the median by a few percent, with no change in what an older home is worth.
This matters for a reading of the price direction. Redfin's median fell by 3.2% while its price per square foot rose by 0.7%, which is the opposite pattern from one in which prices fell. A smaller median and a flat price per foot suggest that the typical home that sold was a little smaller, or that fewer large new homes were in the mix, and that price per foot, the figure that adjusts for size, was stable. The portal's per-foot figure is also flat, up 0.05% on the year.
On the per-foot figures, the market was steady while the median drifted. A seller who looks only at the median would think prices were falling by 3%, and a seller who looks at the per-foot number would think they were unchanged. The second reading is better supported by the evidence on both pages. Redfin's $464 and the portal's $471 are within 1.5% of each other, and both barely moved.
The practical point for an owner is to compare like with like. A home of 1,600 square feet at about $465 per foot is in the range of $744,000, an arithmetic example and not a valuation. Condition, lot, location and the remaining life of the roof can shift it by more than the difference between the two pages, and recorded sales of nearby homes are the better check. Readers comparing markets can also read the Truckee brief and the Manhattan Beach brief.
Sources: Redfin and Realtor.com pages as cited. The mix argument and the $744,000 example (about $465 times 1,600) are this brief's reasoning and arithmetic, not recorded sales.
What would a private sale change for a Santa Rosa owner?
A direct sale to a buyer who purchases homes off the market changes five things for a seller. There are no showings and no neighbors talking about you selling, which counts when strangers walking through are not welcome. The closing date can be flexible, giving time to find a new home. There are no commission costs and no closing costs for the seller. And there are no inspections or repairs, which on an older house in a fire-aware state can be a long list.
The fee benefit requires no assumed rate. For every 1% of a sale price that would otherwise go to fees, a sale at $715,526 keeps $7,155 and a sale at $740,000 keeps $7,400. An owner can apply whatever percentage is in a listing agreement and compare net proceeds.
A flexible closing date matters to an owner who is also waiting on a rebuild, an insurance claim or a move. A private sale sets the date at the start.
The trade-off is the usual one. A public listing at a good price can sell at its ask within six weeks, and two offers per home suggest some competition. A private sale offers privacy, a settled date and no repairs. The owner decides.
A final point concerns timing. The metropolitan wait rose from 37 days in April to 55 in August, so a home listed in spring met a faster market than one listed in late summer. A seller who is deciding now is in the slower part of the year, and the shorter clock that both city pages report for the last three months is an average over a period that includes the faster weeks.
Source: calculation from stated prices; no commission rate, closing cost or repair cost is assumed.
Methodology and limitations
Prices, price per square foot, offers, days on market, sales and listing counts for Santa Rosa come from two commercial pages, a national brokerage site and a listing portal. They were not independently verified. Fire and rebuild figures come from a newspaper analysis, a television news report and a magazine report, each with its own date and base.
Age, tenure, vacancy, income, rent and owner-estimated value come from the American Community Survey 2020-2024 five-year estimates for the postal-code area that includes Santa Rosa. Shares are calculated from published counts, and owner-estimated value carries a stated margin of error.
Days on market, active and new listings, median listing price and price reduced counts are Realtor.com series published by the Federal Reserve Bank of St. Louis for the Santa Rosa-Petaluma metropolitan area. The brief makes no forecast and does not estimate what any particular home would sell for.
Conclusion
The Santa Rosa record shows a market that is called a seller's market while its prices are drifting down, its wait is shorter than a year ago and its housing stock has been partly rebuilt after a fire.
It does not fix a price for any one home. The choice between a public listing and a private sale comes down to whether an owner values the chance of competing bids more than privacy, a flexible closing date, no commission, no closing costs and no inspections or repairs.
Frequently Asked Questions
What is the median home price in Santa Rosa?
Redfin reports about $715,526 for three months to August 2026, and a listing portal reports a median sold price of $740,000.
Is Santa Rosa a seller's market?
A listing portal calls it one, though prices are down 1.66% to 3.2% on the year.
How long do Santa Rosa homes take to sell?
Redfin reports about 40 days, and the portal reports 45.
Does the Santa Rosa-Petaluma metropolitan data describe a neighborhood?
No. It covers a metropolitan area and shows direction only.
Does a private sale always beat a public listing?
No. A public listing can attract competing bids. A private sale offers privacy, a flexible closing date, no commission, no closing costs and no inspections or repairs.
Compare your options before committing. Request a written private offer for your property, with no obligation, then weigh it against your listing plan.
Sources
- Redfin, 2026. Santa Rosa Housing Market Trends. https://www.redfin.com/city/17911/CA/Santa-Rosa/housing-market.
- Realtor.com, 2026. Santa Rosa, CA Housing Market and Rental Trends. https://www.realtor.com/local/market/california/sonoma-county/santa-rosa.
- Los Angeles Times, 2025. This Is How Long It Took to Rebuild After California's Major Wildfires. https://www.latimes.com/homeless-housing/story/2025-09-30/rebuilding-california-after-major-wildfires.
- U.S. Census Bureau, 2026. American Community Survey 2020-2024 five-year estimates, the Santa Rosa area (via Census Reporter). https://censusreporter.org/profiles/86000US95404-95404/.
- Realtor.com, 2026. Housing Inventory: Median Days on Market in Santa Rosa-Petaluma, CA (CBSA). https://fred.stlouisfed.org/series/MEDDAYONMAR42220.
- Realtor.com, 2026. Housing Inventory: Active Listing Count in Santa Rosa-Petaluma, CA (CBSA). https://fred.stlouisfed.org/series/ACTLISCOU42220.
- Realtor.com, 2026. Housing Inventory: New Listing Count in Santa Rosa-Petaluma, CA (CBSA). https://fred.stlouisfed.org/series/NEWLISCOU42220.
- Realtor.com, 2026. Housing Inventory: Median Listing Price in Santa Rosa-Petaluma, CA (CBSA). https://fred.stlouisfed.org/series/MEDLISPRI42220.
- Realtor.com, 2026. Housing Inventory: Price Reduced Count in Santa Rosa-Petaluma, CA (CBSA). https://fred.stlouisfed.org/series/PRIREDCOU42220.
Related research

Seller Guide · October 6, 2026
How to Prepare Point Pleasant Beach Rental Records Before Selling
Separate rental approval, income history and booked stays before comparing sale terms.

Seller Guide · October 6, 2026
How to Prepare Rumson Flood and Waterfront Records Before Selling
Separate flood disclosure, elevation, repairs and waterfront rights before comparing sale terms.

Seller Guide · October 6, 2026
How to Prepare Sarasota Condo Inspection and Reserve Records Before Selling
Separate building condition, reserve funding and resale documents before comparing sale terms.