Market Brief · by Aidan Sowa · October 5, 2026
Is Park Shore Up or Down? Reading a Rising Sold Median and a Falling Listing Median
Reading a Rising Sold Median and a Falling Listing Median for Park Shore, FL, with each source dated and its limits noted, for owners weighing a listing against a direct sale.
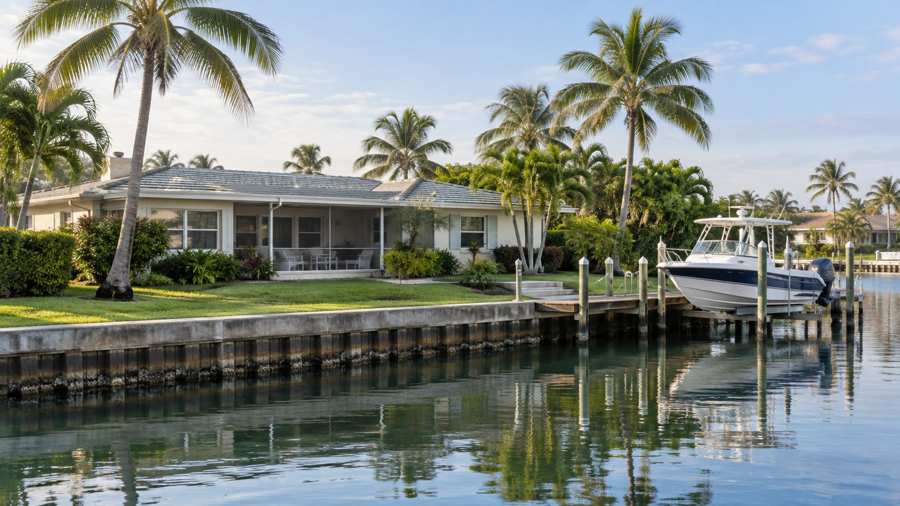
What is a typical Park Shore home worth? Realtor.com's page for the neighborhood gives two answers that point in opposite directions. The median sold price in September 2026 is $1,675,000, up 59.52% on the year. The median listing price is $1,845,000, down 15.91%. A year ago the typical sale was about $1,050,000 and the typical listing about $2,194,000, so the sale price has overtaken most of the distance to the asking price while the asking price has come down to meet it.
The month-to-month figure is stranger. The sold median fell 28.27% in a single month, which implies that August's typical sale was near $2,335,000. A neighborhood does not lose $660,000 of value in thirty days. What changes is which homes close in a month, and in a place where the sales are few and the prices run from a few hundred thousand dollars for a hotel condominium to several million for a house on the water, the median can leap in either direction.
The Redfin page for the neighborhood adds a different problem. It reports February 2025 data. This brief reads the Realtor.com page and the Redfin page side by side, adds the Census profile of the postal area, in which 47.3% of the homes are vacant, and the Naples area series, and asks what the numbers mean for an owner who is choosing between a public listing and a private sale.
Key Findings
- Realtor.com reported, as of September 2026, a median listing price of $1,845,000 for Park Shore (up 0.27% on the month and down 15.91% on the year), a median sold price of $1,675,000 (down 28.27% and up 59.52%), $919 per square foot (up 1.53% and down 9.43%), 149 homes for sale (down 11.23% and down 11.70%) and a median of 130 days on market (down 0.37% and down 21.18%).
- The same page gave a sale-to-list ratio of 91%, with homes selling 8.54% below the asking price, and called September 2026 a buyer's market. It counted 163 rentals (down 13.20% on the year) at a median rent of $13,500 a month (up 3.85%).
- Redfin reported, in a page whose figures are for February 2025, a median sale price of $2.0 million (down 11.1% on the year), $1,180 per square foot (up 20.8%), 96 days on market against 76 a year earlier and 49 homes sold against 52. It called the market not very competitive.
- In the Census postal area that includes Park Shore, 5,473 of 10,385 housing units are occupied, 4,912 (47.3%) are vacant, owners hold 4,703 of the occupied homes (85.9%), the median household income is $116,875 and the owner-estimated median home value is $950,900 (Census Reporter, American Community Survey profile).
- In the Naples-Marco Island area the median days on market was 87 in April 2026 and 106 in August (Realtor.com, days on market).
How can the sold median rise 59 percent while the listing median falls 16?
The two medians describe different homes. The listing median is the middle of everything that is for sale now, 149 homes. The sold median is the middle of whatever closed in the month, and in a buyer's market in a resort town in September, that may be a few dozen homes. The mix of those few can differ from the mix of the 149 by a wide margin.
The sold median has swung both ways. It is up 59.52% on the year and down 28.27% on the month. Taken together, the three figures imply sold medians of about $1,050,000 a year ago, $2,335,000 last month and $1,675,000 now. The last month's figure was probably lifted by a handful of expensive sales. September's was lower because fewer of them closed.
The listing median moves less. It is $1,845,000, up 0.27% on the month, and down 15.91% on the year, which implies about $2,194,000 a year ago. A fall of $349,000 in the typical asking price over a year is large, and it fits a market in which sellers have been cutting. The price per square foot says the same thing: $919, down 9.43%, from about $1,015.
The gap between the two latest medians is $170,000, so the sold median is 90.8% of the listing median. The sale-to-list ratio of 91% and the 8.54% discount say much the same thing for individual sales, and imply that a $1,675,000 sale gave up about $143,000 from its asking price. That is a heavy discount, and it is the figure an owner should weigh.
A seller should also notice what the page calls the market. It labels September a buyer's market, and the ratio of 91% agrees with that label. A buyer who knows this arrives with a lower offer in mind, and with 149 homes to choose from, can afford to wait. A seller who prices at the listing median and hopes for the sold median of a good month is likely to be disappointed.
The honest reading is that Park Shore is a market where asking prices have fallen, sales close at about 9% below them, and the sold median swings with the mix. An owner should not take either 59% or 28% as a rate of change in value. They are signs of a small and uneven set of sales.
| Indicator | Level | Change on the month | Change on the year |
|---|---|---|---|
| Median listing price | $1,845,000 | +0.27% | -15.91% |
| Median sold price | $1,675,000 | -28.27% | +59.52% |
| Price per square foot | $919 | +1.53% | -9.43% |
| Homes for sale | 149 | -11.23% | -11.70% |
| Days on market | 130 | -0.37% | -21.18% |
Source: Realtor.com page as cited. The $1,050,000, $2,335,000, $2,194,000, $349,000, $1,015, $170,000, 90.8% and $143,000 figures are this brief's arithmetic from the stated changes. The explanation based on the mix of sales is this brief's reasoning and not a statement of the page. Commercial content; not independently verified.
Is a wait of 130 days a fast market or a slow one?
Realtor.com says the median listing has been on the market for 130 days, down 21.18% on the year, which implies about 165 days a year earlier. It calls the market warm, a word that sits oddly beside a buyer's market and a 91% sale-to-list ratio. The wait of four months is shorter than a year ago and still long.
The region is quicker. In the Naples-Marco Island area, the median days on market was 87 in April, 95 in May, 102 in June, 104 in July and 106 in August, a rise of 19 days or 21.8% in four months. Park Shore's 130 is 24 days, or 22.6%, longer than the regional figure for August. A home in this neighborhood waits longer than the typical home in the area.
The regional rise is the sharper story. Summer is the quiet season in Naples, when seasonal owners are away and few buyers visit, and the regional wait has climbed through it. An owner who lists in September is listing into the weeks before the winter season, and the wait may shorten as buyers return. That is a reason to think about timing, but it is a guess and not a forecast.
The wait also varies with the kind of home. A condominium near the beach, priced for a seasonal buyer, tends to move when the season opens, and a larger house on a canal may take much longer. The page gives one figure for all of them, so the 130 days is an average of two kinds of experience, and an owner should ask which kind their own home resembles.
A wait of 130 days at this price level is a cost. A home at $1.7 million carries taxes, insurance, a pool or condominium dues and upkeep for over four months before a buyer is found, and then a closing takes weeks. A sale that closes on a date the seller picks removes that uncertainty.
Source: Realtor.com page as cited, and Realtor.com series for the Naples area. The 165 day, 19 day, 21.8%, 24 day and 22.6% figures are this brief's arithmetic. The remarks on the season and on timing are this brief's reasoning and not statements of the sources.
What does a Redfin page from February 2025 still say?
The Redfin page for Park Shore reports a median sale price of $2.0 million, down 11.1% on the year, a price per square foot of $1,180, up 20.8%, 96 days on market against 76, and 49 homes sold against 52. It says that these are figures for February 2025. The page is 19 months older than the Realtor.com page.
The figures are not useless, but they are a different year. A price of $2.0 million in early 2025 and a sold median of $1,675,000 in September 2026 are 16.3% apart, though the two cover different seasons and different sets of sales. The price per foot of $1,180 on Redfin is 28% above the Realtor.com listing price per foot of $919, which suggests that the Redfin page was describing larger or better homes, or the winter season, when the top of the market trades.
There is a general lesson for owners. A page that does not carry a current date should not be used as a current price. Before relying on any figure, check the month it describes. This brief reports the Redfin figures as February 2025 and gives them no weight in the present.
The February wait of 96 days on Redfin was 20 days longer than the year before. It is still shorter than the 130 days of the current Realtor.com page, which is consistent with a market that has slowed over the nineteen months, though the two sources measure the wait differently.
Source: Redfin and Realtor.com pages as cited. The 16.3%, 28% and 20 day figures are this brief's arithmetic. The explanations of the difference are this brief's reasoning and not statements of the pages. Commercial content; not independently verified.
Why do rentals outnumber homes for sale?
The Realtor.com page counts 163 rentals in Park Shore against 149 homes for sale, so there are 14 more rentals, 9.4% more. The rentals are down 13.20% on the year, which implies about 188 a year earlier, and the median rent is $13,500 a month, up 3.85%. In a place where many owners are seasonal, a home is often both an asset and a rental, and the owner can choose which market to use.
The neighborhood table lists 24 homes for sale in named condominium communities and subdivisions. Park Shore Resort has 8, Solamar 4, and Bay Shore Place, Colony Gardens, Swan Lake Club and Villas of Park Shore 2 each. Harborside Terrace, Le Jardin, Pelican Point and The Tropics have one each. The 24 are 16.1% of the 149. The remaining 125 are not in a named community in the table.
Park Shore Resort has a median listing price of $348,250, or $403 per square foot. That is a very different product from the neighborhood's $1,845,000 and $919. A median taken across a hotel condominium at $348,250 and a house on the water at several million is a number that describes neither. An owner will do better to find sales of homes like their own.
The postal area that includes Park Shore is larger. The Realtor.com table shows 314 homes for sale in it, down 17.29%, with a median listing price of $1,475,000. Park Shore's 149 is 47.5% of that stock, and its median listing price is 25.1% higher.
| Community | Homes for sale | Change on the year | Rentals |
|---|---|---|---|
| Park Shore Resort | 8 | -20% | 3 |
| Solamar | 4 | -50% | 4 |
| Bay Shore Place | 2 | not stated | 2 |
| Swan Lake Club | 2 | -60% | 2 |
| Villas of Park Shore | 2 | +200% | 0 |
| Other named communities, 18 homes in all | 1 or 2 each | varies | varies |
Source: Realtor.com page as cited. The 14, 9.4%, 188, 24, 16.1%, 125, 47.5% and 25.1% figures are this brief's arithmetic. The remark about seasonal owners is this brief's reasoning. Commercial content; not independently verified.
What does the Census say about a place where 47 percent of the homes are empty?
In the postal area that includes Park Shore, 5,473 of 10,385 homes are occupied and 4,912, 47.3%, are vacant. The Census counts a home as vacant if nobody lives in it as a usual residence when the survey is taken, and that includes seasonal and second homes. The table does not say how many of the 4,912 are seasonal, but a share this high is typical of a resort town.
Owners hold 4,703 of the 5,473 occupied homes, 85.9%, and renters 770, 14.1%. The population is 11,299, about 2.06 per occupied home. The median household income is $116,875 and the owner-estimated median home value is $950,900, with a margin of error of $106,413. The sold median of $1,675,000 is 14.3 times the income and 76.2% above the Census value. The Census values are of the people who live here year round, and the sales are of a market that serves a wider group of buyers.
The vacancy figure has a consequence for pricing. A place where nearly half the homes are empty for part of the year has a market that depends on buyers from elsewhere, and their decisions follow the season, the weather, the stock market and the cost of insurance, not local jobs or schools. That is one reason the medians swing as they do, and one reason a seller's timing matters.
The stock is of a middle age. The Census counts 3,612 homes from the 1970s (34.8%), 2,725 from the 1980s (26.2%) and 1,572 from the 1990s (15.1%). Homes built since 2000 number 1,127, 10.9%, and 4,961, 47.8%, were built before 1980. The median year built is 1981. A building from 1978 is 48 years old, and condominium buildings of that age often face assessments for roofs, concrete repairs and insurance.
The rent gap is wide. The Census median gross rent is $2,058, which reflects the year round tenants. The Realtor.com median asking rent is $13,500, which is 6.6 times as much and is a seasonal and short term price, not a lease price. The two numbers describe two different rental markets in the same place.
Source: U.S. Census Bureau, American Community Survey 2020-2024, and Realtor.com as cited. Ratios, shares and gaps are this brief's arithmetic. The remarks on seasonal homes, building age and rents are this brief's reasoning and not statements of the Census.
What does the Naples series add, and what should an owner ask?
Active listings in the Naples-Marco Island area fell from 6,869 in April 2026 to 4,676 in August (Realtor.com, active listings), a drop of 31.9%. New listings fell from 1,196 to 808 (Realtor.com, new listings), a drop of 32.4%. The regional median listing price slipped from $699,999 to $685,000 (Realtor.com, median listing price), a fall of 2.1%. The Park Shore listing median is 2.7 times that figure.
Homes with a price cut fell from 1,388 in May to 796 in August (Realtor.com, price reduced listings), which is 17.0% of the 4,676 active homes in August. The region is thinning out, with fewer homes listed and fewer cuts. Park Shore's own stock, down 11.7%, is following the same direction.
Whether an offer is public or private, an owner can test it with plain questions. What is the price, and is any part of it conditional on an inspection, a loan or the sale of another home? What will I take home after every charge? When will the sale close, and can that date move? Who pays for repairs the buyer asks for?
For a condominium or a home near the water there are more. Are there special assessments planned or pending for the building or the association? What do the reserve funds hold? What are the flood and wind insurance costs, and what will a buyer's insurer require? Are there rules on rentals, minimum stays or pets that limit the buyers? At a wait of 130 days, how much does an owner pay in dues, taxes and insurance before a sale? Readers comparing markets can also read the Ponte Vedra Beach brief and the Moorings brief.
Source: Realtor.com series published by the Federal Reserve Bank of St. Louis as cited. The 31.9%, 32.4%, 2.1%, 2.7 and 17.0% figures are this brief's arithmetic. The questions are this brief's general reasoning and not statements of any source.
What does a private sale change?
Maison Off-Market buys homes directly from their owners. It does not list a home, hold showings or put a home on a public listing. For a Park Shore owner, the five benefits are plain. There are no showings and no neighbors talking about the sale. The closing date can be flexible, which gives time to find a new home. There are no commission costs and no closing costs for the seller, and there are no inspections and repairs.
A little arithmetic shows what that is worth. Each 1% of a $1,675,000 sale is $16,750. A seller who gives up 3% gives up $50,250, and one who gives up 5% gives up $83,750. This brief does not claim that those are the costs of any sale, since the real figures depend on the agreement the seller signs. It shows how quickly a percentage becomes a sum.
For many owners of a second home, the question is not only the price but the effort. A public sale of a home that is empty for part of the year means arranging showings, keeping the home presentable and managing an agent from a distance. A direct sale can be done without any of that, and the closing date can be set for when the owner is in town or when the next home is ready.
The trade is that a private buyer may offer a price that differs from what a public sale could bring. In a market where sales close about 8.5% below the asking price and the wait is over four months, a seller may find a direct offer with a fixed date and a known price worth a serious look. The useful comparison is the price after every cost and every week of waiting, set against a closing date the seller picks.
Maison Off-Market speaks only to sellers. An owner who wants to know what a direct offer would look like can use the contact form below, or call 401-219-4207, and ask for a figure with no showings, no listing and no obligation.
Source: Maison Off-Market. The fee figures are this brief's arithmetic and not claims about any sale.
Methodology and limitations
Prices, price per square foot, days on market, listing and rental counts and the community table for Park Shore come from two commercial pages: a national listing site page with charts to August 2026 and a national brokerage page whose figures are for February 2025. They count different things, cover different periods and are not independently verified.
Age, tenure, vacancy, income, rent and owner-estimated value come from the American Community Survey 2020-2024 five-year estimates for the postal-code area that includes Park Shore. Shares are calculated from published counts, and owner-estimated value carries a margin of error.
Days on market, active and new listings, median listing price and price reduced counts are Realtor.com series published by the Federal Reserve Bank of St. Louis for the Naples-Marco Island metropolitan area. They describe the region and not the neighborhood. The brief makes no forecast and values no home.
Conclusion
The Park Shore record shows a sold median up 59.52% while the listing median fell 15.91%, a sold median that dropped 28.27% in a month, a sale-to-list ratio of 91%, a wait of 130 days, more rentals than homes for sale, a Census area that is 47.3% vacant and a Redfin page that describes February 2025.
It does not fix a price for any one home. The choice between a public listing and a private sale comes down to whether an owner would rather compete in that market or take privacy, a flexible closing date, no commission, no closing costs and no inspections or repairs. To see what a direct offer would look like for your home, use the contact form below or call 401-219-4207.
Frequently Asked Questions
What is the median home price in Park Shore?
Realtor.com reports a median sold price of $1,675,000 for September 2026, up 59.52% on the year, and a median listing price of $1,845,000, down 15.91%.
How long do Park Shore homes take to sell?
Realtor.com reports a median of 130 days on the market for September 2026. The Redfin page, for February 2025, reported 96 days.
Is Park Shore a buyer's or a seller's market?
Realtor.com calls September 2026 a buyer's market, with a sale-to-list ratio of 91%.
Why did the sold median fall 28 percent in a month?
The page does not say. The median depends on which homes close in a month, and a small number of expensive sales can lift it.
Does a private sale always beat a public listing?
No. A public listing can attract competing bids. A private sale offers privacy, a flexible closing date, no commission, no closing costs and no inspections or repairs.
Compare your options before committing. Request a written private offer for your property, with no obligation, then weigh it against your listing plan.
Sources
- Realtor.com, 2026. Park Shore Neighborhood of Naples, FL Housing Market. https://www.realtor.com/local/market/florida/naples/park-shore.
- Redfin, 2025. Park Shore, Naples Housing Market. https://www.redfin.com/neighborhood/216277/FL/Naples/Park-Shore/housing-market.
- U.S. Census Bureau, 2026. American Community Survey 2020-2024 five-year estimates, the Park Shore area (via Census Reporter). https://censusreporter.org/profiles/86000US34103-34103/.
- Realtor.com, 2026. Housing Inventory: Median Days on Market in Naples-Immokalee-Marco Island, FL (CBSA). https://fred.stlouisfed.org/series/MEDDAYONMAR34940.
- Realtor.com, 2026. Housing Inventory: Active Listing Count in Naples-Immokalee-Marco Island, FL (CBSA). https://fred.stlouisfed.org/series/ACTLISCOU34940.
- Realtor.com, 2026. Housing Inventory: New Listing Count in Naples-Immokalee-Marco Island, FL (CBSA). https://fred.stlouisfed.org/series/NEWLISCOU34940.
- Realtor.com, 2026. Housing Inventory: Median Listing Price in Naples-Immokalee-Marco Island, FL (CBSA). https://fred.stlouisfed.org/series/MEDLISPRI34940.
- Realtor.com, 2026. Housing Inventory: Price Reduced Count in Naples-Immokalee-Marco Island, FL (CBSA). https://fred.stlouisfed.org/series/PRIREDCOU34940.
Related research

Seller Guide · October 6, 2026
How to Prepare Point Pleasant Beach Rental Records Before Selling
Separate rental approval, income history and booked stays before comparing sale terms.

Seller Guide · October 6, 2026
How to Prepare Rumson Flood and Waterfront Records Before Selling
Separate flood disclosure, elevation, repairs and waterfront rights before comparing sale terms.

Seller Guide · October 6, 2026
How to Prepare Sarasota Condo Inspection and Reserve Records Before Selling
Separate building condition, reserve funding and resale documents before comparing sale terms.