Market Brief · by Aidan Sowa · October 5, 2026
How Quickly Do Gig Harbor Homes Sell, and What Must Owners Prepare? Reading the Pace, the Tenure and the Mortgages
Gig Harbor postal timing, owner costs and Washington disclosure duties, for sellers comparing a listing with a direct offer.
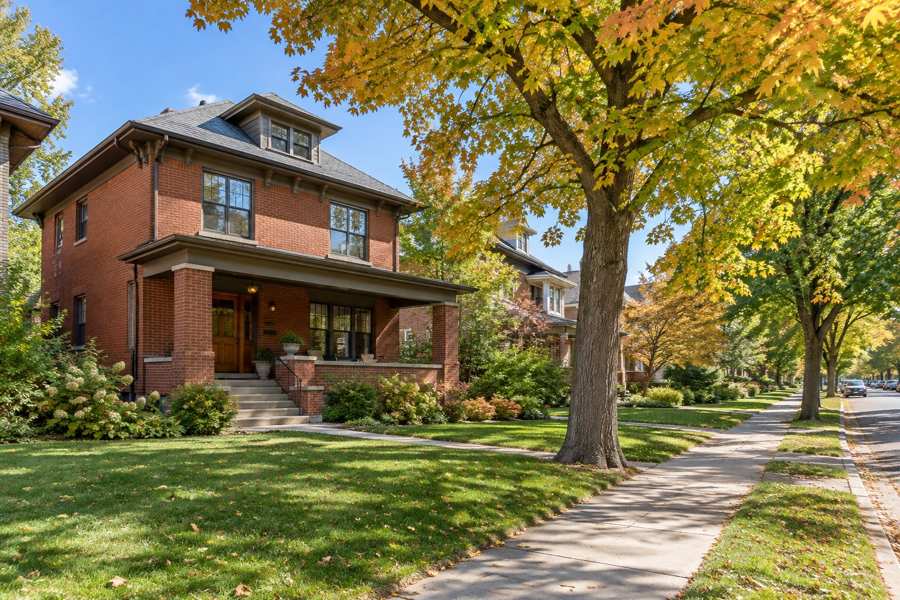
How quickly do Gig Harbor homes sell, and what must owners prepare? Redfin's August-labeled block reports sixteen market days, while Realtor.com's June table reports thirty-one. Their periods and timing definitions differ. Neither guarantees a full closing schedule. Seller articles add another layer: financing proof, written contingencies, repair records and Washington disclosures must be considered alongside the displayed pace.
The survey describes the postal area's housing population, not identified people selling now. Of 10,995 occupied homes, 8,340, or 75.9%, are owned. The Census median owner value is $791,100, with a $36,022 margin of error, while Redfin's sale median is $959,585. Realtor.com's June page is two months older than Redfin's August window. Mortgage and tenure counts provide context, not a list of motivated sellers or a payoff estimate for anyone.
A quick marketing statistic does not establish what a seller will need to do, who is selling now or how much cash remains. The sections below pair dated local evidence with substantive publisher advice on pricing, preparation, timing and disclosure. A direct purchase can change marketing and seller repair work, but the written agreement and applicable duties still matter.
Key Findings
- The Census median owner value is $791,100, with a margin of error of $36,022, from the five-year survey ending in 2024. Redfin's page, covering the three months ending August 2026, shows a median sale price of $959,585, up 3.7% on the year. Realtor.com's page, with key indicators as of June 2026, shows a median sold price of $855,000, up 1.97% on the year, and a median listing price of $1,048,475, down 2.50%.
- Of 10,995 occupied homes, 8,340, or 75.9%, are owned. Of 8,340 owner homes, 5,829, or 69.9%, have a mortgage. Among those, 1,694, or 29.1%, spend 30% or more of income on owner costs, and 602, or 10.3%, spend half or more.
- Among 2,511 owners without a mortgage, 225, or 9.0%, spend 30% or more of income on owner costs. The largest band for them is under 10%, at 1,068 homes.
- Of 11,435 housing units, 3,536, or 30.9%, were built before 1980, and 2,821, or 24.7%, were built in 2000 or later. The median build year is 1990.
- Washington Realtors articles explain why seller disclosures and inspection instructions need care even in a competitive market. Realtor.com's offer article recommends checking financing evidence and the proposed closing timeline rather than comparing price alone.
What do the Gig Harbor price pages say, and where do they disagree?
The Census owner-value estimate is $791,100, with a $36,022 margin of error. Redfin reports a $959,585 sold median for the three months ending August 2026. Realtor.com's June figures show a $855,000 sold median and $1,048,475 listing median. The older June page and August window cover different dates and groups; neither is the same measure as the pooled owner survey.
Both sold medians are above Census owner value: Redfin by $168,485, or 21.3%, and Realtor.com by $63,900, or 8.1%. These are descriptive gaps between different populations and periods, not proof of appreciation. Census statistical-testing guidance requires uncertainty in survey comparisons; one margin cannot independently validate gaps against unmatched market medians. NAR's pricing article recommends size, location, amenities and condition, with sold, pending and active comparable properties. Ask which Gig Harbor records actually support a suggested price rather than treating this numerical spread as a valuation range.
Redfin's sale median rose 3.7% annually; Realtor.com's sold median rose 1.97% annually and 8.57% over three years. Realtor.com's listing median fell 2.50% annually, rose 2.15% monthly and rose 8.57% over three years. It is 22.6% above that page's sold median. These changes describe the published aggregates, not repeated sales of the seller's property or a guaranteed price trend for it.
Redfin reports $378 per square foot, up 2.4% annually. Realtor.com's table shows $411, down 4.43%, but does not label its population equally clearly. Redfin's Metrics Definitions distinguishes median sold prices from asking prices of listed homes, and Realtor.com's research library defines its listing-price-per-square-foot series as a listing measure. Do not silently equate the local table with a sold-home statistic. The 8.7% numerical gap is descriptive, not evidence that one publisher mispriced your home.
Realtor.com's June table has annual and three-year headings. Sold and listed medians both show 8.57% over three years, which can be identical rounded changes without an error. Its separate narrative gives monthly movements; those should not replace the table headings. Repeated rental percentages likewise do not prove false data. A city-only Zillow value is not substituted for postal evidence. Keep each date, population and period attached instead of deciding credibility from a repeated number.
| Source | Figure | What it measures |
|---|---|---|
| Census Reporter | $791,100 | Median owner value, five-year estimate ending 2024, margin of error $36,022 |
| Redfin | $959,585, up 3.7% | Median sale price, three months ending August 2026 |
| Realtor.com | $855,000, up 1.97% | Median sold price, June 2026 (older page) |
| Realtor.com | $1,048,475, down 2.50% | Median listing price, June 2026 (older page) |
Sources as cited. Earlier values and differences are computed from the published percentages.
Who owns the homes in Gig Harbor, and for how long?
Of 10,995 occupied homes, 8,340, or 75.9%, are owner occupied and 2,655 rented. Occupancy is not a list of sellers: an investment-property seller may own a rented home. The survey does not establish owner and renter income differences or identify who currently intends to sell.
Of owner households, seventy-seven moved in during 2023 or later, 1,419 in 2020-2022, 3,415 in the 2010s, 1,274 in the 2000s and 2,155 before 2000. NAR's Thinking of Selling article asks about home fit, changes in lifestyle or income, and the burden of maintenance. It also notes that keeping a low mortgage rate can favor staying. Those are useful questions for long-held homes, not findings about why postal-area owners are moving. Move-in dates establish neither equity nor seller urgency.
Owner homes are mostly mid-sized to large. Of 8,340, 4,275 have three bedrooms, 51.3%, 2,467 have four, 29.6%, 931 have two, 11.2%, 633 have five or more, 34 have one and none have no bedroom. Homes with four or more bedrooms number 3,100, or 37.2%. Renter homes are smaller: of 2,655, 1,011 have two bedrooms, 38.1%, 898 have three, 33.8%, and 533 have one.
The population is 27,773, plus or minus 1,541. Residents forty-five or older total 13,458, or 48.5%; 6,734 are sixty-five or older. These counts do not identify homeownership, seller motives or how soon a household needs to move. Personal plans and the cost of the next home need separate evidence.
Median household income is $128,592, plus or minus $10,578. Census gross rent is $2,120, plus or minus $126; its subject guide includes specified utilities and fuels paid separately by renters. Realtor.com's $2,650 asking rent concerns listed rentals, not those pooled occupied homes. Its 1.25 ratio to Census rent does not calculate a change for matching properties or a rent that any specific home will earn. Keep definitions, period and uncertainty visible.
Sources as cited. Shares are computed from the Census counts.
How heavy are mortgages and other owner costs in Gig Harbor?
Most owners have a mortgage. Of 8,340 owner homes, 5,829, or 69.9%, have one, and 2,511, or 30.1%, have none. Every home with a mortgage has a computed share of income spent on owner costs.
Among 5,829 owners with mortgages, 1,694, or 29.1%, spend thirty percent or more of income on selected owner costs; 602, or 10.3%, spend half or more. The Census owner-cost definition includes mortgage-related payments, taxes, insurance, utilities and specified additional charges. It is not simply a mortgage payment or every maintenance expense. The largest reported band is not a complete account of the typical household, and the share does not show remaining debt or equity.
Among 2,511 owners without mortgages, 225, or 9.0%, spend thirty percent or more of income on selected owner costs; seventy-three, or 2.9%, spend half or more. The largest band is under ten percent, with 1,068 homes. The Census definition still includes applicable taxes, insurance, utilities and other specified housing charges. No mortgage does not mean no carrying costs, but these survey totals do not establish the actual bill or sale urgency of a particular owner.
Among 2,611 renter households with a computed income share, 1,206, or 46.2%, cross thirty percent and 609, or 23.3%, cross half. Another forty-four have no computed share. Renters cross these thresholds more often than owners, but that does not establish higher dollar costs for matching households. These survey groups do not identify tenants planning to move or an owner's proceeds.
Vacant homes are 440 of 11,435, or 3.8%, including 146 for rent, nineteen sold but unoccupied, 105 seasonal and 170 other vacant. Census vacation-home guidance counts stays of at least two months from interview as current residence; shorter temporary stays can remain vacant. The pooled survey is not a single day of empty homes or active listings. A zero point estimate for units vacant for sale only is not proof that no house was available to purchase.
The CFPB's payoff explanation distinguishes an account balance from the amount needed to satisfy a mortgage on a specific date. Payoff can include accrued interest, unpaid fees and an applicable prepayment charge. A seller comparing proceeds should obtain the date-specific statement from the servicer rather than estimate debt from the area's mortgage share. This is a transaction-planning distinction, not a claim that a particular Gig Harbor loan has a penalty or that any survey household is selling.
| Share of income on owner costs | Owner homes with a mortgage | Share of computed |
|---|---|---|
| Under 10% | 530 | 9.1% |
| 10% to 14.9% | 1,078 | 18.5% |
| 15% to 19.9% | 758 | 13.0% |
| 20% to 24.9% | 1,033 | 17.7% |
| 25% to 29.9% | 736 | 12.6% |
| 30% to 34.9% | 578 | 9.9% |
| 35% to 39.9% | 251 | 4.3% |
| 40% to 49.9% | 263 | 4.5% |
| 50% or more | 602 | 10.3% |
Sources as cited. Shares are computed from the Census counts.
How are the Gig Harbor building years spread, and how fast do homes sell?
Building years cluster in the last decades of the twentieth century. Of 11,435 housing units, 2,795 were built in the 1990s, 24.4%, 2,309 in the 1970s, 20.2%, 2,283 in the 1980s, 20.0%, and 1,648 in the 2000s, 14.4%. The 1990s are the largest single decade, and the median build year is 1990. Units built before 1980 total 3,536, or 30.9%.
Older and newer bands are smaller than the nineties group: 326 units predate 1940, fifty-four date to the forties, 134 to the fifties and 713 to the sixties. The 2010s account for 908 and 2020 or later for 265. NAR's preparation article advises estimating major repairs even if a seller will not do the work, because buyers may consider costs in negotiation. Collect warranties and manuals for systems remaining in the house. Construction age does not diagnose condition or establish a renovation return.
The housing stock is mostly detached. Of 11,435 units, 9,033, or 79.0%, are detached houses, 597 are attached houses, 185 are in two-unit buildings, 279 in buildings of three or four units, 1,242, or 10.9%, in buildings of five or more units and 99 are mobile homes. Of the larger buildings, 357 are in buildings of five to nine units, 302 in ten to nineteen, 242 in twenty to forty-nine and 341 in fifty or more.
Redfin reports a competition score of eighty-three, sixteen market days and 123 sales in its August block. Its narrative also refers to a three-month window; the count is retained as displayed, not used as a clean monthly supply denominator. The summary gives twenty-four pending days and two offers on average. Its generic reference to waived contingencies is not proof of terms for your buyer. Washington Realtors' article about offer instructions warns sellers to seek legal advice before demanding inspection waivers, because denying due diligence can create later disclosure disputes.
Realtor.com's June table shows thirty-one days, up 8.48% annually and down 11.11% over three years; 141 listings, down 10.22% annually and up 18.27% over three years; and a rounded 100% sale-to-list ratio. Its narrative separately mentions monthly changes. These do not promise the owner's closing date. NAR's Multiple Offers article emphasizes financial terms, contingencies, earnest money and timeline alongside price. An apparently strong offer still needs those conditions examined rather than a conclusion drawn from the hot-market label.
Realtor.com's article on selecting an offer recommends reviewing a financed buyer's preapproval and a cash buyer's proof of funds. It says the proposed closing date should suit the seller, who may need time to move even in a fast market. Cash removes the mortgage-approval step, not every contractual risk. Those points are directly useful when interpreting sixteen marketing days: obtain the actual evidence and agreed dates rather than assume that a cash label or short local median is completion certainty.
Redfin's methodology describes rolling three-month windows for smaller areas, including postal areas. Realtor.com's data library defines its monthly days measure using time from initial listing to closing or removal. These differences help interpret sixteen days versus thirty-one; they do not promise your timetable or prove the exact cause of the gap. Both local pages show a slower annual pace, but use different dated groups. Compare Laurelhurst and Kirkland only with the same scope checks.
Sources as cited. Shares are computed from the Census counts.
What should a Gig Harbor owner ask before choosing a listing or a private sale?
Washington Realtors' Overconfident Sellers article explains that never having occupied a property does not by itself exempt a seller from disclosure duties. Its example distinguishes an estate transfer from ordinary trust ownership. Check the current statute and actual ownership rather than assume an inherited or rented home is exempt. RCW 64.06.010 lists specific exceptions, including a personal representative's estate transfer and certain family or foreclosure transfers; a private purchase alone is not a listed blanket exemption. Have counsel check the transaction rather than treating a postal owner count as permission.
Under the version of RCW 64.06.020 effective until January 2027, covered sellers generally deliver a completed disclosure within five business days after mutual contract acceptance unless otherwise agreed. The statute asks for actual known facts and says not to leave blanks. RCW 64.06.010 limits waiver of the Environmental section where an answer would be yes. The page also contains a later version; this brief does not apply future text early. Confirm the actual sale's date, duties and exemptions with the transaction professional.
Washington Realtors' disclosure article stresses proof of delivery rather than merely attaching a form to a listing. Its offer-instructions article warns that withholding known material conditions can create disputes even where a buyer waived receipt of a form. Those are seller-preparation lessons, not an instruction to suppress records or insist on waivers. Assemble the available condition information and discuss disclosure duties with counsel. An as-is price negotiation or no seller repair work does not automatically remove applicable disclosure responsibilities.
NAR's Listing Agreements article says compensation is negotiable and not set by law; exclusive right-to-sell arrangements can require payment whoever finds the buyer. A direct sale does not automatically cancel an existing agreement. One, three or five percent of $791,100 is $7,911, $23,733 or $39,555, arithmetic examples rather than rates or a valuation. Compare actual commissions, charges, concessions, payoff and timing under the written proposals. A speculative listing result and a firm offer do not have identical certainty.
Maison Off-Market describes direct purchases without public showings, with flexible dates and no commissions, seller closing costs or seller repair work. Compare written terms with a realistic listing alternative, including existing agency obligations, applicable disclosures and remaining buyer conditions. No seller repair work is not a promise that every inspection or duty disappears. Privacy does not guarantee what neighbors know. A direct sale does not always yield more cash, and a chosen date remains subject to the agreement.
Sources as cited. Fee figures are arithmetic and not quoted rates.
Methodology and limitations
Market pages were checked October 6, 2026. Redfin labels an August block with three-month narrative; Realtor.com labels June and an annual/three-year table, with separate monthly narrative. Those dates and headings remain attached. Repeated rounded changes do not by themselves prove errors. Contract marketing time differs from full closing time. No city-level Zillow value or neighborhood table replaces postal evidence.
ACS 2020-2024 estimates pool sixty months and describe postal residents and stock, not identified sellers. Margins remain attached; counts and shares were checked against tables. Income shares are not matching-household dollar costs, owner value is not a current appraisal, and gross rent is not today's asking rent. No price gap or demographic group establishes an individual's motive, debt or property value.
Publisher articles were used for pricing, personal timing, preparation, financing evidence, offer comparison, listing obligations and Washington disclosures. Older Washington articles supply practical context; the current statute controls the legal summary, including its present and future versions. No statement here is property-specific legal advice or a forecast.
Conclusion
Gig Harbor's dated pages show short marketing measures and mostly owner-occupied postal stock, not identified sellers or guaranteed closings. Authoritative articles turn that context into specific preparation: matching records, system documents, financing evidence, disclosure delivery and written terms. Compare actual proceeds, timing and obligations under a listing and direct purchase. A median, competition label or no-repair slogan cannot do that work for one house.
Frequently Asked Questions
What is the median owner value in Gig Harbor?
The Census median owner value is $791,100, with a margin of error of $36,022. Redfin showed a median sale price of $959,585 for the three months ending August 2026, and Realtor.com showed a median sold price of $855,000 for June 2026.
How many Gig Harbor homes are owner-occupied?
The Census counts 8,340 of 10,995 occupied homes, 75.9%, as owned. Of those owner homes, 69.9% have a mortgage.
How heavy are mortgage costs in Gig Harbor?
Of 5,829 owners with a mortgage, 1,694, or 29.1%, spend 30% or more of income on owner costs, and 602, or 10.3%, spend half or more.
How old are Gig Harbor homes?
The Census counts 3,536 of 11,435 units, 30.9%, as built before 1980, and the median build year is 1990.
Can I sell my Gig Harbor home privately?
Maison Off-Market describes direct purchases without public showings, with flexible dates and no commissions, seller closing costs or seller repair work. Compare written terms, existing listing obligations, applicable disclosures and remaining buyer conditions.
Compare your options before committing. Request a written private offer for your property, with no obligation, then weigh it against your listing plan.
Sources
- Redfin, 2026; accessed October 6, 2026. 2026 98335 Housing Market: House Prices & Trends as of September | Redfin. https://www.redfin.com/zipcode/98335/housing-market.
- Realtor.com, 2026; accessed October 6, 2026. 98335 Housing Market Data - Gig Harbor, WA Home Prices & Rental Trends | realtor.com®. https://www.realtor.com/local/market/washington/zipcode-98335.
- U.S. Census Bureau via Census Reporter, 2020-2024 ACS five-year estimates; accessed October 6, 2026. Housing, population and household estimates for the postal area, detailed tables B25077, B25035, B19013, B25064, B01003, B25034, B25024, B25004, B25038, B25070, B25042, B25091, B25003 and B01001. https://api.censusreporter.org/1.0/data/show/latest?table_ids=B25077,B25035,B19013,B25064,B01003,B25034,B25024,B25004,B25038,B25070,B25042,B25091,B25003,B01001&geo_ids=86000US98335.
- Redfin, Checked October 6, 2026. Housing-data methodology: local rolling windows. https://www.redfin.com/news/data-center/methodology/.
- Redfin, Checked October 6, 2026. Metrics Definitions: listed and closed-home populations. https://www.redfin.com/news/data-center-metrics-definitions/.
- Realtor.com Research, Checked October 6, 2026. Residential data library: price per foot and listing-time definitions. https://www.realtor.com/research/data/.
- U.S. Census Bureau, Checked October 6, 2026. Using one-year or five-year ACS data: period and precision. https://www.census.gov/programs-surveys/acs/guidance/estimates.html.
- U.S. Census Bureau, Checked October 6, 2026. Statistical Testing Tool: uncertainty in survey comparisons. https://www.census.gov/programs-surveys/acs/guidance/statistical-testing-tool.html.
- U.S. Census Bureau, Checked October 6, 2026. Selected monthly owner costs: included payments and charges. https://www.census.gov/quickfacts/note/HSG650222.
- Consumer Financial Protection Bureau, Checked October 6, 2026. Payoff amount differs from current balance: date-specific debt. https://www.consumerfinance.gov/ask-cfpb/what-is-a-payoff-amount-and-is-it-the-same-as-my-current-balance-en-205/.
- National Association of REALTORS, Checked October 6, 2026. Consumer Guide: What Goes Into Pricing Your Home. https://www.nar.realtor/the-facts/consumer-guide-what-goes-into-pricing-your-home.
- National Association of REALTORS, Checked October 6, 2026. Consumer Guide: Preparing to Sell Your Home. https://www.nar.realtor/the-facts/consumer-guide-preparing-to-sell-your-home.
- National Association of REALTORS, Checked October 6, 2026. Consumer Guide: Navigating Multiple Offers. https://www.nar.realtor/the-facts/consumer-guide-navigating-multiple-offers.
- National Association of REALTORS, Checked October 6, 2026. Consumer Guide: Thinking of Selling? Factors to Consider. https://www.nar.realtor/the-facts/consumer-guide-thinking-of-selling-7-factors-to-consider.
- National Association of REALTORS, Checked October 6, 2026. Consumer Guide: Listing Agreements. https://www.nar.realtor/the-facts/consumer-guide-listing-agreements.
- U.S. Census Bureau, Checked October 6, 2026. How ACS counts vacation homes. https://www.census.gov/help/topics/faq.how-does-the-acs-count-vacation-homes.html.
- U.S. Census Bureau, Checked October 6, 2026. ACS subject definitions: value and gross rent. https://www2.census.gov/programs-surveys/acs/tech_docs/subject_definitions/2024_ACSSubjectDefinitions.pdf.
- Washington Realtors, Checked October 6, 2026. Overconfident Sellers Plus Overeager Buyers Equals Broker Liability. https://www.warealtor.org/about-us/contact-us/news-media/blogdetails/articles/2021/11/29/overconfident-sellers-plus-overeager-buyers-equals-broker-liability.
- Washington Realtors, Checked October 6, 2026. Listing Brokers: Offer Instructions Can Be Dangerous to Sellers. https://www.warealtor.org/about-us/contact-us/news-media/blogdetails/articles/2021/11/29/listing-brokers---did-you-know-that-offer-instructions-can-be-dangerous-to-sellers.
- Realtor.com, Tara Mastroeni, Checked October 6, 2026. What Sellers Should Look For in an Offer. https://www.realtor.com/advice/sell/what-home-sellers-should-look-for-in-an-offer/.
- Washington Legislature, Checked October 6, 2026. RCW seller disclosure exceptions. https://apps.leg.wa.gov/rcw/default.aspx?cite=64.06.010.
- Washington Legislature, Checked October 6, 2026. RCW improved residential disclosure duties, current and future versions. https://apps.leg.wa.gov/rcw/default.aspx?cite=64.06.020.
Related research

Seller Guide · October 6, 2026
How to Prepare Point Pleasant Beach Rental Records Before Selling
Separate rental approval, income history and booked stays before comparing sale terms.

Seller Guide · October 6, 2026
How to Prepare Rumson Flood and Waterfront Records Before Selling
Separate flood disclosure, elevation, repairs and waterfront rights before comparing sale terms.

Seller Guide · October 6, 2026
How to Prepare Sarasota Condo Inspection and Reserve Records Before Selling
Separate building condition, reserve funding and resale documents before comparing sale terms.