Comparison · by Aidan Sowa · October 5, 2026
When Does Holding a Kirkland Home Stop Paying? Reading the Mortgage Rate, the Inventory Build and the Jobless Rate
Reading the Mortgage Rate, the Inventory Build and the Jobless Rate for Kirkland, WA, with each source dated and its limits noted, for owners weighing a listing against a direct sale.
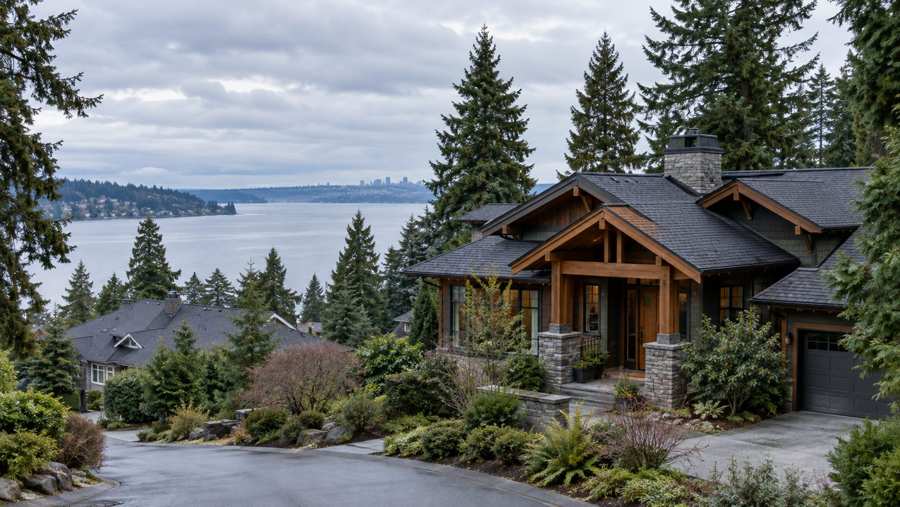
A homeowner in Kirkland who is weighing a sale this year against a sale in 2027 is weighing four moving parts: the cost of borrowing, the number of competing homes, the direction of prices and the health of the local job market. All four have public measures. The 30-year fixed mortgage rate averaged 7.28% in the first week of October 2026, up from 6.34% a year earlier (Freddie Mac, 2026). Active listings in the Seattle area rose to 13,078, up 28.5% in twelve months (Realtor.com, 2026).
The home itself sits in a high-value area. The median owner-estimated value is $1,491,700 and the median home was built in 1989 (U.S. Census Bureau, 2020-2024). This report lines up each measure and shows what a hold-until-2027 plan has to assume for it to pay off.
Key Findings
- The Kirkland study area has 18,448 housing units, 63.2% of occupied homes are owner-occupied, and the median owner-estimated value is $1,491,700, plus or minus $92,501.
- The 30-year fixed rate was 7.28% on October 1, 2026, against 6.34% on October 2, 2025 and 6.16% on January 8, 2026.
- Seattle-area active listings were 13,078 in September 2026, up from 10,177 a year earlier and 4,774 three years earlier. 5,510 of them (42.1%) carried a price cut (Realtor.com, active listings, 2026; Realtor.com, price cuts, 2026).
- The all-transactions price index for the Seattle-Bellevue-Kent division was 554.91 in the second quarter of 2026, up 0.3% on the year and 24.6% over five years (FHFA, price index, 2026).
- The metro unemployment rate was 4.9% in August 2026, against 4.6% a year earlier (BLS, unemployment rate, 2026).
What does the housing in the Kirkland area look like?
The Census counts 18,448 housing units in the area. They are spread across the decades more evenly than in many places: between 2,365 and 3,015 units in each decade from the 1960s through the 2010s, with older housing thinner. 6,717 units (36.4%) predate 1980. The median home was built in 1989.
The median owner estimate of value is $1,491,700 with a margin of error of $92,501, which is 6.2% and is wider than in the other areas in this series. At prices this high, a few percentage points of movement is a six-figure sum. An owner who is deciding between this year and next is deciding over amounts that are large relative to most household balance sheets.
Source: U.S. Census Bureau, American Community Survey 2020-2024 five-year estimates, tables B25034 and B25077, the postal-code area studied in Kirkland.
What has happened to the mortgage rate?
Freddie Mac's weekly survey put the 30-year fixed rate at 2.65% in January 2021 and at 6.34% in early October 2025. It dipped to 6.16% in January 2026 and has climbed since. The reading of October 1, 2026 was 7.28%, the highest in the last twelve months.
For a buyer, the move from 6.34% to 7.28% raises the monthly principal and interest on each $100,000 borrowed from about $622 to about $684, an increase of 10.1%. A buyer of a $1.49 million home with 20% down borrows about $1.19 million, so the same rate change costs that buyer roughly $740 more per month. These are arithmetic examples using a standard 30-year amortization, not a quote. They show why a rate rise narrows the pool of buyers who can pay a given price.
Source: Freddie Mac via FRED, 30-Year Fixed Rate Mortgage Average in the United States, weekly.
How crowded is the market a seller would join?
Realtor.com counted 13,078 active listings in the Seattle-Tacoma-Bellevue area in September 2026. A year earlier there were 10,177, three years earlier 4,774 and five years earlier 3,744. The latest reading is the highest of the last five years, and it is 3.5 times the five-year-ago count. (Realtor.com, active listings, 2026; Realtor.com, price cuts, 2026; Realtor.com, days on market, 2026)
The median listing took 51 days to sell, up from 47 a year earlier and 37 three years earlier. Price cuts followed the supply. 5,510 listings, 42.1% of the total, carried a reduction, against 39.9% a year earlier and 40.2% three years earlier. A seller in this part of Kirkland is therefore joining a market with more homes, slower sales and more price cuts than at any point in the last several years, and waiting is only helpful if supply eases, which this series does not yet show.
Source: Realtor.com via FRED, Housing Inventory: Active Listing Count, Price Reduced Count and Median Days on Market in Seattle-Tacoma-Bellevue, WA (CBSA).
Is it often said that Seattle-area prices only go up?
The long record supports it and the recent record does not. The Federal Housing Finance Agency's all-transactions index for the Seattle-Bellevue-Kent division reached 554.91 in the second quarter of 2026, after a record of 555.17 in the first quarter. It is 24.6% above its level five years earlier, at 445.41. But it is up only 0.3% on the year, from 553.11 (FHFA, price index, 2026; Realtor.com, list price, 2026; Realtor.com, price per square foot, 2026).
Listing prices tell the same story more sharply. The median list price in the metro area was $749,970 in September 2026, 2.4% below the $768,750 of a year earlier and 9.1% below its April 2023 peak of $825,000. The median list price per square foot fell 2.5% in the year, from $438 to $427. An owner who expects steady gains from holding is extrapolating from five years that are not the last twelve months.
Source: U.S. Federal Housing Finance Agency, All-Transactions House Price Index for Seattle-Bellevue-Kent, WA (MSAD), index 1995 Q1 = 100.
How is the local job market holding up?
The Bureau of Labor Statistics smoothed seasonally adjusted unemployment rate for the Seattle-Tacoma-Bellevue area was 4.9% in August 2026. A year earlier it was 4.6% and three years earlier 4.1%. It peaked at 5.4% in February 2026 and was as low as 3.6% in January 2022.
Rising unemployment affects a sale in two ways. It reduces the number of buyers who can qualify, and it raises the odds that a buyer's plans change between offer and closing. At 4.9% the area is far from a downturn, but the direction in the last year is up, and a seller timing a sale for 2027 is betting that the rate will turn around.
Source: U.S. Bureau of Labor Statistics via FRED, Unemployment Rate in Seattle-Tacoma-Bellevue, WA (MSA), smoothed seasonally adjusted.
Who lives in Kirkland's homes?
The area has 18,448 housing units, of which 17,400 are occupied and 1,048 (5.7%) are vacant. Owners live in 11,002 of the occupied homes (63.2%) and renters in 6,398 (36.8%). More than a third of the households rent, a notable share in an area where the median home value is nearly $1.5 million.
This matters for timing. A large rental population means a steady supply of potential first-time buyers, but they are the group most sensitive to the mortgage rate and to job security, which are the two measures moving the wrong way for sellers. An owner who relies on a first-time buyer to close should read the rate and unemployment figures below as direct inputs to the price.
How has the monthly payment changed for a buyer of a typical home?
Take a $1,491,700 purchase with 20% down, which means a loan of about $1,193,000. At January 2021's 2.65% rate the principal and interest on a 30-year loan would be about $4,800 per month. At October 2025's 6.34% it would be about $7,420. At October 2026's 7.28% it is about $8,160.
The buyer's payment is therefore about 70% higher than at the January 2021 rate, and 10% higher than a year ago, for the same house at the same price. This is why the price a buyer can pay does not move in step with the value of the house. A buyer's income and the lender's rules set a ceiling on the payment, and a higher rate lowers the price that fits under it. The figures are standard amortization arithmetic and exclude taxes, insurance and fees.
Are fewer homes coming to market, and is that helping?
New listings in the Seattle area numbered 4,676 in September 2026, which is 7.4% below the 5,048 of a year earlier and 15.8% below the 5,552 of five years earlier. Fewer owners are listing, and one reason is plausible: people with low-rate mortgages are reluctant to give them up (Realtor.com, new listings, 2026; Realtor.com, price per square foot, 2026).
The shortfall in new listings has not been enough to tighten the market, because active listings still rose 28.5% and the median price per square foot slipped 2.5% from $438 to $427. Fewer homes are arriving, but each stays longer. A seller cannot count on thin supply to produce a quick sale. Most of the competition a new listing meets is made up of older listings that have not sold.
Source: Realtor.com via FRED, Housing Inventory: New Listing Count and Median Listing Price per Square Feet in Seattle-Tacoma-Bellevue, WA (CBSA).
How has each year compared since 2021?
Table 1 sets the Seattle-area readings for each September beside the mortgage rate in the first week of October and the price index for the second quarter. The picture is of a market that peaked in 2022 and 2023 and has loosened since. Active listings rose from 3,744 in 2021 to 13,078 in 2026, a 3.5-fold increase. The median days on market rose from 29 to 51. The share of listings with a price cut was 34.6% in 2021, 54.8% in 2022 and 42.1% in 2026 (Realtor.com, active listings, 2026; Freddie Mac, mortgage rate, 2026; FHFA, price index, 2026).
The mortgage rate column has the sharpest swing. It was 2.99% in October 2021, 6.66% in 2022, 7.49% in 2023, 6.12% in 2024, 6.34% in 2025 and 7.28% in 2026. The 2026 reading is the second highest in the table, and it is 0.21 points below the 2023 peak. The price index, in contrast, fell from 542.77 to 517.66 between 2022 and 2023, then recovered to 554.91 by 2026. Values recovered while rates stayed high, which is the combination that has kept the market illiquid.
| Year | Active listings (Sept.) | With price cut | Days on market | Mortgage rate (early Oct.) | Price index (Q2) |
|---|---|---|---|---|---|
| 2021 | 3,744 | 1,294 (34.6%) | 29 | 2.99% | 445.41 |
| 2022 | 6,694 | 3,670 (54.8%) | 39 | 6.66% | 542.77 |
| 2023 | 4,774 | 1,920 (40.2%) | 37 | 7.49% | 517.66 |
| 2024 | 8,014 | 3,066 (38.3%) | 43 | 6.12% | 540.39 |
| 2025 | 10,177 | 4,056 (39.9%) | 47 | 6.34% | 553.11 |
| 2026 | 13,078 | 5,510 (42.1%) | 51 | 7.28% | 554.91 |
What does the calendar do to a Seattle-area listing?
The median days on market over the last thirteen months read 47 in September 2025, 48 in October, 56 in November, 67 in December and 77 in January. They then dropped to 36 in February, 34 in March and April, and 36 in May, before rising to 37, 44, 45 and 51 from June to September. The gap between January and the spring months is 43 days (Realtor.com, days on market, 2026; Realtor.com, active listings, 2026).
Active listings tell the same story. The count was 5,766 in January and 13,078 in September, a rise of 126.8%. That is a steep build, and it means that the autumn buyer faces a longer shelf than the spring buyer did. The winter fall in listings is not a sign of strength, since fewer buyers are shopping as well.
The reading for an owner who might sell in 2027 is that timing within the year can matter as much as the year chosen. A listing in March 2027 meets the fastest part of the cycle. The same listing in December meets the slowest. A seller who decides to wait should wait for spring, not simply for next year.
What is the labor market doing month by month?
The smoothed unemployment rate for the Seattle area was 4.6% in August 2025, 4.8% in September, 5.0% in November and December, and 5.2% in January 2026. It reached 5.4% in February and stayed there through May, before easing to 5.2% in June, 5.1% in July and 4.9% in August. The peak was 0.8 points above the starting point.
The easing since May is a sign that the weakest part of the cycle may have passed, but the rate remains above where it was a year ago. Buyers who work in technology and related industries are sensitive to such a swing, and a buyer who has seen layoffs in the family or the office may hold back from a purchase of this size.
For a seller, the job market shows up as the number of showings and the share of offers that come with contingencies. A buyer who must sell a home first, or who needs a loan approval that depends on a single income, can fall away late in the process. Owners should treat a full-price offer from such a buyer as less certain than the same offer in cash.
What does a low mortgage rate on the seller's side really mean?
Consider a seller with a $600,000 balance at 3.0% on a 30-year schedule. The principal and interest payment is about $2,530 per month. If the same seller sells and borrows $600,000 again at 7.28%, the payment is about $4,105. The difference is about $1,576 per month, or $18,900 per year, and it rises 62% above the old payment. The numbers are hypothetical, using the standard payment formula and ignoring taxes, insurance and the loan term already elapsed.
This is the lock-in effect in plain figures. A seller with a low rate is not only selling a house but also giving up a financing arrangement that buyers cannot get today. It explains why new listings are down 7.4% in the year, and why many owners would rather wait. It also explains the other side of the market: a buyer facing a payment of that size has less room to pay a high price for the house.
Owners who must move, because of a job, a family change or an estate, do not get to choose. For them the useful question is how to sell at the lowest cost and in the shortest time. Owners who do not have to move can compare the annual cost of the rate difference with the benefit of selling now.
How does the age mix of Kirkland affect a seller?
In this part of Kirkland, 4,852 units (26.3%) date from the 1960s and 1970s, 5,773 (31.3%) from the 1980s and 1990s, and 5,958 (32.3%) from the 2000s onward. A further 1,865 units (10.1%) predate 1960. A seller therefore competes with homes of every age, and the buyers who tour a 1970s house will also tour new construction in the same price band.
At these prices, the gap between a house in good condition and one needing work is large in dollars, even if it is modest in percentage terms. A 5% difference on the median value of $1,491,700 is $74,585. The margin of error on the Census estimate, plus or minus $92,501, is larger than that. An owner should read the value estimate as a wide band and obtain at least two independent opinions of value before setting an asking price.
What would the next twelve months have to deliver for a 2027 sale to win?
Start with the price. On a $1,491,700 home, each 1% in price is $14,917. If the last twelve months' 2.4% decline in the metro median list price repeated, a 2027 seller would face a price about $35,800 lower. If prices were flat, the difference would be zero. If they rose by the 0.3% of the price index, it would be about $4,500. Table 2 sets out those cases beside a 5% fall and a 3% rise (Realtor.com, list price, 2026; FHFA, price index, 2026).
The owner must weigh each against a full year of carrying costs, which include property tax, insurance, upkeep and the interest earned elsewhere on the equity. Only the owner knows that total. If it exceeds the gain in the best case, the wait cannot pay on price alone. If it is smaller than the loss in the worst case, the wait carries real risk. Readers comparing markets can also read the Bellevue brief and the Bellevue brief.
| Scenario for 2027 | Price change | Dollar change |
|---|---|---|
| Fall of 5% | -5.0% | -$74,585 |
| Repeat of the last year in listing prices | -2.4% | -$35,801 |
| Flat | 0.0% | $0 |
| Repeat of the last year in the price index | +0.3% | +$4,475 |
| Rise of 3% | +3.0% | +$44,751 |
What does an owner have to assume for waiting to pay?
Put the measures together. For a 2027 sale to beat a sale this year after allowing for another year of carrying costs, at least one of four things must happen: the mortgage rate falls, the supply of listings shrinks, prices rise faster than they have in the last twelve months, or the local job market improves. None of the four is visible in the data now. All four are possible.
A seller does not need to predict them to decide. An owner who has a low fixed mortgage rate and no need to move can reasonably hold, since the rate itself is an asset that the sale would give up. An owner who has a reason to move, or whose home needs work that a crowded market will penalize, is paying for the wait with time and risk. The data speak to the size of that risk. They do not remove it.
A practical test is to pick a sale date in each scenario and write down the three numbers that matter: the price expected, the carrying cost until then, and the rate the owner would pay on the next home. If the second number is larger than the gain between the first two, the wait loses. In a market where the median listing price per square foot has slipped 2.5%, 42.1% of listings are being cut and the mortgage rate is 0.94 points higher than a year ago, the burden of proof sits with the plan that waits.
Methodology and limitations
Housing and value figures use the American Community Survey 2020-2024 five-year file for the postal-code area that covers part of Kirkland, with published margins of error. Mortgage rates are Freddie Mac's weekly national average and do not reflect any one borrower's rate.
Listing, price-cut, time-on-market and price-per-square-foot series cover the Seattle-Tacoma-Bellevue metropolitan area as defined by Realtor.com. They are asking prices, not sale prices. The price index covers the Seattle-Bellevue-Kent metropolitan division. The payment examples are standard 30-year amortization arithmetic and exclude taxes, insurance and fees. Nothing here forecasts future rates or prices.
Conclusion
Holding a Kirkland home into 2027 is a bet that conditions improve, on measures that have mostly moved the other way in the last year: rates up from 6.34% to 7.28%, listings up 28.5%, unemployment up from 4.6% to 4.9% and prices flat.
That does not make selling now the right choice. It makes the wait a decision with a price, and the price can be written down.
An owner can test the plan with two numbers. The first is the monthly cost of holding the home for another year: taxes, insurance, upkeep and the interest given up on the equity. The second is the drop in sale price that would erase the benefit of waiting. If the wait costs more than the drop an owner expects to avoid, the data do not support it. If the owner has a low fixed rate and a reason to stay, the same data support holding.
Frequently Asked Questions
Does the 7.28% rate apply to a seller?
Not directly. A seller's own mortgage rate is fixed. The rate matters because it sets what buyers can afford to pay.
Why is the margin of error larger for Kirkland?
At $92,501 on a $1,491,700 estimate it is 6.2%, because high-value homes vary more and the survey sample is finite.
Are listing prices the same as sale prices?
No. They are what sellers ask. Sale prices are usually lower where price cuts are common.
Does this predict prices in 2027?
No. It describes where each measure stood in 2026 and what a hold decision has to assume.
Compare your options before committing. Request a written private offer for your property, with no obligation, then weigh it against your listing plan.
Sources
- Freddie Mac, 2026. 30-Year Fixed Rate Mortgage Average in the United States (via FRED). https://fred.stlouisfed.org/series/MORTGAGE30US.
- Realtor.com, 2026. Housing Inventory: Active Listing Count in Seattle-Tacoma-Bellevue, WA (CBSA). https://fred.stlouisfed.org/series/ACTLISCOU42660.
- U.S. Census Bureau, 2026. American Community Survey 2020-2024 five-year estimates, the Kirkland area (via Census Reporter). https://censusreporter.org/profiles/86000US98033-98033/.
- Realtor.com, 2026. Housing Inventory: Price Reduced Count in Seattle-Tacoma-Bellevue, WA (CBSA). https://fred.stlouisfed.org/series/PRIREDCOU42660.
- U.S. Federal Housing Finance Agency, 2026. All-Transactions House Price Index for Seattle-Bellevue-Kent, WA (MSAD). https://fred.stlouisfed.org/series/ATNHPIUS42644Q.
- U.S. Bureau of Labor Statistics, 2026. Unemployment Rate in Seattle-Tacoma-Bellevue, WA (MSA). https://fred.stlouisfed.org/series/SEAT653UR.
- Realtor.com, 2026. Housing Inventory: Median Days on Market in Seattle-Tacoma-Bellevue, WA (CBSA). https://fred.stlouisfed.org/series/MEDDAYONMAR42660.
- Realtor.com, 2026. Housing Inventory: Median Listing Price in Seattle-Tacoma-Bellevue, WA (CBSA). https://fred.stlouisfed.org/series/MEDLISPRI42660.
- Realtor.com, 2026. Housing Inventory: Median Listing Price per Square Feet in Seattle-Tacoma-Bellevue, WA (CBSA). https://fred.stlouisfed.org/series/MEDLISPRIPERSQUFEE42660.
- Realtor.com, 2026. Housing Inventory: New Listing Count in Seattle-Tacoma-Bellevue, WA (CBSA). https://fred.stlouisfed.org/series/NEWLISCOU42660.
Related research

Seller Guide · October 6, 2026
How to Prepare Point Pleasant Beach Rental Records Before Selling
Separate rental approval, income history and booked stays before comparing sale terms.

Seller Guide · October 6, 2026
How to Prepare Rumson Flood and Waterfront Records Before Selling
Separate flood disclosure, elevation, repairs and waterfront rights before comparing sale terms.

Seller Guide · October 6, 2026
How to Prepare Sarasota Condo Inspection and Reserve Records Before Selling
Separate building condition, reserve funding and resale documents before comparing sale terms.