Market Brief · by Aidan Sowa · October 5, 2026
Does a Camelback East Home Sell by Its School Line or Its Street? Reading the Attendance Boundary, the Condo Fees and the Cash Buyer
Reading the Attendance Boundary, the Condo Fees and the Cash Buyer for Camelback East, AZ, with each source dated and its limits noted, for owners weighing a listing against a direct sale.
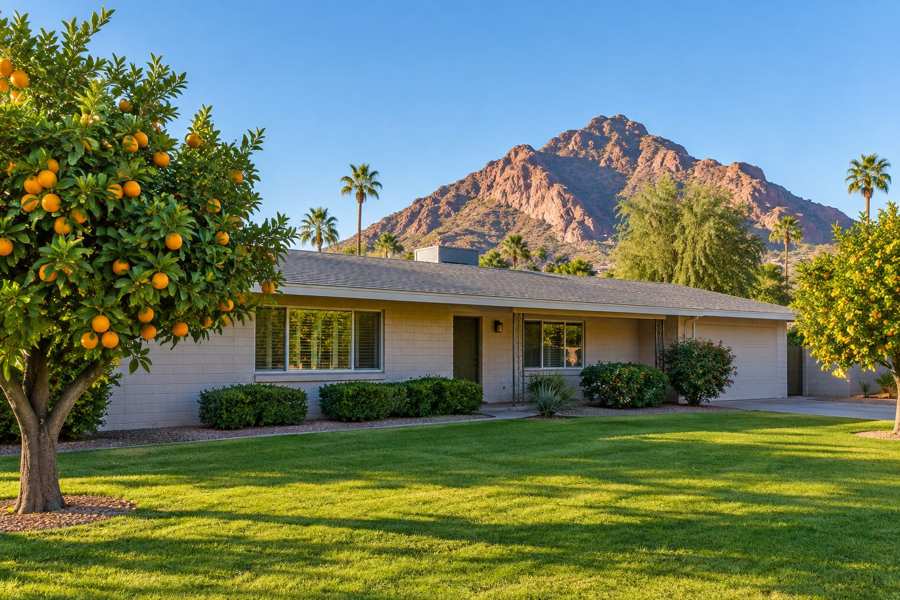
A seller in Camelback East is often told that the house will sell on its street. A local submarket report published in July 2026 says something more specific: it sells on a school attendance line that does not follow the postal boundary, and the line can run through the middle of a block. Miss it by 200 feet, the report warns, and a family's children go to a different high school. For a seller, that means two houses of the same size a few doors apart can be priced as though they sit in different towns.
This brief takes that claim and checks the surrounding record. It reads the tenure mix, income and rent in the Census postal area that includes Camelback East, the submarket report's price tiers, cash buyer share and days on market, a June 2026 Phoenix neighborhood roundup, and the Phoenix metropolitan listing series for inventory, new listings, asking prices and price reductions. It then asks what a private direct sale changes for an owner who does not want a sign in the yard.
The limits are plain. The Census figures describe a wider area than the village, the submarket report is marketing content from a brokerage, and the metropolitan series cover Phoenix, Mesa and Scottsdale together. The brief says where each limit applies and does not estimate what any particular home is worth.
Key Findings
- A local submarket report puts the June 2026 median sale price near $985,000, the average near $1,395,000, days on market at 74 and the sale-to-list ratio at 95.9%, and says cash buyers made up 28% of transactions in the highest tier against 18% citywide (Arizona Homes and Condos Realty, July 2026).
- A June 2026 roundup says Phoenix is not one market and that the neighborhoods of Arcadia and Camelback East command significant premiums over entry-level areas in the mid to upper $300,000 range (Formanek, June 2026).
- In the Census postal area that includes Camelback East, 9,918 of 17,598 occupied homes (56.4%) are owner-occupied and 7,680 (43.6%) are rented, and median household income is $93,885 (U.S. Census Bureau, 2020-2024).
- Phoenix metropolitan active listings stood at 18,437 in September 2026, up 4.1% in a month and down 5.5% from the May level of 19,517 (Realtor.com, active listings).
- The Phoenix metropolitan median listing price fell from $498,000 in May to $475,000 in September, a decline of 4.6% (Realtor.com, median listing price).
What is Camelback East, and why do reports blur it?
Camelback East is one of the villages that the City of Phoenix uses for planning, and the July report describes it as the part of the city that runs roughly from 7th Street east to the Scottsdale boundary at 64th Street, and from Thomas Road north to Northern Avenue. In that report, the village is the home of three distinct markets that share a median: an entry market of older, transitional resale homes, a mid-luxury tier of condominiums and urban infill around the Biltmore, and a luxury tier that includes Arcadia, the area around the Arizona Biltmore and the guard-gated hillside estates.
A median that blends all three says little. The report itself concedes the point, giving price ranges for the tiers of $300,000 to $550,000 for the entry market, $550,000 to $1.2 million for the middle and $1.2 million to more than $10 million for the top. A seller at the bottom of that range and a seller at the top are in different markets, and neither is helped by the village average.
The top of the range is worth stating plainly, because it explains why the average in the report sits so far above the median. The July report says the most expensive Phoenix sale of June 2026 closed at $10,620,025 inside the guard-gated hillside community around the Arizona Biltmore, and that several Arcadia sales were above $3.2 million. A handful of sales at that level lifts an average, which the report puts at about $1,395,000, without moving the median of $985,000 much. A seller whose home is far below the top should treat the average as a statement about other people's houses.
The name also overlaps with its neighbor. Camelback East is where Arcadia sits, and a seller in the village should expect buyers to compare their home with Arcadia sales even when the street is nowhere near them. A separate brief in this series covers the ranch-and-lot economics of Arcadia itself. This one stays on what makes the village different: its mix of condominiums and houses, its school lines and its buyers.
The June roundup makes the same point at a larger scale. It says that Arcadia and Camelback East command significant premiums within Phoenix, while West Phoenix, Maryvale and Alhambra offer median prices in the mid to upper $300,000 range, and that central Phoenix draws buyers who want walkability and the light rail. It treats the city as dozens of markets, and so should a seller.
Source: Arizona Homes and Condos Realty, July 10, 2026; Formanek, June 25, 2026. These are brokerage content and were not independently verified.
Who owns here, and who rents?
The Census postal area that includes Camelback East has 37,297 residents and 17,598 occupied homes. Owners occupy 9,918 of them (56.4%) and renters occupy 7,680 (43.6%). A further 2,006 housing units, 10.2% of the 19,604 total, have no usual resident. That vacancy share is high for a metropolitan area with a tight market, and it fits the description in the July report of snowbirds who spend five months of the year in a condominium and the rest elsewhere.
Median household income is $93,885 and median gross rent is $1,537 a month, or $18,444 a year. A renter at the median pays 19.6% of the median income. Owners put the median value of their homes at $862,000, with a margin of error of $39,318, about 4.6%. That is below the submarket report's $985,000 median sale price, because the Census figure is an owner's estimate across every kind of home in the area, and the report's figure is a closed-sale median.
The split between owners and renters matters to a seller because it shapes the nearest neighbors in a way that a house in the northern estates does not feel and a condominium in the Biltmore corridor does. A rental share above two in five means many buyers in the area are investors or people trying the neighborhood before they buy, which one of the local guides notes for the wider district. A seller who does not want investors walking through the home can price that in.
There is also a timing point in the tenure numbers. A neighborhood in which more than four in ten occupied homes are rented turns over more often than one dominated by owners, and it produces more sales by investors who bought for the income and are ready to sell. That supply competes with a private seller's house in any public search. It is one more reason a seller who wants control of the date may prefer not to list into a crowd.
None of these figures speaks to a single address. They place a house in a pool of buyers and neighbors and let an owner judge whether a quiet sale suits them.
| Indicator | Value | Note |
|---|---|---|
| Population | 37,297 | Whole postal area |
| Housing units | 19,604 | All units |
| Owner-occupied homes | 9,918 | 56.4% of occupied |
| Renter-occupied homes | 7,680 | 43.6% of occupied |
| No usual resident | 2,006 | 10.2% of all units |
| Median household income | $93,885 | Margin of error $7,562 |
| Median gross rent | $1,537 | Monthly |
| Owner-estimated median value | $862,000 | Margin of error $39,318 |
Source: U.S. Census Bureau, American Community Survey 2020-2024 five-year estimates, tables B01003, B19013, B25003, B25064 and B25077.
Why does the school line move the price?
The July report calls the school fact the most important one in the village. It says Scottsdale Unified serves most of the Arcadia side of the postal area and that the district earned an A letter grade from the Arizona Department of Education for fiscal 2025. It names Tavan Elementary and Hopi Elementary at the A level, Ingleside Middle School at B, and Arcadia High School at A, with 89.59 points. It credits this attendance for a premium of roughly $200,000 on addresses inside the line.
It adds that the attendance boundary does not follow the postal boundary and follows individual streets, so the address decides the school. Madison Elementary District, which it grades B, serves most of the Biltmore corridor and the far western edge, with four A-rated campuses and high school attendance in the Phoenix Union system. Creighton, graded C, and Osborn, graded B, serve the southern part of the village. The report gives school grades from a state release dated April 15, 2026.
These are the report's statements. School grades and boundaries change, and a buyer who relies on them will check the district's own address lookup. The point for a seller is simpler. If a home sits on the favorable side of the line, buyers with children will pay for it, and the report says so in dollars. If it sits on the other side, a seller should not expect the same comparison to hold, and a buyer who learns of the line late may ask for a lower price.
A private sale does not remove the school line, but it changes who asks about it. A listed home draws every buyer with a child, each of whom runs the address through the district tool during the first showing. A direct buyer who purchases homes off the market is pricing the house, not a school, so the line matters less to the offer.
Source: Arizona Homes and Condos Realty, July 10, 2026, which cites the Arizona Department of Education fiscal 2025 letter grades; grades and boundaries were not re-checked here.
How big is the cash buyer, and what does cash cost the seller?
The same report says cash buyers made up about 28% of transactions in the highest-priced tier, against 18% for the city as a whole, and that sale-to-list in June averaged 95.9%, down from 96.1% in May. It says that luxury homes above $2 million in Arcadia regularly sell 6% to 10% under original list after one or two price adjustments, and that cash offers extract a discount of 4% to 6% compared with financed offers at the closing table.
Read together, those claims describe a market where a seller who lists high can expect to cut, and where the cash buyer is common enough to be a standard party to the deal. The roundup from June agrees on the direction at a metropolitan level: it says overpriced listings are sitting and correctly priced homes are still moving. Both are statements by brokers, and neither is a measurement of any one listing.
For a seller, the cash discount is the number to hold up against a private offer. A financed buyer needs an appraisal, a lender's timeline and often an inspection with repair requests. A cash buyer skips the lender but, according to the report, still asks for a discount. A private direct buyer who purchases without inspections or repairs and closes on the seller's date is making a different trade. The seller gives up the chance of a competing bid. In return the seller keeps the sale private, picks the closing date and pays no commission or closing costs.
The comparison should be made in net dollars. An owner can take a public offer, subtract commission and closing costs at whatever rates apply, subtract repairs the buyer will request, and compare the result to the private offer. For every 1% of the price that would go to fees, a sale at $985,000 keeps $9,850. That is arithmetic, not a forecast.
Source: Arizona Homes and Condos Realty, July 10, 2026; Formanek, June 25, 2026. Figures are brokerage statements and were not independently verified. Calculation uses stated price only.
What happened to Phoenix inventory and prices after June?
The July report is built on closed sales through June. The Phoenix metropolitan series show the months since. Active listings fell from 19,517 in May to 18,731 in June and 17,661 in July, then rose to 17,707 in August and 18,437 in September. A rise of 730 listings in a single month, 4.1%, is the sort of change a seller notices only when more competing houses appear in a search.
New listings declined steadily, from 8,670 in March and 8,146 in April to 7,444 in May, 6,868 in June and 5,854 in July (Realtor.com, new listings). That is a fall of 32.5% from March to July, though part of it is the usual summer slowdown. The count of listings with a price reduction fell from 10,902 in March to 8,348 in July (Realtor.com, price reduced listings), a drop of 23.4% that again tracks the fall in listings.
Asking prices eased. The metropolitan median listing price was $498,000 in May, $489,500 in June, $481,945 in July and $475,000 in August and September. Days on market rose from 60 in May to 67 in July and August before easing to 62 in September.
These series describe the whole metropolitan market, in which the median list price is roughly half the submarket report's median sale price. They cannot describe a Camelback East house. They do suggest that the market a seller entered in spring has changed: more inventory in the fall, softer asking prices and a clock that has run slower than it did in May.
Source: Realtor.com via FRED, Housing Inventory: Active Listing Count, New Listing Count, Median Listing Price, Median Days on Market and Price Reduced Count, Phoenix-Mesa-Scottsdale, AZ (CBSA).
What does a condominium seller face that a house seller does not?
The July report singles out the condominium owner who pays $850 a month in association fees on a Biltmore unit and lives in Phoenix five months a year. It asks whether owning is still worth it and says a specialist would run the carrying-cost analysis, including fees, insurance, property tax and the cost of trapped equity. That question is one an owner can ask without anyone's help, and the answer is arithmetic. At $850 a month, fees come to $10,200 a year.
The August guide cited for Arcadia reports that attached homes in the wider postal area had close to seven months of supply in spring, with days on market above 100 and a median sold price near $382,000, down about 8.6% from a year earlier. It is a spring figure and from a different brokerage, and its numbers should be read as one report's view. They do illustrate the point that condominiums and houses in the same postal area are two different markets.
A condominium owner has additional constraints. The building may have its own approval process for buyers, special assessments may be pending, and a lender may refuse a loan in a building with low reserves. Each of these can delay or kill a public sale. A direct buyer who pays cash does not depend on the lender's view of the building, which is one of the reasons owners of units in older buildings look at private offers.
A house in the village sits at the other end. It has no association, a single title and a lot that holds value on its own. The differences between the two kinds of seller are exactly why the median blends them badly, and why this brief does not offer one number for Camelback East. Readers comparing markets can also read the Arcadia brief and the Paradise Valley brief.
Source: Arizona Homes and Condos Realty, July 10, 2026; Peggy Young, August 6, 2026. Brokerage statements, not independently verified.
What does a private sale change in the village?
A direct sale to a buyer who purchases homes off the market changes five things. There are no showings and no neighbors talking about you selling, which is the privacy benefit. The closing date can be flexible, giving time to find a new home. There are no commission costs and no closing costs for the seller. And there are no inspections or repairs, which matters for a ranch from the 1960s, a condominium with deferred maintenance or a house the owner would rather not touch before leaving.
The tradeoff is the same one every private sale carries. A public listing can attract competing offers, and a private sale draws one. In a village where the report says the best addresses attract cash buyers and sell near list, a seller with a favorable school line and a clean house might do well on the open market. A seller with a dated house on the other side of the line, an estate to settle or a reason to avoid publicity might prefer a quiet sale at a firm price.
The choice is the owner's, and the figures above are there to make it concrete. Take the net from a public listing, compare it with a private offer, and decide how much the privacy, the date and the absence of repairs are worth.
Source: calculation from stated sale prices; no commission rate or closing cost is assumed.
Methodology and limitations
Tenure, income, rent, population and owner-estimated value come from the American Community Survey 2020-2024 five-year estimates, tabulated for the postal-code area that includes Camelback East. The area is wider than the village and includes Arcadia and parts of the Biltmore corridor, so the figures describe the area and not the village alone. Shares are calculated from published counts. Owner-estimated value and income carry stated margins of error.
Active listings, new listings, median listing price, days on market and price reduced counts are Realtor.com series published through the Federal Reserve Bank of St. Louis for the Phoenix-Mesa-Scottsdale metropolitan area. The new-listing and price-reduced series end in July 2026 and the others in September 2026. Listing prices are asking prices and not sale prices.
The submarket report and the June roundup are brokerage marketing content. Their price tiers, school grades, cash share and discount figures were not independently verified. The brief makes no forecast and does not estimate what any particular home would sell for.
Conclusion
For an owner in Camelback East, the public record supports a short list of conclusions. The village is three markets under one name, about 44% of occupied homes in the surrounding area are rented, one report ties a premium of roughly $200,000 to a school line that follows streets, cash buyers are common in the top tier, and the Phoenix market has become more crowded and softer since spring.
It does not support a price for any one house, and it does not support a forecast. The choice between a public listing and a private sale comes down to how much an owner values a possible higher price against privacy, a flexible closing date, no commission, no closing costs and no inspections or repairs.
Frequently Asked Questions
Why is the Census value lower than the report's median sale price?
The Census figure is what owners say their homes are worth across every home in a wider area. The report's figure is a median of closed sales in the submarket, which skews toward the higher tier.
Does the school line really move the price?
One brokerage report says so and puts a number on it, roughly $200,000. The claim was not independently verified, and school boundaries and grades can change.
Do the Phoenix listing series describe Camelback East?
Not directly. They cover the whole metropolitan area, so they show the direction of the wider market and not the price of a house in the village.
Is a condominium easier to sell privately than a house?
It can be, because a cash buyer does not depend on a lender's view of the building. The owner still has to weigh the lower chance of competing bids.
Does a private sale always beat a public listing?
No. A public listing can attract competing bids and sometimes a higher price. A private sale offers privacy, a flexible closing date, no commission, no closing costs and no inspections or repairs, in exchange for a single offer.
Compare your options before committing. Request a written private offer for your property, with no obligation, then weigh it against your listing plan.
Sources
- Arizona Homes and Condos Realty, 2026. East Phoenix Real Estate Market Report, July 2026. https://arizonahomesandcondos.com/phoenix-arizona-real-estate/east-phoenix-real-estate/.
- Trisha Formanek, 2026. Phoenix Is Not One Market. Here Is How the Valley's Neighborhoods Are Actually Performing in 2026. https://trishaformanek.com/phoenix-is-not-one-market-here-is-how-the-valleys-neighborhoods-are-actually-performing-in-2026/.
- U.S. Census Bureau, 2026. American Community Survey 2020-2024 five-year estimates, the Camelback East area (via Census Reporter). https://censusreporter.org/profiles/86000US85018-85018/.
- Realtor.com, 2026. Housing Inventory: Active Listing Count in Phoenix-Mesa-Scottsdale, AZ (CBSA). https://fred.stlouisfed.org/series/ACTLISCOU38060.
- Realtor.com, 2026. Housing Inventory: Median Listing Price in Phoenix-Mesa-Scottsdale, AZ (CBSA). https://fred.stlouisfed.org/series/MEDLISPRI38060.
- Realtor.com, 2026. Housing Inventory: New Listing Count in Phoenix-Mesa-Scottsdale, AZ (CBSA). https://fred.stlouisfed.org/series/NEWLISCOU38060.
- Realtor.com, 2026. Housing Inventory: Price Reduced Count in Phoenix-Mesa-Scottsdale, AZ (CBSA). https://fred.stlouisfed.org/series/PRIREDCOU38060.
Related research

Seller Guide · October 6, 2026
How to Prepare Point Pleasant Beach Rental Records Before Selling
Separate rental approval, income history and booked stays before comparing sale terms.

Seller Guide · October 6, 2026
How to Prepare Rumson Flood and Waterfront Records Before Selling
Separate flood disclosure, elevation, repairs and waterfront rights before comparing sale terms.

Seller Guide · October 6, 2026
How to Prepare Sarasota Condo Inspection and Reserve Records Before Selling
Separate building condition, reserve funding and resale documents before comparing sale terms.