Market Brief · by Aidan Sowa · October 5, 2026
Is an Arcadia Ranch Worth More as a House or as a Lot? Reading the Citrus, the Irrigation Gate and the Teardown Offer
Reading the Citrus, the Irrigation Gate and the Teardown Offer for Arcadia, AZ, with each source dated and its limits noted, for owners weighing a listing against a direct sale.
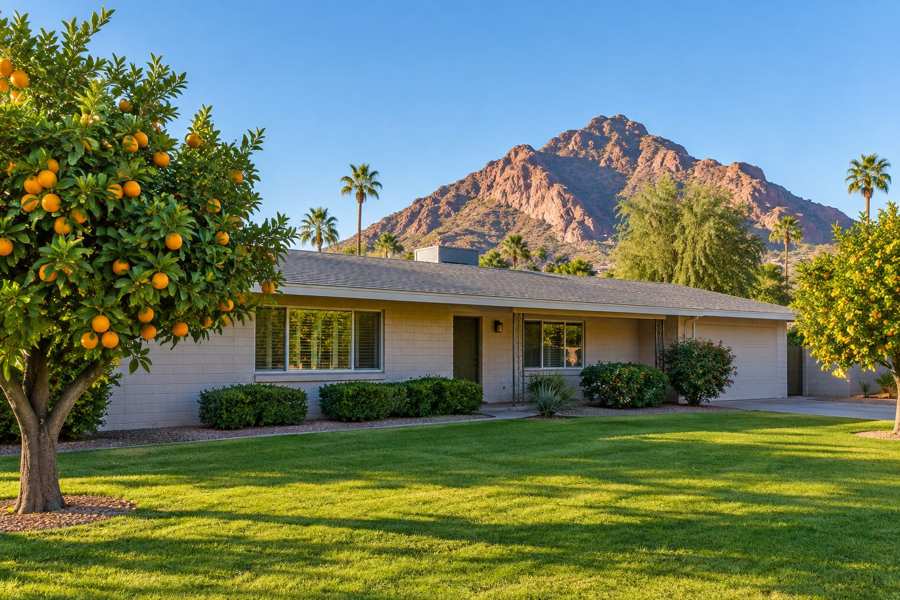
A seller in Arcadia is holding two assets at once and rarely sees them priced separately. One is a house, often a single-story ranch from the 1950s with block walls, a low roof and a covered patio. The other is a parcel of Phoenix land, often large, often irrigated, often shaded by citrus, at the foot of Camelback Mountain. In most neighborhoods the house carries the value. In parts of Arcadia, buyers bid mainly for the land and treat the house as something to remove.
This brief takes that split and checks it against public figures and local brokerage commentary. It reads the Census age profile of the postal area that includes Arcadia, three 2026 local guides that disagree on where Arcadia starts and stops, and the Phoenix metropolitan listing series for days on market, inventory, asking prices and price reductions. It then asks what a private direct sale changes for an owner who does not want strangers walking through the house, or a listing that tells the street.
The limits are plain. The Census figures describe a wider area than the neighborhood, the brokerage numbers are marketing content, and the metropolitan series cover Phoenix, Mesa and Scottsdale together. The brief says where each limit applies and does not estimate what any particular house is worth.
Key Findings
- One local guide puts the Arcadia Proper median near $1.35 million and Arcadia Lite near $850,000, with scraper lots in the most sought-after pocket trading at $950,000 to $1.1 million (Moxley Collective, 2026 Arcadia guide).
- Another brokerage argues that Arcadia is a family of sub-areas under one brand and that the MLS neighborhood field is free text, so two data sources pulling Arcadia comparables often look at different geography (Peggy Young, August 2026).
- In the Census postal area that includes Arcadia, 5,502 of 19,604 homes (28.1%) were built in the 1950s, and owners estimate their homes at a median of $862,000 (U.S. Census Bureau, 2020-2024).
- The Phoenix metropolitan median listing price slid from $498,000 in May 2026 to $475,000 in September, a decline of 4.6% (Realtor.com, median listing price).
- The Phoenix metropolitan median days on market was 60 in May and 62 in September, after peaking at 67 in July and August (Realtor.com, days on market).
What does the age of the housing stock say about the lots?
The Census counts 19,604 housing units in the postal area that includes Arcadia. Of those, 5,502 were built in the 1950s and 3,809 in the 1960s. Together with 2,977 built in the 1970s, three decades account for 12,288 homes, 62.7% of the total. Adding the 347 homes built before 1950 brings the share built before 1980 to 64.4%. The median year built is 1970.
That is an older stock than most of Phoenix, and it fits the description every local guide gives of the neighborhood: single-story ranches of the postwar boom, with block walls, low-pitched roofs, covered patios and galley kitchens. One guide lists the typical mid-century ranch at 1,200 to 2,200 square feet, which is modest next to the lots they stand on. The guide adds that many have kept original terrazzo or tile floors and a few have kept period fixtures.
Newer homes are a real minority and a telling one. The postal area has 2,031 homes built in the 2010s, 10.4% of the total, and 542 built since 2020. Those 2,573 homes are mostly the work of the rebuild economy that the guides describe, in which an older ranch is bought for its land, taken down and replaced by a custom house of 3,500 to 5,500 square feet. The 2010s rank fourth among decades, behind only the 1950s, 1960s and 1970s, which says that rebuilding has been steady for a long time and has not just started.
For an owner, the age profile means two things. A ranch from 1958 is probably sound but dated, and its systems may be original or replaced in pieces. And the buyers most likely to value it are the ones who see the lot first. A seller does not need to guess which kind of buyer will call. A private sale conversation can settle that quickly, because a buyer who wants the land says so.
| Decade built | Homes | Share of total |
|---|---|---|
| 1939 or earlier | 123 | 0.6% |
| 1940s | 224 | 1.1% |
| 1950s | 5,502 | 28.1% |
| 1960s | 3,809 | 19.4% |
| 1970s | 2,977 | 15.2% |
| 1980s | 1,923 | 9.8% |
| 1990s | 1,208 | 6.2% |
| 2000s | 1,265 | 6.5% |
| 2010s | 2,031 | 10.4% |
| 2020 or later | 542 | 2.8% |
Source: U.S. Census Bureau, American Community Survey 2020-2024 five-year estimates, table B25034. Shares are calculated from the published counts and may not sum to 100% because of rounding.
Who lives here, and who owns?
The postal area has 37,297 residents and 17,598 occupied homes. Of the occupied homes, 9,918 (56.4%) are occupied by their owners and 7,680 (43.6%) are rented. Another 2,006 units, 10.2% of all units, have no usual resident, which is a higher vacancy share than in most of the markets in this series and is consistent with second homes, seasonal use and homes in the middle of a sale or a rebuild.
Median household income is $93,885 and median gross rent is $1,537 a month. A renter paying the median spends $18,444 a year, 19.6% of the median income. Owners estimate the median home at $862,000, with a margin of error of $39,318, or 4.6%. That estimate describes the whole postal area, including condominiums and smaller homes toward the south and west, so it sits well below the figures that guides quote for the detached core.
The gap is the point. A median household income of $93,885 does not buy a house at $862,000, still less one at $1.35 million, and the area's income figure includes many renters in apartments along its busy corridors. Buyers at the Arcadia core price are mostly people moving in with equity from somewhere else, relocating professionals, or owners who have sold a larger asset. That helps explain why one guide describes the buyer pool as heavy on cash and on people who plan to build.
A seller should read this as a statement about depth. The pool of buyers who can pay the core price is not the pool of people who live in the postal area. It is regional and national, and some of it is not looking at the public listing sites at all, because the person who wants an Arcadia lot often asks around before a house is listed.
Source: U.S. Census Bureau, American Community Survey 2020-2024 five-year estimates, tables B01003, B19013, B25003, B25064 and B25077.
Where does Arcadia start and stop?
The most useful fact in the 2026 guides is that they disagree. One treats the traditional core as the stretch between Camelback Road and Indian School Road, from 44th Street to 64th Street, and separates it from a lighter side south of Indian School Road and west of 56th Street. It adds an estate district north of Camelback Road toward the mountain, with lots that it says can reach 30,000 to 80,000 square feet, and an eastern stretch across the line in Scottsdale.
A second guide, from a Scottsdale brokerage in May 2026, describes the historic estate core as the land north of the Arizona Canal and south of Camelback Mountain, between 44th Street and Scottsdale Road. It says the original 1919 plat laid out lots of roughly five to ten acres with a minimum house cost of $5,000. It then notes that the City of Phoenix keeps parcel-based neighborhood records that include both an Arcadia Lite Neighborhood Association and an Arcadia Lite Block Watch, so the lighter side is a recognized local identity even though it is not an official district (Smith, Arcadia Proper versus Arcadia Lite).
The third guide, from August 2026, goes furthest. It says the neighborhood label is unregulated, that the MLS subdivision field is free text, and that listings well outside any accepted line routinely borrow the name. Two sources pulling Arcadia comparables are therefore often reading different geographies without knowing it. A portal tile for the lighter side, it says, showed a median near $1.4 million on only 37 sales, which is a long way from the $850,000 another guide gives for the same label. The numbers are not wrong in an arithmetic sense. They describe different sets of houses.
For a seller, the practical lesson is to ask which set of houses a number describes. A buyer who quotes a median from the wrong side of Indian School Road is quoting a number about someone else's house. A private buyer who has worked the specific blocks will usually know the difference, and an owner can ask how the offer was built.
Source: three 2026 local brokerage guides on Arcadia boundaries and prices. Brokerage guides are marketing content and the figures were not independently verified.
What do the guides say a lot is worth?
The Moxley guide gives the clearest numbers on land. It reports a 2026 median of about $1.35 million for the Arcadia core, at $550 to $750 a square foot on typical lots of 10,000 to 22,000 square feet, and about $850,000 for the lighter side at $420 to $580 a square foot on lots of 6,000 to 10,000 square feet. For the estate pocket north of Camelback Road it gives a median above $2.8 million. For the eastern stretch in Scottsdale it gives $1.18 million, and for the western edge near the Biltmore it gives $920,000.
On the rebuild economy, the same guide says that in the most coveted pocket, between 56th and 60th Streets and between Indian School Road and Camelback Road, scraper lots have traded at $950,000 to $1.1 million, while finished custom homes regularly reach $3.5 million to $5 million. The spread between the land price and the finished price is the margin that pays for construction, and the guide itself says the spread can be tight in a normal market.
The August guide adds a split that matters more than any single median. It reports that the Redfin read on the core in March 2026 put the detached median sale near $1.5 million, with about 75 days on market and 83 closings, while attached homes in the same postal area had about 93 active listings, close to seven months of supply, over 100 days on market and a median sold price near $382,000, down about 8.6% year over year. It also says that a single median across both products is the average of a supply-constrained luxury market and an oversupplied one.
These numbers are not a price for your house. They show how far apart two kinds of property can sit under one label, and that a house on a large irrigated parcel is usually valued by a different method than a condominium a mile away. If an offer is built as a land price plus a small allowance for the structure, an owner can ask whether the land comparables are the right ones. If it is built as a house price, ask which houses.
Source: Moxley Collective 2026 Arcadia guide; Peggy Young August 2026 Arcadia article, which cites Redfin, Altos and Realtor.com figures compiled by local brokers. These figures were not re-pulled from the original sources.
What is the irrigation gate worth, and what does it cost?
Many Arcadia parcels were built with a flood-irrigation turnout supplied by the Salt River Project. The August guide says the project moves roughly 800,000 acre-feet a year through 131 miles of canals and 1,000 miles of laterals, and that a ditch rider opens the delivery gate to a block on a schedule the owners do not set. What happens between the gate and the grass is the neighbors' responsibility. Berms, private laterals, backflow devices and shared valves belong to the owner or to a group of owners.
The Moxley guide frames the same feature as a benefit. Lots with active irrigation rights can water citrus and landscaping with surface water at a much lower cost than municipal water, which it calls a meaningful ongoing saving on a large lot. Both guides agree on the other half of the story: a turnout may be active, dormant or decommissioned, the answer is account-specific, and a buyer who underwrites it at zero will learn the cost later.
For a seller, the irrigation question is a diligence item that buyers raise late. A listed house invites it as a negotiating point during an inspection period. A private buyer who has priced the lot as land is less likely to be surprised and less likely to ask for a credit after the fact. It is still wise to know the facts: whether the turnout is live, whether the account is current, where the easements and berms run, and whether any shared-maintenance agreement is recorded.
The August guide offers a short list of questions that sellers can answer in advance. Which recorded sub-area does the parcel sit in? Does it carry a live turnout with a current account? Are the easements and shared agreements documented in a form a lender and a title company will accept? An owner who can answer all three has already removed three common reasons for a price to move late.
Source: Peggy Young, August 6, 2026; Moxley Collective, 2026 Arcadia guide. Irrigation details are the guides' statements and were not checked against project or city records.
Has the Phoenix clock moved this year?
The Arcadia numbers in the guides come from spring and early summer. The Phoenix metropolitan series from Realtor.com show what has happened since, and they cover every kind of property from condominiums to estates. The median days on market was 60 in May 2026, 64 in June, 67 in July and August, and 62 in September. The September figure is 7.5% below the summer peak but 3.3% above May.
Inventory followed a pattern that favors neither side. Active listings across the metropolitan area fell from 19,517 in May to 17,661 in July, then rose to 17,707 in August and 18,437 in September, an increase of 4.1% in a single month (Realtor.com, active listings). New listings fell every month from 8,670 in March to 5,854 in July, a decline of 32.5% in four months (Realtor.com, new listings). The series ends in July in the data used.
Asking prices and price cuts told a related story. The median listing price slid from $498,000 in May to $489,500 in June, $481,945 in July and $475,000 in August and September. The number of listings with a reduced price fell from 10,902 in March to 8,348 in July (Realtor.com, price reduced listings), a drop of 23.4%, though the fall mirrors the fall in listings overall and says little about the share of listings that were cut.
These are metropolitan figures. A house in the Arcadia core is priced against a different buyer pool from the metro median, and the guides report much faster sales there, with one citing 18 days on market and another 75 for detached homes in March. The point for a seller is that every source agrees on direction in the metropolitan market: it has been slower and softer than the spring. Readers comparing markets can also read the Tucson brief and the Camelback East brief.
Source: Realtor.com via FRED, Housing Inventory: Median Days on Market, Active Listing Count, New Listing Count, Median Listing Price and Price Reduced Count, Phoenix-Mesa-Scottsdale, AZ (CBSA).
What does a private sale change on a large lot?
A public listing of an Arcadia ranch announces the address, the lot size and the asking price to the street, to the builders who watch the area and to the neighbors who will see the sign, the photographers and the visitors. A seller may be comfortable with that. A seller who is moving for a private reason, or who would rather not have the block know the house is available, may not be.
A direct sale to a buyer who purchases homes off the market changes the transaction in five ways, all of which are the seller's choice to weigh. There are no showings and no neighbors talking about you selling, which is the privacy benefit. The closing date can be flexible, which gives time to find a new home. There is no commission cost and no closing cost to the seller. And there are no inspections or repairs, which matters on a ranch with original plumbing, a roof of unknown age or a tired pool.
The arithmetic of the fee benefit is simple and does not need an assumed rate. For every 1% of a sale price that would otherwise go to fees, a sale at $850,000 keeps $8,500, a sale at $1,350,000 keeps $13,500, and a sale at $2,800,000 keeps $28,000. An owner can set whatever percentage applies to them against a private offer and compare the two on net proceeds, not on the headline figure.
The tradeoff is just as plain. A public listing can draw several bids, and a private sale draws one. In a place where lots are scarce and builders compete, that might produce a higher price in a listing. In a place where the owner values privacy, a settled date and freedom from repairs, the private offer may be worth more in the ways that count. The decision belongs to the owner, and the numbers above are there to make it concrete.
Source: calculation from stated sale prices; no commission rate or closing cost is assumed.
Methodology and limitations
Housing age, tenure, income, rent, population and owner-estimated value come from the American Community Survey 2020-2024 five-year estimates, tabulated for the postal-code area that includes Arcadia. The area is wider than the neighborhood and includes parts of the Biltmore corridor and neighboring districts, so the figures describe the area and not Arcadia alone. Shares are calculated from published counts. Owner-estimated value carries a stated margin of error.
Days on market, active listings, new listings, median listing price and price reduced counts are Realtor.com series published through the Federal Reserve Bank of St. Louis for the Phoenix-Mesa-Scottsdale metropolitan area. The new-listing and price-reduced series end in July 2026 and the others in September 2026. Listing prices are asking prices and not sale prices.
Sub-area boundaries, medians, price per square foot, lot sizes, irrigation details and sale ranges are quoted from three 2026 local brokerage guides, which are marketing content by firms that earn fees from sales and were not independently verified. The report makes no forecast and does not estimate what any particular home would sell for.
Conclusion
For an owner in Arcadia, the public record supports a short list of conclusions. The housing stock is old and mostly single-story, a steady rebuild trade has replaced a share of it, the sub-area labels are loose enough that two medians can describe different houses, the irrigation question is real and worth answering in advance, and the Phoenix market has been slower and softer since spring.
It does not support a price for any one house, and it does not support a forecast. The choice between a public listing and a private sale comes down to how much an owner values a possible higher price against privacy, a flexible closing date, no commission, no closing costs and no inspections or repairs.
Frequently Asked Questions
Why do the guides give such different Arcadia medians?
They draw the boundary in different places and mix different products. One includes only detached homes in the core, another includes the lighter side and a third notes that the label itself is unregulated.
Is flood irrigation always a plus for value?
Not automatically. It can lower watering costs and support mature trees, but a turnout may be inactive, and berms and shared laterals are the owner's responsibility.
Do the Phoenix listing series describe Arcadia?
Not directly. They cover the whole metropolitan area, so they show the direction of the wider market and not the price of a house in the core.
Does a teardown buyer pay less for a house that is in good shape?
The guides describe some buyers who value only the land. Whether a good house earns a premium over land value depends on who is buying, which a seller can learn by asking how an offer was built.
Does a private sale always beat a public listing?
No. A public listing can attract competing bids and sometimes a higher price. A private sale offers privacy, a flexible closing date, no commission, no closing costs and no inspections or repairs, in exchange for a single offer.
Compare your options before committing. Request a written private offer for your property, with no obligation, then weigh it against your listing plan.
Sources
- Moxley Collective, 2026. Arcadia Phoenix Real Estate Guide 2026. https://moxleycollective.com/blog/arcadia-phoenix-real-estate-guide-2026.
- Peggy Young, 2026. Arcadia vs Arcadia Lite Phoenix: What Buyers Get in 2026. https://peggyyoung.com/blog/arcadias-two-price-tiers-what-the-median-actually-buys-in-proper-vs-lite-in-2026.
- U.S. Census Bureau, 2026. American Community Survey 2020-2024 five-year estimates, the Arcadia area (via Census Reporter). https://censusreporter.org/profiles/86000US85018-85018/.
- Realtor.com, 2026. Housing Inventory: Median Listing Price in Phoenix-Mesa-Scottsdale, AZ (CBSA). https://fred.stlouisfed.org/series/MEDLISPRI38060.
- Realtor.com, 2026. Housing Inventory: Median Days on Market in Phoenix-Mesa-Scottsdale, AZ (CBSA). https://fred.stlouisfed.org/series/MEDDAYONMAR38060.
- Smith Phoenix Real Estate, 2026. Arcadia Proper vs Arcadia Lite: Find Your Phoenix Fit. https://smithphx.com/blog/arcadia-proper-or-arcadia-lite-finding-your-best-fit.
- Realtor.com, 2026. Housing Inventory: Active Listing Count in Phoenix-Mesa-Scottsdale, AZ (CBSA). https://fred.stlouisfed.org/series/ACTLISCOU38060.
- Realtor.com, 2026. Housing Inventory: New Listing Count in Phoenix-Mesa-Scottsdale, AZ (CBSA). https://fred.stlouisfed.org/series/NEWLISCOU38060.
- Realtor.com, 2026. Housing Inventory: Price Reduced Count in Phoenix-Mesa-Scottsdale, AZ (CBSA). https://fred.stlouisfed.org/series/PRIREDCOU38060.
Related research

Seller Guide · October 6, 2026
How to Prepare Point Pleasant Beach Rental Records Before Selling
Separate rental approval, income history and booked stays before comparing sale terms.

Seller Guide · October 6, 2026
How to Prepare Rumson Flood and Waterfront Records Before Selling
Separate flood disclosure, elevation, repairs and waterfront rights before comparing sale terms.

Seller Guide · October 6, 2026
How to Prepare Sarasota Condo Inspection and Reserve Records Before Selling
Separate building condition, reserve funding and resale documents before comparing sale terms.