Market Brief · by Aidan Sowa · October 5, 2026
Why Does Redfin Count More Queen Creek Sales Than a Regional MLS Table? Reading the Median, the Clock and a Suburb Built After the Boom
Reading the Median, the Clock and a Suburb Built After the Boom for Queen Creek, AZ, with each source dated and its limits noted, for owners weighing a listing against a direct sale.
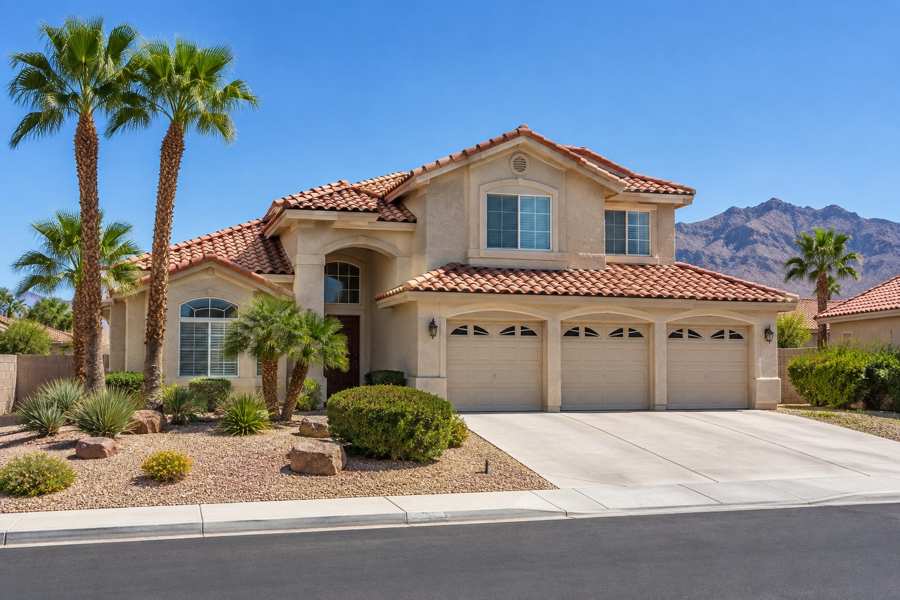
Why does Redfin count 460 June sales in Queen Creek while a regional MLS table counts 132? Redfin's page for the three months to June 2026 says 460 homes sold in June, down from 463 a year earlier. A monthly report built on the regional multiple listing service shows 132 sold in June, in a table that covers single-family homes, patio homes and townhomes under $1,000,000 and over 1,000 square feet. The ratio is 3.5 to one. A data site that tracked 736 closings in six months averages about 123 a month, close to the MLS table and far from Redfin's figure.
The clocks disagree too. Redfin gives 71 days on market, up from 64. The MLS report gives 110 days for August and says it is the longest in over a decade. The data site gives a median of 48 days from listing to a contract, and Zillow says homes go pending in around 50 days. Prices are closer, from a Redfin median of $614,000, down 1.7%, to a median of $637,500 from the data site and an MLS-table average of $648,840. This brief sets the figures side by side and adds the Census, which describes one of the youngest housing stocks in this series.
Maison Off-Market speaks only to sellers. The last section sets out what a private sale changes in a market where the pages put the time to sell at anywhere from 48 to 110 days.
Key Findings
- Redfin showed a Queen Creek median sale price of $614,000 for the three months to June 2026, down 1.7%, a median price per square foot of $255, up 0.4%, 460 homes sold in June against 463 a year earlier, and an average of 71 days on market against 64 (Redfin, Queen Creek housing market).
- A monthly report built on the regional MLS showed 105 sales in August 2026 at an average price of $648,840, 110 days on market for sold homes, 4.0 months of inventory, $253 per square foot, and sellers receiving an average of $11,187 less than asking, with homes under $1,000,000 and over 1,000 square feet in scope (Local brokerage blog, Queen Creek market report).
- A data site tracked 736 closings in six months with a median of $637,500, a middle half of sales between $522,595 and $805,000, a median of 48 days from listing to a contract and 29 days from contract to closing (Resideline, Queen Creek housing market).
- Zillow showed an average Queen Creek home value of $630,977, down 0.1% over the year, with homes going pending in around 50 days, as of July 31, 2026 (Zillow, Queen Creek home values).
- The Census postal area that includes Queen Creek has 29,983 housing units, 88.5% of them built in 2000 or later, a median year built of 2010, 88.2% of occupied homes owned and a median owner-occupied value of $593,500, which is 93.1% of the data site's $637,500 median, a ratio this brief computes.
Why do the sales counts differ so much?
The first thing to check is what each page counts. Redfin's count of 460 sold in June covers the page's all home types filter and does not say which streets the city boundary includes. The MLS report counts single-family homes, patio homes and townhomes, drops condominiums, and keeps only sales under $1,000,000 and over 1,000 square feet. Its June figure is 132. If the filters alone explain the gap, they remove 328 of 460 sales, which is 71.3%, a figure this brief computes. That is a large share to lose to a price cap and a size floor in a city whose Census median value is $593,500, so another cause is likely, and the page does not say which.
The data site gives a third count. It tracked 736 closings in the last six months to October 3, which is 122.7 a month, a figure this brief computes. The MLS table's comparable run is the five months from April to August, with 138, 154, 132, 107 and 105 sales, which average 127 a month, a figure this brief computes. The twelve months from September 2025 to August 2026 add to 1,439 sales, an average of 119.9 a month, which sits close to the data site. Redfin's 460 in one month is 3.8 times that average. The Redfin page's own comparison, 463 a year earlier, shows the same scale, so the page is consistently counting something larger than the MLS table or the data site.
The likeliest reading is that Redfin's city count includes a wider area or more property types than the others, an inference from the arithmetic that none of the pages confirms. The practical point for a seller is that a figure of 460 sales a month would mean a deep, busy market, and a figure of about 120 would mean a smaller one. The 4.0 months of inventory in the MLS report is computed on its own sales, and 418 homes for sale against 105 sales is 3.98 months. On Redfin's count the same inventory would clear much faster. A seller should ask which count a pricing opinion rests on.
| Source | Count | Scope |
|---|---|---|
| Redfin | 460 | Homes sold in June, all home types, up or down 3 from 463 a year earlier |
| Regional MLS table | 132 | Sales in June, homes under $1,000,000 and over 1,000 square feet |
| Regional MLS table | 105 | Sales in August, same scope |
| Resideline | 736 | Closings tracked in six months, about 123 a month |
| Regional MLS table | 1,439 | Sales from September 2025 to August 2026, about 120 a month |
Sources as cited. The scopes differ and the counts are not directly comparable. Commercial content; not independently verified. The 1,439 total and the monthly averages are this brief's arithmetic.
What do the prices say?
The medians sit within 4% of each other. Redfin's $614,000 is for three months to June, the data site's $637,500 is for six months to October, and the MLS report's average of $648,840 is for August alone. The data site's median is 3.8% above Redfin's, a figure this brief computes. Zillow's average home value of $630,977 is a modeled value across all homes, and it is down 0.1% on the year, against Redfin's 1.7% fall in the median sale price. Both pages point the same way and both describe a market that is flat or slightly lower on the year.
The MLS table lets a reader check the direction. August 2026's average of $648,840 against August 2025's $654,638 is a fall of 0.9%, a figure this brief computes. The price per square foot was $253 against $259, and the report says the rate is $17 below its peak of $270 in May 2022. A 12-month run of averages in the table moves between $612,995 and $649,520, and the report says plainly that home prices have stagnated for several years. Redfin's $255 per square foot, up 0.4%, and the report's $253 are within a dollar of each other.
The mix of what sold also moves the numbers. The MLS table shows the average home size at 2,564 square feet in August and 2,424 in June, and the price per square foot between $248 and $261 across the twelve months. A month with larger homes shows a higher average price without a rise in value per square foot, which is why the August average of $648,840 sits above June's $629,854 while the rate moved from $260 to $253. A seller who compares a home to an average of this kind should compare the rate and the size, not the headline price. Redfin's page shows the same pattern at the median, a price down 1.7% beside a rate up 0.4%, which points to a small shift in the mix and not to a change in what buyers pay per foot.
The gap between list price and sale price is the figure that touches a seller most directly. The MLS table shows sellers receiving an average of $11,187 less than their asking prices in August, which is 1.7% of the $648,840 average, a figure this brief computes. Across the twelve months in the table, the gap runs from $4,862 to $13,000 and averages about $10,013. The data site gives the spread of what sold, with a middle half between $522,595 and $805,000, so the upper quartile starts at 1.54 times the lower, also computed here. A median across a range that wide cannot price a single home.
The page-internal check on the clock is worth making. The MLS report says days on market of 110 in August are the longest in over a decade. The table shows 110 as the highest of the twelve months it lists, with 107 in March and 101 in October, so the table supports the highest in a year. It cannot support a decade, because the table shows only about two years, and the report says it archives city data back to January 2008 without showing it. That sentence is the brokerage's claim, and this brief repeats it as such.
| Month | For sale | Sold | Average price | Days on market | Below asking |
|---|---|---|---|---|---|
| August | 418 | 105 | $648,840 | 110 | $11,187 |
| July | 427 | 107 | $646,449 | 79 | $10,755 |
| June | 425 | 132 | $629,854 | 85 | $12,489 |
| May | 441 | 154 | $624,776 | 81 | $8,613 |
| April | 427 | 138 | $638,183 | 75 | $10,429 |
| March | 409 | 139 | $624,310 | 107 | $8,439 |
Source: local brokerage report built on the regional multiple listing service; homes under $1,000,000 and over 1,000 square feet. Commercial content; not independently verified.
How long does a Queen Creek sale take?
The clocks run from 48 days to 110, and they measure different things. The data site's median of 48 days runs from listing to a contract, across 491 closings, and its median of 29 days runs from contract to closing, across 467. They add to 77 days, an approximation from two medians over different sets of closings. Zillow's 50 days to pending is close to the 48. Redfin's 71 days, up from 64, is 10.9% longer than a year ago, a figure this brief computes, and its compete score page says 80 days to sell. The MLS report's 110 for August is the sold-home figure at the top of its range.
The MLS table shows the month-to-month movement. Days on market run 75 in April, 81 in May, 85 in June, 79 in July and 110 in August. The twelve months listed run from 73 to 110 with a median of 92. A reading of 110 is 2.3 times the data site's 48-day median to a contract, a ratio this brief computes, and the difference is that the MLS figure runs to a sale and the data site's runs to an accepted offer. A seller who reads 48 and plans for a quick closing, and a seller who reads 110 and plans for months, are both reading a correct figure.
The supply side is steadier. The MLS report counts 408 homes at the start of September, which is 99% of the three-year average of 413, and 105 August sales, which is 86% of the three-year average of 122. Sales ran lower than usual while listings ran about normal, so the report puts inventory at 4.0 months. A fall in sales from 154 in May to 105 in August is 31.8%, as the report says. The report also says that bank-owned properties and short sales were 0 sales, 0.0%, last month, so the market has no distressed segment to speak of.
Redfin calls the market somewhat competitive, with homes receiving 1 offer on average. That is the page's own description and it sits beside a 71-day average. The two statements are consistent in a market where a typical home gets one offer after a long wait. No page gives the share of Queen Creek homes that sold within the first two weeks.
What does the Census say about the housing stock?
The Census postal area that includes Queen Creek has 29,983 housing units, and the stock is young. Of those, 12,139 were built in the 2000s, 40.5%, 9,692 in the 2010s, 32.3%, and 4,736 in 2020 or later, 15.8%. Together the three decades make up 26,567 units, 88.6% of the total, and the median year built is 2010. Homes built before 1980 number 1,053, only 3.5%. A seller in this area owns a house that is, in the typical case, sixteen years old, a stock that is new enough for most roofs and systems to be within their first cycle.
The households are owners. Of 28,504 occupied homes, 25,149 are owner-occupied, 88.2%, and 3,355 are rented, 11.8%. Among owners, 1,252 moved in from 2023 on and 7,233 in 2020 to 2022, which together are 33.7% of owners. Another 12,230 moved in during the 2010s, 48.6%. Owners who arrived in the 1990s or before number 717, 2.9%. Among renters, 1,651 of 3,355 moved in from 2020 on, 49.2%, all computed here. A third of owners bought in the last five years or so, which is the cohort that bought at the recent peak.
The Census median owner-occupied value is $593,500, with a margin of error of $12,290, and the median rent is $2,187 a month. The value is owners' own estimate of what their homes would sell for, over five years. It is 96.7% of Redfin's $614,000 median, 93.1% of the data site's $637,500 and 91.5% of the MLS table's August average, all computed here. The Census median household income is $129,367. The margin of error is narrow because the sample is large, which gives the Census value more weight than most small-area figures.
Vacancy is low. Of 29,983 housing units, 1,479 are vacant, 4.9%. Of those, 404 are held for seasonal, recreational or occasional use, 335 are for sale, 261 are in the other category, 216 are for rent, 215 are sold and not yet occupied and 48 are rented and not yet occupied. The 335 for-sale units are 22.7% of the vacant ones and 1.1% of all units, computed here, and they sit beside 408 to 418 listings in the MLS report. The two counts are in the same range, though the survey is a five-year average. Readers comparing markets can also read the Fountain Hills brief and the Flagstaff brief.
Source: Census Reporter, American Community Survey 2020-2024 five-year estimates, tables B25034, B25038, B25004, B25077, B25003, B25002, B25064 and B19013. Percentages and ratios are this brief's arithmetic.
What should an owner ask, and what does a private sale change?
The first question is which count and which clock a pricing opinion uses. A figure of 460 sales a month and a figure of about 120 describe two different markets, and a clock of 48 days and a clock of 110 describe two different waits. A seller should ask for the closed sales in the home's own size and price band over the last six months, and for the share that sold below the opening ask.
The second question is the gap to asking. The MLS table shows sellers receiving an average of $4,862 to $13,000 less than asking across twelve months. That is a sum a seller can plan for. It is also the average of a market in which the median home stays on the market for months, and the pages do not say how much of it comes from a first price that was later cut.
The third question is the commission, and the arithmetic is simple. Each 1% of a $637,500 price is $6,375. At 3% the figure is $19,125 and at 5% it is $31,875. These illustrate the size of each percentage point and are not quotes of any rate a seller would be charged. No page in this brief names a Queen Creek commission rate, and $637,500 is a data site's median and not the price of any one home. For a home at the $805,000 top of the middle half, each 1% is $8,050.
The fourth question is repairs. In a postal area where 88.5% of homes were built in 2000 or later, the buyer's inspector is less likely to find a failing roof or a dated electrical panel than in an older town, and the first systems are reaching the end of their first life. The pages do not give the share of Queen Creek sales that needed repairs or credits, and this brief invents none. A private sale avoids inspection repairs altogether.
The benefits are plain. Maison Off-Market buys luxury homes and estates directly from their owners and speaks only to sellers. A private sale has no showings and no neighbors talking about a sale. It allows closing dates that give a seller time to find a new home. It has no commission costs and no closing costs, and it avoids inspection repairs. The company does not say that a private sale always beats a public listing, and in a market where the pages disagree on both the number of sales and the time to sell, an owner is right to ask what each route yields. If you would like a private, no-obligation offer for a Queen Creek home, call 401-219-4207 or use the contact form on this site.
Methodology and limitations
Redfin's figures run to June 2026 and its count of 460 June sales is not reconciled with the other pages. The MLS report is a brokerage's monthly summary of the regional listing service for single-family homes, patio homes and townhomes under $1,000,000 and over 1,000 square feet, and its claim that 110 days is the longest in over a decade cannot be checked against the twelve months its table shows. The data site's median and quartiles are from closings it tracked and were updated October 3, 2026. Zillow's figure is an average of modeled values as of July 31, 2026. The pages cover different property types, filters and periods and are commercial, so they are not independent of each other. The Census figures are five-year estimates for a postal area.
Conclusion
The Queen Creek record shows medians from $614,000 to $637,500, 460 sales in a month on one page and about 120 on two others, clocks from 48 to 110 days, an average of $11,187 below asking, and a postal area where 88.5% of homes were built in 2000 or later. The pages differ because they count different sales and measure different clocks, and the useful figure for an owner is the one for the home's own size and price band.
Frequently Asked Questions
What is the median home price in Queen Creek?
Pages differ. Redfin shows $614,000 for three months to June 2026, a data site shows $637,500 for six months, and a regional MLS report shows an average of $648,840 for August.
How long does it take to sell a home in Queen Creek?
Pages differ. A data site shows a median of 48 days to a contract and 29 more to close, Zillow shows about 50 days to pending, Redfin shows 71 days, and an MLS report shows 110 days for August.
How many homes sell in Queen Creek each month?
Pages differ. Redfin counts 460 in June, while an MLS table counts 132 in June and about 120 a month over twelve months, and a data site tracked 736 in six months.
How old are the homes in Queen Creek?
In the Census postal area that includes Queen Creek, 88.5% of homes were built in 2000 or later, 3.5% were built before 1980, and the median year built is 2010.
Can I sell my Queen Creek home privately?
Yes. Maison Off-Market buys luxury homes and estates directly from their owners with no showings, flexible closing dates, no commission costs, no closing costs and no inspections or repairs. Call 401-219-4207 or use the contact form.
Compare your options before committing. Request a written private offer for your property, with no obligation, then weigh it against your listing plan.
Sources
- Redfin, 2026. Queen Creek Housing Market. https://www.redfin.com/city/30786/AZ/Queen-Creek/housing-market.
- Local brokerage blog, 2026. September 2026 Queen Creek Housing Market Report. https://www.metrophoenixhomes.com/post/queen-creek-housing-market-report.
- Resideline, 2026. Queen Creek, AZ Housing Market 2026: What Homes Actually Sell For. https://resideline.com/blog/queen-creek-az-housing-market.
- Zillow, 2026. Queen Creek, AZ Housing Market: 2026 Home Prices and Trends. https://www.zillow.com/home-values/8814/queen-creek-az/.
Related research

Seller Guide · October 6, 2026
How to Prepare Point Pleasant Beach Rental Records Before Selling
Separate rental approval, income history and booked stays before comparing sale terms.

Seller Guide · October 6, 2026
How to Prepare Rumson Flood and Waterfront Records Before Selling
Separate flood disclosure, elevation, repairs and waterfront rights before comparing sale terms.

Seller Guide · October 6, 2026
How to Prepare Sarasota Condo Inspection and Reserve Records Before Selling
Separate building condition, reserve funding and resale documents before comparing sale terms.