Market Brief · by Aidan Sowa · October 5, 2026
Does a Flagstaff Seller's Home Suit a Local Buyer or an Investor With Tenants? Reading Redfin, Zillow, Realtor.com and the Census Renter Homes
Reading Redfin, Zillow, Realtor.com and the Census Renter Homes for Flagstaff, AZ, with each source dated and its limits noted, for owners weighing a listing against a direct sale.
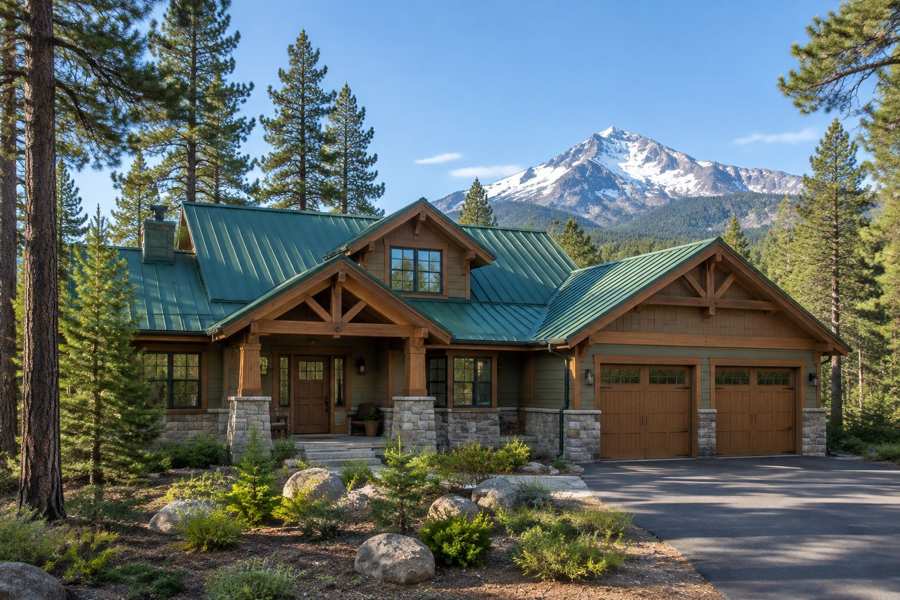
Does a Flagstaff seller's home suit a local buyer or an investor with tenants? Redfin's page for Flagstaff, for the three months ending July 2026, shows a median sale price of $702K, down 5.2%, with homes selling in 30 days and the average home going for about 2% below list. Realtor.com's page for Flagstaff, for June 2026, shows a median sold price of $714,000, down 6.17% in a year, and Zillow's page for Flagstaff, updated August 31, 2026, shows a home value index of $656,451, up 0.1%. The sources agree that prices are flat to lower.
The Census shows why investors matter here. In the postal area that includes Flagstaff, 3,269 of 7,622 occupied homes, 42.9%, are rented, and 51.1% of those renter households moved in since 2020. Of 17,961 residents, 14.3% are 18 to 24, which is high for a residential area. Realtor.com also shows 388 rental properties, up 56.42% in a year, against 814 homes for sale. A seller's house may be bought by a family, or by an investor who will rent it.
Maison Off-Market speaks only to sellers, and this brief is for an owner in Flagstaff. It uses the sheet's name for the town and the Census postal area that the sheet lists for it. Every figure below is dated and linked, the arithmetic is shown, and inferences are labeled.
Key Findings
- Redfin's page for Flagstaff, for the three months ending July 2026, showed a median sale price of $702K, down 5.2% from the same period last year, $394 per square foot, up 5.3%, 250 homes sold in July against 254 a year earlier, and a median of 30 days on market against 38. The sale-to-list ratio was 98.1%, 16.4% of homes sold above list and 26.5% of homes had price drops. The page rated the market somewhat competitive: some homes get multiple offers, the average home sold about 2% below list and went pending in around 33 days, and the hottest homes sold around list in around 10 days (Redfin, Flagstaff housing market). The page title says as of August.
- Zillow's page for Flagstaff, updated August 31, 2026, showed a home value index of $656,451, up 0.1% over the past year, with homes going pending in around 32 days (Zillow, Flagstaff home values).
- Realtor.com's page for Flagstaff, for June 2026, showed a median listing price of $871,405, up 7.36% in a year and up 11.78% in three, a median sold price of $714,000, down 6.17% in a year and up 8.68% in three, $429 per square foot, up 2.29%, 814 active listings, up 5.13% in a year and up 33.60% in three, 54 days on market, up 13.33%, 388 rental properties, up 56.42% in a year and up 140.72% in three, and a median rent of $2,049 per month, down 1.96%. Homes sold for 99% of the asking price (Realtor.com, Flagstaff housing market).
- In the Census postal area that includes Flagstaff, 9,190 housing units were counted, 7,622 were occupied, 42.9% of occupied homes were rented, the median build year was 1995, the median household income was $87,942 and the median owner value was $599,900, plus or minus $25,822 (U.S. Census Bureau, American Community Survey 2020-2024 five-year estimates, via Census Reporter).
- Of the 17,961 people counted in the postal area, 22.7% are under 18, 14.3% are 18 to 24, 15.0% are 25 to 34, 13.5% are 35 to 44, 20.3% are 45 to 64 and 14.1% are 65 or older. Of renter households, 48.2% with a computed figure spent 30% or more of income on rent (U.S. Census Bureau, American Community Survey 2020-2024 five-year estimates, tables B01001 and B25070).
Why do the Flagstaff price figures disagree?
The three sources differ by level, and the levels are not alarming. Redfin's $702K is a three-month median of all home types through July. Realtor.com's $714,000 is the June median sold price, 1.7% above Redfin's, computed here. Zillow's $656,451 is an index of typical value across all homes, including condominiums and townhouses, which is 6.5% below Redfin's median, computed here. A seller reading all three should expect a citywide range of about $0.66M to $0.71M.
The year-earlier values show a soft year. Redfin's fall of 5.2% implies about $740,506 a year earlier. Realtor.com's fall of 6.17% implies about $760,951. Zillow's rise of 0.1% implies about $655,795, so the index is flat while the medians are lower, which points to a shift in which homes were sold. That is an inference. The three-year change on Realtor.com is up 8.68%, which implies about $657,000 three years earlier, so sales are above where they were three years ago.
Per-foot prices go the other way. Redfin's $394 is up 5.3%, which implies about $374 a year earlier, and Realtor.com's $429 listing price per foot is up 2.29%, which implies about $419. A median price that fell 5.2% beside a per-foot price that rose 5.3% suggests that smaller homes made up more of the sales, which is a plausible mix effect in a market with many condominiums and townhouses. A seller with a large house should look at per-foot figures and at sales of homes of the same size.
Listings sit well above sales. Realtor.com's listing median of $871,405 is 22.0% above its sold median, computed here, and up 7.36% in a year, which implies about $811,666 a year earlier. Asking prices are rising while sale prices fall, and the gap is the room in which negotiation takes place. A seller who prices at the listing median is pricing 22.0% above what homes sold for.
The Census owner value of $599,900, plus or minus $25,822, is 14.5% below the Redfin median, 8.6% below the Zillow index and 16.0% below the Realtor.com sold median, computed here. It is 6.8 times the Census median household income of $87,942. The owner value is the owner's own estimate, and it comes from the postal area as a whole, which includes the condominiums and older homes that sell for less.
The practical lesson is to price from the closest comparison available. A citywide median over three months mixes condominiums, townhouses, older bungalows and large newer houses, and a seller has only one of those. Sales of homes with the same bedrooms, the same age and the same lot, within the last few months, are the figures that matter, and a buyer or an investor will find them in an afternoon. An owner who has them first can judge any offer, public or private, against a number that is the owner's own and not a city average.
| Source | Figure | What it measures |
|---|---|---|
| Census Reporter | $599,900 | Median owner value, postal area |
| Zillow | $656,451, up 0.1% | Home value index, August 2026 |
| Redfin | $702K, down 5.2% | Median sale price, three months to July 2026 |
| Realtor.com | $714,000, down 6.17% | Median sold price, June 2026 |
| Realtor.com | $871,405, up 7.36% | Median listing price, June 2026 |
Sources as cited. Ratios and year-earlier values in this section are computed from the published figures and percentages.
How competitive is Flagstaff, and how fast do homes sell?
Redfin rates Flagstaff somewhat competitive. Some homes get multiple offers. The average home sells about 2% below list and goes pending in around 33 days, and the hottest homes sell around list in around 10 days. The sale-to-list ratio is 98.1%, so on a $702K sale the gap from the ask is about $13,338, computed here, and 16.4% of homes sold above list, which is one home in six.
Redfin shows a median of 30 days on market against 38 a year earlier, which is 8 days faster. Zillow shows around 32 days to pending, and Realtor.com's figure for June is 54 days, up 13.33% in a year, which implies about 48 days a year earlier. The sources disagree about direction, and the likely cause is that they measure different things: Redfin counts days to a sale of homes that sold, and Realtor.com counts days on market of homes listed. A faster Redfin figure and a slower Realtor.com figure can both be true.
Price drops are common. Redfin shows that 26.5% of listings had price drops, so more than one listing in four was cut. Together with 16.4% of sales above list, the numbers show a market in which pricing decides the outcome, as in most markets, with a home priced right moving in a month and a home priced high drawing cuts.
Supply is growing. Realtor.com shows 814 active listings, up 5.13% in a year, which implies about 774 a year earlier, and up 33.60% in three years, which implies about 609. The page's own text says for-sale counts are up 14%, which does not match the 5.13% in its table, and the difference is reported as printed and not resolved. Redfin counted 250 sales in July, so 814 listings are about 3.3 times a month of sales, computed here and an inference, since the two sources count different months.
For a seller, the practical point is that the market is neither slow nor hot. A month or two is a fair expectation for a well-priced home, and a seller who must sell by a date can use a private offer to remove the doubt. In a town with many renters and investors, a private buyer who is an investor can often move faster than a family that needs a mortgage and a sale of its own home.
Seasonality is likely to matter in a mountain town, though the pages do not break out sales by month. Winter weather and the school and university calendars both shape when buyers look and when sellers list, and the spring is the usual time for a seller to bring a home to market. A seller who must sell in the autumn or winter has a smaller pool, which is an inference and not a measured pattern, and may value an offer that does not wait for a season.
Sources as cited. Year-earlier values and differences are computed from the published percentages.
How big is the Flagstaff rental market?
The Census count is high for a place with this many houses. Of 7,622 occupied homes, 3,269, or 42.9%, are renter-occupied and 4,353, or 57.1%, are owner-occupied. Of renter households, 408 moved in during 2023 or later and 1,264 between 2020 and 2022, so 1,672, or 51.1%, moved in since 2020. Another 1,502, 45.9%, moved in between 2010 and 2019 and 95, 2.9%, between 2000 and 2009. In all, 97.1% of renter households arrived since 2010.
Rentals are growing in the listings. Realtor.com shows 388 rental properties, up 56.42% in a year, which implies about 248 a year earlier, and up 140.72% in three years, which implies about 161. Rental listings are now about 0.48 of the for-sale count of 814, computed here. The median rent is $2,049, down 1.96%, which implies about $2,090 a year earlier, and down 4.70% in three years. More rentals and lower rents are a sign that supply is catching up with demand.
Renters carry a heavy cost. Of 3,169 renter households with a computed figure, 1,527, or 48.2%, spent 30% or more of income on rent, and 830, or 26.2%, spent half or more. The Census median rent is $1,577. A renter who spends that share of income is unlikely to become a buyer at a median price of $700,000, which leaves investors and move-up owners as the buyers of most houses.
Renters live in smaller homes. Of 3,269 renter households, 432, or 13.2%, live in a home with no bedroom, 731, or 22.4%, in a one-bedroom, 1,154, or 35.3%, in a two-bedroom, 731, or 22.4%, in a three-bedroom and 221, or 6.8%, in one with four bedrooms, so 35.6% live in a studio or one-bedroom home and 29.1% in a home with three or more bedrooms.
The Census age mix fits a town with a large student and young adult population. Of 17,961 residents, 4,078, or 22.7%, are under 18, 2,568, or 14.3%, are 18 to 24, 2,703, or 15.0%, are 25 to 34, 2,422, or 13.5%, are 35 to 44, 3,649, or 20.3%, are 45 to 64 and 2,541, or 14.1%, are 65 or older. The link to a university in town is an inference, and the Census table does not say who the 18 to 24 group are.
A tenant in place changes the sale. A buyer who wants to live in the home must wait for the lease to end or pay the tenant to leave, and a buyer who wants to keep renting will value the home by its rent and its costs. A landlord should be ready to show the lease, the rent history and the repair record. A private buyer who is an investor will read those papers quickly, and an owner who has them in order is better placed than one who must search for them while a buyer waits.
Source: U.S. Census Bureau, American Community Survey 2020-2024 five-year estimates, tables B25038, B25070, B25042 and B01001, via Census Reporter. Shares are computed here.
What do the owners and the homes look like?
The stock is mixed in age. Of 9,190 housing units, 2,561, or 27.9%, were built in the 2000s, 2,244, or 24.4%, in the 1990s, 1,415, or 15.4%, in the 1980s, 1,374, or 15.0%, in the 1970s and 944, or 10.3%, in the 2010s. Only 39 units, 0.4%, date from 2020 or later. In all, 1,987 units, 21.6%, were built before 1980, and 3,544, 38.6%, since 2000. The median build year is 1995.
Houses are two thirds of the stock. Of the units, 5,912, or 64.3%, are detached, 394, or 4.3%, are attached, 583, or 6.3%, are in buildings of two to four units and 1,766, or 19.2%, are in buildings of five or more. Mobile homes make up 455 units, 5.0%, and boats, recreational vehicles and similar make up 80 units, 0.9%. Vacancy is 1,568 units, 17.1%, and of those, 1,185, or 75.6%, are held for seasonal use, which is 12.9% of all units.
Owner homes are large. Of 4,353 owner households, 2,364, or 54.3%, live in a three-bedroom home, 1,213, or 27.9%, in a four-bedroom and 185, or 4.2%, in one with five or more bedrooms, so 86.4% have three or more bedrooms. Only 591 owner households, 13.6%, live in a home with two bedrooms or fewer. The houses that sell for the median price are family houses.
Owners are fairly new. Of 4,353 owner households, 66 moved in during 2023 or later and 639 between 2020 and 2022, so 705, or 16.2%, moved in since 2020. Another 1,900, 43.6%, moved in between 2010 and 2019, 1,005, 23.1%, between 2000 and 2009, 516, 11.9%, in the 1990s and 227, 5.2%, before 1990. In all, 59.8% arrived since 2010, and 17.1% have been in place since before 2000.
Costs are moderate. Of 4,353 owners, 2,783, or 63.9%, have a mortgage and 1,570, or 36.1%, do not. Among owners with a mortgage, 645, or 23.2%, spent 30% or more of income on housing, and 253, or 9.1%, spent half or more. Among owners without a mortgage, 118, or 7.5%, spent 30% or more. In all, 763 owner households, 17.5%, carry a heavy cost, a smaller share than among renters, at 48.2%.
Put together, a typical owner in this postal area bought within the last fifteen years, borrowed a good part of the price and lives in a three or four bedroom house built in the 1990s or 2000s. Some owners sell for work or family reasons and want certainty about a date. Others hold a second house and let it, and are weighing the monthly rent against the price they could take. For each, a clear net figure is the most useful thing a buyer can offer. Readers comparing markets can also read the Queen Creek brief and the Sedona brief.
Source: U.S. Census Bureau, American Community Survey 2020-2024 five-year estimates, tables B25034, B25024, B25004, B25042, B25038, B25091 and B25077, via Census Reporter. Shares are computed here.
What should a Flagstaff owner ask, and what does a private sale change?
Five questions are worth asking. Is my home priced against sales or against listings, which sit more than a fifth higher? Who is the likely buyer, a family or an investor who will rent it? How long can I wait? What will the fees be? How much of the price survives the buyer's inspection?
Fees are simple arithmetic, and no rate is assumed here. Each 1% of a $450,000 sale is $4,500, of a $725,000 sale is $7,250 and of a $1,200,000 sale is $12,000. Three percent is $13,500, $21,750 and $36,000, and five percent is $22,500, $36,250 and $60,000. A seller can put their own quoted costs into those rows. On the Redfin median of $702K, 1% is $7,020, 3% is $21,060 and 5% is $35,100.
A private sale has no showings and no neighbors talking about it, which is the first benefit. For a landlord with tenants in place, there is a practical side: no open houses through occupied homes and no notices to tenants for showings. The second benefit is a closing date that suits the seller, which helps an owner who needs to time a sale to the end of a lease or a school year.
The third and fourth benefits are no commission costs and no closing costs, and the fifth is no inspection repairs. In a postal area where 21.6% of homes were built before 1980 and many of the rest are two or three decades old, an inspector will look at the roof, the heating and the plumbing, so the fifth is worth pricing.
Maison Off-Market buys luxury homes and estates directly from their owners and speaks only to sellers. It does not say that a private sale always beats a public listing, and in a market where one home in six sells above the ask, an owner is right to compare an offer with what the same home would net after costs. If you would like a private, no-obligation offer for a home in Flagstaff, call 401-219-4207 or use the contact form on this site.
Sources as cited. Fee illustrations are arithmetic only and assume no commission rate.
Methodology and limitations
Each page's date, title and place were read before use. The Redfin page is for the three months ending July 2026 and is titled as of August. The Zillow page was updated August 31, 2026. The Realtor.com page is for June 2026, so it is four months old, and its text says for-sale counts are up 14% while its table says 5.13%; both are reported and the discrepancy is not resolved. Only established data publishers and the Census are cited. The Census figures are five-year estimates for the postal area that the sheet lists for Flagstaff. Percent changes were taken as printed, and ratios, sums, fee figures and year-earlier values are this brief's arithmetic.
Conclusion
The record for Flagstaff shows a level of about $0.66M to $0.71M, a year of lower medians, homes that sell around 2% below list in about a month and a market in which more than four occupied homes in ten are rented and rental listings are growing fast. The useful number for an owner is a closed sale of a comparable home, and a private buyer can price the home in front of them and close on the owner's schedule.
Frequently Asked Questions
What is the median home price in Flagstaff?
Redfin shows a median sale price of $702K for the three months ending July 2026, down 5.2%, and Realtor.com shows $714,000 sold in June 2026.
How long do homes take to sell in Flagstaff?
Redfin shows a median of 30 days on market and around 33 days to pending for the average home, and Zillow shows around 32 days.
Do homes in Flagstaff sell above asking?
Some do. Redfin shows a sale-to-list ratio of 98.1%, with 16.4% of homes selling above list.
What does the Census say about homes near Flagstaff?
In the postal area, 42.9% of occupied homes are rented and 21.6% of homes were built before 1980.
Can I sell my home in Flagstaff privately?
Yes. Maison Off-Market buys luxury homes and estates directly from their owners with no showings, flexible closing dates, no commission costs, no closing costs and no inspections or repairs. Call 401-219-4207 or use the contact form.
Compare your options before committing. Request a written private offer for your property, with no obligation, then weigh it against your listing plan.
Sources
- Redfin, Flagstaff housing market, 2026. Flagstaff, AZ Housing Market. https://www.redfin.com/city/6089/AZ/Flagstaff/housing-market.
- Realtor.com, Flagstaff housing market, 2026. Flagstaff, AZ Housing Market and Rental Trends. https://www.realtor.com/local/market/arizona/coconino-county/flagstaff.
- Zillow, Flagstaff home values, 2026. Flagstaff, AZ Housing Market: 2026 Home Prices and Trends. https://www.zillow.com/home-values/31567/flagstaff-az/.
Related research

Seller Guide · October 6, 2026
How to Prepare Point Pleasant Beach Rental Records Before Selling
Separate rental approval, income history and booked stays before comparing sale terms.

Seller Guide · October 6, 2026
How to Prepare Rumson Flood and Waterfront Records Before Selling
Separate flood disclosure, elevation, repairs and waterfront rights before comparing sale terms.

Seller Guide · October 6, 2026
How to Prepare Sarasota Condo Inspection and Reserve Records Before Selling
Separate building condition, reserve funding and resale documents before comparing sale terms.