Market Brief · by Aidan Sowa · October 5, 2026
Why Does One Bend Page Say Days to an Offer While Another Says Days on Market? Reading the September Median, Supply and Price Cuts
Reading the September Median, Supply and Price Cuts for Bend, OR, with each source dated and its limits noted, for owners weighing a listing against a direct sale.
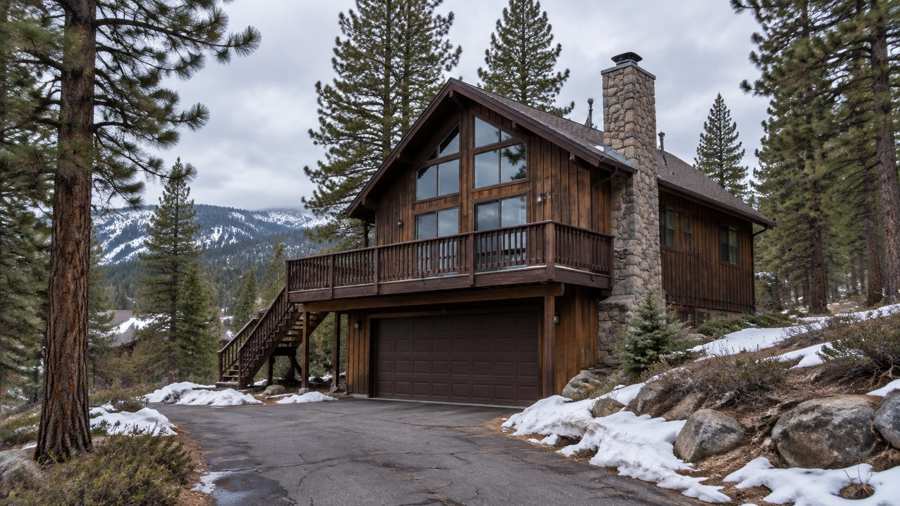
Why does one Bend page say 29 days to an offer while another says 69 days on market? A brokerage's market page says that the typical wait between a single-family house going on the market in Bend and a seller accepting an offer was 29 days over the last 90 days. A federal data series from the St. Louis Fed, sourced from Realtor.com, puts the median days on market for the Bend-Redmond metro area at 69 in July 2026, up from 52 in March. The two figures are 2.4 times apart, a ratio this brief computes, and both describe the same part of Oregon.
The pages do not conflict so much as measure different things. One counts days from listing to an accepted offer for homes that closed, the other counts days a listing was on the market across a metro area, and the second includes homes that sit unsold and then cut their price. A seller who reads only the first number expects a quick sale. A seller who reads the second expects a long one. This brief reads both, and adds Redfin and Zillow clocks that fall in between.
Four other things are in dispute: whether Bend's median price rose or fell, how many homes are for sale, how to judge a market that has 3.5 months of supply, and how many of the homes in the postal area are lived in at all. Maison Off-Market speaks only to sellers, and the last section sets out what a private sale changes.
Key Findings
- A brokerage's market page, updated October 3, 2026, showed 724 single-family homes for sale, a median list price of $895,500, 29 days to an offer, 66 days the average active listing had been listed, a median sale price of $759,000 for September, and 45.6% of the last 12 months' sales closing with a price cut (Brokerage, Bend housing market page).
- The same brokerage's September report said 199 single-family homes closed at a $759,000 median, down 1.0% from $766,750 a year earlier, and counted 727 active listings and 3.5 months of supply, using a scale where 4 months or less favors sellers (Brokerage, Bend September report).
- Redfin showed a median sale price of $733K for the three months to July 2026, up 2.8% on the year, with 1 offer on average and homes selling in about 28 days, and a competition section that says 36 days (Redfin, Bend housing market).
- Zillow showed an average Bend home value of $729,189, down 0.8% over the year, with homes going pending in about 33 days as of August 31, 2026 (Zillow, Bend home values), and the St. Louis Fed series showed a median of 69 days on market for the metro area in July 2026 (FRED, median days on market, Bend-Redmond).
- The Census postal area that includes Bend has 16,106 housing units, 1,842 of them vacant, and 1,111 of the vacant units are held for seasonal, recreational or occasional use, which is 60.3% of the vacancies and 6.9% of all units, ratios this brief computes.
How long does a Bend sale take, and who is counting?
Five clocks appear across the pages, and they span 28 days to 69. The brokerage page reports a median of 29 days to an offer over the last 90 days, a median list-to-pending time for homes that closed, and in the same list an average of 66 days that the active listings have sat on the market without going under contract. Its September report says homes going pending now are doing it in a median of 29 days. Redfin's header says homes sell in around 28 days, and the competition section of the same page says 36 days and, further down, 35. Zillow says around 33 days to pending. The Fed series says 69 days for the metro area in July.
These are different questions. A median time to an accepted offer for homes that went under contract is short because it excludes the homes that never did. The average age of an active listing is long because it includes them. The brokerage page puts the two side by side, 29 days against 66, a ratio of 2.3 that this brief computes, and the gap tells a seller that the homes which sell go quickly and the homes which do not sit. The Fed series is a median for the whole metro area, which includes Redmond and surrounding country, and it moved from 52 days in March to 50, 57, 64 and 69 in the next four months, a rise of 33% from March to July that this brief computes.
Redfin's page contradicts itself on the clock. Its summary says homes sell in around 28 days, its competition heading says 36, and the bullets under it say 36 and then 35. The page does not explain the difference, and the 28 comes from a three-month window to July while the 36 may come from a different window or a different measure. A seller should not pick the shortest number from a page that gives four.
The month-to-month pattern matters more than any one clock. The Fed series shows days on market rising each month from April to July, while the brokerage's October median to an offer is 29 days, from a different window. A listing that goes on the market in a rising period can expect to sit longer than the 29-day median suggests, and a listing that is priced to the closed sales can expect to go under contract near it. That is an inference from the two series, and no page measures it for a particular home.
| Source | Figure | What it measures |
|---|---|---|
| Brokerage market page | 29 days | Median listing to accepted offer, last 90 days |
| Brokerage market page | 66 days | Average age of active listings |
| Redfin | 28 days | Median days on market, three months to July |
| Redfin | 36 days | Average days to pending, competition section |
| Zillow | About 33 days | Days to pending, as of August 31 |
| St. Louis Fed series | 69 days | Median days on market, Bend-Redmond metro area, July |
Sources as cited. The measures, areas and periods differ and the figures are not directly comparable. Commercial and federal series; not independently verified.
Did Bend's median price rise or fall?
The pages disagree on direction. The brokerage says the September median fell 1.0% to $759,000 from $766,750 and that the 12-month median of $765,000 is down 1.3% on the previous 12 months. Redfin says the three-month median to July was $733K, up 2.8%. Zillow says its average home value of $729,189 is down 0.8% over the year. A reader who sees only one of the three learns a rise, a fall or a small fall, and all three are within a few percent of each other.
The monthly series shows why. The brokerage lists the 2026 monthly single-family medians as $717,000 in January, $745,000, $708,000, $725,000, $855,000 in May, $773,000, $800,000, $750,000 and $759,000 in September. The highest, $855,000, is 20.8% above the lowest, $708,000, a spread this brief computes, inside one year. A market where one month can sit 20% above another has a median that depends on which months a page averages, and a three-month figure to July covers April to July, including the $855,000 May.
The three measures are not the same thing. The brokerage and Redfin report medians of closed sales, Zillow reports the average of its modeled home values across all homes, and the brokerage's median is for single-family houses while Redfin's headline covers all home types. The brokerage also reports a median list price of $895,500, which is 18.0% above the $759,000 September sale median, a figure this brief computes, and a median asking price higher than the median sale is normal because the homes that sell are priced lower, or sell below their asking price.
Redfin's page says the average home sells for about 1% below list price, and the brokerage page says 45.6% of last year's sales took at least one price cut before they closed. Neither page gives the size of the cuts. Price per square foot is the steadier measure on Redfin, at $385 and up 3.2% on the year, and a seller can test that against comparable homes. The brokerage's listing rows show asking prices from $286 to $583 per square foot for individual houses, which is a wider spread than any median shows.
| Source | Figure | What it measures |
|---|---|---|
| Brokerage market page | $759,000 | Median sale price, single-family, September, down 1.0% |
| Brokerage market page | $765,000 | Median sale price, last 12 months, down 1.3% |
| Brokerage market page | $895,500 | Median list price, single-family |
| Redfin | $733K | Median sale price, three months to July, up 2.8% |
| Zillow | $729,189 | Average home value, down 0.8% |
| Brokerage market page | $708,000 to $855,000 | Range of 2026 monthly medians, January to September |
Sources as cited. The measures, areas and periods differ and the figures are not directly comparable. Commercial content; not independently verified.
How many Bend homes are for sale, and is 3.5 months a seller's market?
The brokerage page counts 724 single-family homes for sale as of October 3 and 4, 2026, 222 under contract, 176 lots for sale and 74 townhomes for sale. Its September report, dated the same day, counts 727 active single-family listings as of October 3. The two counts differ by 3 on the same date, and neither page explains it. The page defines months of supply as active listings divided by the average monthly closings of the last six months, and it shows 204 closings a month, so 724 divided by 204 is 3.5, which this brief checks.
The scale is the brokerage's own. It says 4 months or less is a seller's market, above 4 and under 6 is balanced, and 6 or more is a buyer's market. Many market commentaries put the balanced point nearer 6 months, and this page puts it at 4 to 6, so a market with 3.5 months is called a seller's market where another page's scale might call it closer to balanced. The scale is a convention. The page that counts the supply also reports that 45.6% of sales closed with a price cut and that the average listing has sat 66 days, which are the signs a seller should weigh beside the label.
Cash matters as well. The page says 28.3% of detached sales over 12 months closed with cash. It counts 2,210 homes sold in the last 12 months, which is about 184 a month, a figure this brief computes, against Redfin's 637 homes sold in July, up from 541. The two are far apart, and Redfin's count may cover three months or all home types, which the page does not say. The brokerage's 2,210 and 28.3% imply about 625 cash sales a year if the share applied to all of them, an inference that mixes detached homes with all single-family sales and is only a rough scale.
The inventory story also depends on what is counted. A count of 724 single-family houses leaves out 176 lots and 74 townhomes that are also for sale in Bend. A seller of a house competes with the houses, and a seller of land with the lots. The brokerage says the 727 and 724 are active single-family listings, and the median asking price of $895,500 describes those homes, not the homes that closed.
| Source | Figure | What it measures |
|---|---|---|
| Brokerage market page | 724 | Single-family homes for sale, October 3 to 4 |
| Brokerage September report | 727 | Active single-family listings, October 3 |
| Brokerage market page | 3.5 months | Active listings divided by average monthly closings over six months |
| Brokerage market page | 199 | Closings in the last 30 days |
| Brokerage market page | 2,210 | Homes sold, last 12 months |
| Brokerage market page | 45.6% | Share of last year's sales that took a price cut before closing |
Sources as cited. The counts use different filters and dates and are not directly comparable. Commercial content; not independently verified.
What does the Census say about the age and tenure of the homes?
The Census postal area that includes Bend has 16,106 housing units. Of those, 4,003 were built in the 2000s, 24.9% of the total, 3,290 in the 1990s, 20.4%, and 3,091 in the 2010s, 19.2%. Homes built before 1980 number 4,388, or 27.2%, and 509 were built in 2020 or later. The median year built is 1999. A seller in this postal area owns a house that is, in the typical case, about a quarter century old.
Ownership is mostly recent. Of 14,264 occupied homes, 10,978 are owner-occupied, 77.0%, and 3,286 are rented, 23.0%. Among owners, 5,199 moved in during the 2010s, 47.4%, and 2,211 moved in from 2020 on, 20.1%. Owners who arrived since 2010 number 7,410, or 67.5%, and owners who arrived before 2000 number 1,468, or 13.4%, all computed here. Among renters, 1,766 of 3,286 moved in from 2020 on, 53.7%. A postal area in which two thirds of owners arrived within sixteen years has few long-held homes and many owners who bought into the prices the pages describe.
The Census median owner-occupied value is $990,400, with a margin of error of $33,921, and the median rent is $1,919 a month. The value is owners' own estimate of what their homes would sell for. It is 130.5% of the $759,000 September sale median, 135.1% of Redfin's $733K and 110.6% of the $895,500 median list price, all computed here, so the owners' estimates sit above the market figures here. The pages cannot explain it. One possible reason is that the postal area covers parts of Bend and country outside it, and another is that the survey values homes and not only single-family houses; both are inferences, and no page measures the postal area separately.
The vacancy figures are the most unusual in this series. Of 16,106 housing units, 1,842 are vacant, 11.4%. Of those, 1,111 are held for seasonal, recreational or occasional use, 60.3% of the vacancies. Another 306 are sold and not yet occupied, 145 are in the other category, 137 are for rent, 83 are rented and not yet occupied, and 60 are for sale. The 60 for-sale units are 0.4% of all units, a ratio this brief computes, and they sit beside 724 single-family listings on the brokerage page. The survey figures are five-year averages, so the two counts do not measure the same day. A postal area where 1,111 homes are seasonal has a part of its housing that is not a year-round neighbor, and an owner of such a home may be selling a second home. Readers comparing markets can also read the Bend brief and the Lake Oswego brief.
Source: Census Reporter, American Community Survey 2020-2024 five-year estimates, tables B25034, B25038, B25004, B25077, B25003, B25002, B25064 and B19013. Percentages and ratios are this brief's arithmetic.
What should an owner ask, and what does a private sale change?
The first question is which Bend. The brokerage figures are for single-family houses with a Bend address, Redfin's headline covers all home types, Zillow models all homes, and the Fed series covers a metro area that includes Redmond. The listing rows on the brokerage page include homes with a different postal code from the one that the Census area covers. A seller should ask for the sales that match the home's size, age, lot and location, because a median across a city cannot price one house.
The second question is the price cut. The brokerage page says 45.6% of last year's sales took at least one price cut before they closed. If that share held for a given listing, the first asking price would be the one that was cut. The page does not give the size of the cuts or the days that passed before them, and its September report says a listing priced above the closings joins the homes that sit and then cut. A seller who wants certainty weighs a first price that may be cut against a price that is firm.
The third question is the commission, and the arithmetic is simple. Each 1% of a $759,000 price is $7,590. At 3% the figure is $22,770 and at 5% it is $37,950. These illustrate the size of each percentage point and are not quotes of any rate a seller would be charged. No page in this brief names a Bend commission rate. A seller comparing routes should add the cost of preparing a home for showings, the carrying cost for the weeks it takes to go under contract and the cost of the repairs a buyer's inspection asks for.
The fourth question is time and exposure. The pages describe clocks from 28 days to 69, an average listing age of 66 days and a metro clock that rose for four months in a row. A public listing means showings, open houses and neighbors who can see that a home is for sale. The brokerage's own page says seller credits toward closing costs have been common in Central Oregon closings, which is a cost a seller meets at the table. A flexible closing date in a private sale gives a seller time to find a new home without waiting for a public sale to run its course.
The benefits are plain. Maison Off-Market buys luxury homes and estates directly from their owners and speaks only to sellers. A private sale has no showings and no neighbors talking about a sale. It allows closing dates that give a seller time to find a new home. It has no commission costs and no closing costs, and it avoids inspection repairs. The company does not say that a private sale always beats a public listing, and in a market where the pages disagree on direction, clock and supply, an owner is right to ask what each route yields. If you would like a private, no-obligation offer for a Bend home, call 401-219-4207 or use the contact form on this site.
Methodology and limitations
The brokerage figures come from a market page updated October 3 and 4, 2026 and a September report dated October 3, 2026, both drawn from the same regional MLS and describing single-family homes; the pages differ by 3 on the active listing count. Redfin's data run to July 2026 and the page gives four different clocks. Zillow's figure is an average of modeled values as of August 31, 2026. The Fed series is a metro-area median from Realtor.com, last updated in August 2026 with a July observation. The pages cover different geographies, home types and periods and are commercial or federal series, so they are not independent of each other. The Census figures are five-year estimates for a postal area that is larger than the city and includes seasonal homes.
Conclusion
The Bend record shows a September median of $759,000 that is down 1.0%, a Redfin median of $733K that is up 2.8%, clocks from 28 days to 69, 724 to 727 single-family homes for sale depending on the page, 3.5 months of supply on a scale that calls 4 months a seller's market, 45.6% of sales with a price cut, and a postal area where 1,111 homes are seasonal. The pages differ because they measure different homes, windows and places, and the useful result for an owner is which measurement applies to a given house.
Frequently Asked Questions
What is the median home price in Bend?
Pages differ. A brokerage shows $759,000 for September single-family sales, down 1.0%. Redfin shows $733K for three months to July, up 2.8%. Zillow shows an average home value of $729,189.
How long does it take to sell a home in Bend?
Pages differ. A brokerage shows a median of 29 days to an offer, Redfin shows 28 to 36 days, Zillow shows about 33 days to pending, and a St. Louis Fed series shows a metro median of 69 days on market for July.
Is Bend a buyer's or seller's market?
A brokerage calls it a seller's market at 3.5 months of supply on a scale where 4 months or less favors sellers. Redfin calls it somewhat competitive. The same brokerage reports that 45.6% of sales closed with a price cut.
How many homes in Bend are seasonal?
In the Census postal area that includes Bend, 1,111 homes are held for seasonal, recreational or occasional use, which is 60.3% of its vacant units and 6.9% of all units.
Can I sell my Bend home privately?
Yes. Maison Off-Market buys luxury homes and estates directly from their owners with no showings, flexible closing dates, no commission costs, no closing costs and no inspections or repairs. Call 401-219-4207 or use the contact form.
Compare your options before committing. Request a written private offer for your property, with no obligation, then weigh it against your listing plan.
Sources
- Brokerage, 2026. Bend housing market: a seller's market. https://ryan-realty.com/housing-market/bend.
- Brokerage, 2026. Bend Oregon Market Report: September 2026. https://ryan-realty.com/blog/bend-oregon-market-report-september-2026.
- Redfin, 2026. Bend, OR Housing Market. https://www.redfin.com/city/1543/OR/Bend/housing-market.
- Zillow, 2026. Bend, OR Housing Market: 2026 Home Prices and Trends. https://www.zillow.com/home-values/50962/bend-or/.
- Federal Reserve Bank of St. Louis, 2026. Housing Inventory: Median Days on Market in Bend-Redmond, OR (CBSA). https://fred.stlouisfed.org/series/MEDDAYONMAR13460.
Related research

Seller Guide · October 6, 2026
How to Prepare Point Pleasant Beach Rental Records Before Selling
Separate rental approval, income history and booked stays before comparing sale terms.

Seller Guide · October 6, 2026
How to Prepare Rumson Flood and Waterfront Records Before Selling
Separate flood disclosure, elevation, repairs and waterfront rights before comparing sale terms.

Seller Guide · October 6, 2026
How to Prepare Sarasota Condo Inspection and Reserve Records Before Selling
Separate building condition, reserve funding and resale documents before comparing sale terms.