Market Brief · by Aidan Sowa · October 5, 2026
Which Lake Oswego Clock Is Right? Reading Short, Medium and Long Waits
Reading Short, Medium and Long Waits for Lake Oswego, OR, with each source dated and its limits noted, for owners weighing a listing against a direct sale.
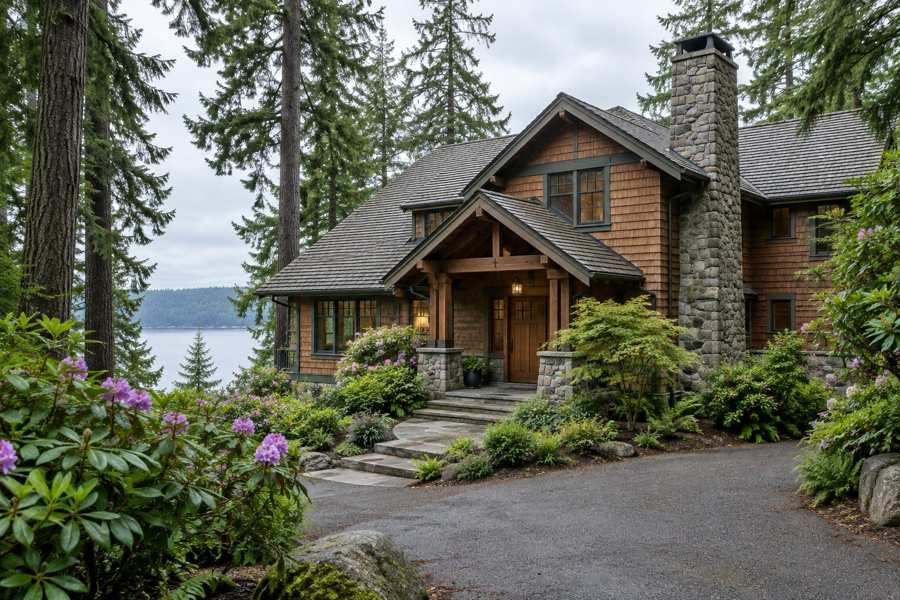
How long does a Lake Oswego home take to sell? Zillow says homes go to pending in around 15 days. Redfin says they sell in about 27 days, down from 33 a year ago. Realtor.com says the median listing has been on the market for 62 days. The three figures are from the same year and the same city, and the longest is four times the shortest.
The prices disagree as well. Zillow's page shows an average home value of $894,142, down 0.2% on the year. Redfin's median sale price for the three months to August is $1,049,306, up 11.3%. Realtor.com has a median sold price of $1,020,000, up 2.10%, and a median listing price of $1,085,750, down 11.45%. The Census figure for owner-estimated value, $1,047,500, sits within $1,806 of Redfin's median.
This brief reads the three pages with the Census profile of the postal area that includes Lake Oswego and a Realtor.com series for the Portland area. It asks why three clocks can differ so much, what a rise of 838% in rentals means, and what the pages say a seller faces. It then sets out what a private sale changes.
Key Findings
- Zillow reported an average Lake Oswego home value of $894,142, down 0.2% over the past year, with homes going to pending in around 15 days; the page text carries an update date of April 30, 2026 (Zillow, Lake Oswego).
- Redfin reported a Lake Oswego median sale price of $1,049,306 for the three months to August 2026 (up 11.3%), $386 per square foot (up 1.6%), 27 days on market against 33, 200 homes sold in August against 193 and an average of 2 offers per home, and called the market somewhat competitive (Redfin, Lake Oswego).
- Realtor.com reported a median listing price of $1,085,750 (down 11.45%), a median sold price of $1,020,000 (up 2.10%), $420 per square foot (down 3.44%), 370 active listings (up 7.28%), a median of 62 days on market (down 8.70%), 133 rental properties (up 838.10%) and a median rent of $2,288 a month (down 20.97%) (Realtor.com, Lake Oswego).
- In the Census postal area, 5,226 of 9,183 housing units (56.9%) were built before 1980, owners occupy 6,388 of 8,634 occupied homes (74.0%) and median household income is $149,236 (U.S. Census Bureau, 2020-2024).
- In the Portland-Vancouver-Hillsboro area the median days on market rose from 47 in May 2026 to 57 in July (Realtor.com, days on market).
Why do three pages give three waits?
Each page starts its clock at a different point and stops it at a different point. Zillow measures the time to pending, which is when a seller accepts an offer. Redfin measures days on market for homes that sold, and its page does not say whether the count stops at the contract or at the closing. Realtor.com's figure is for the listings that are currently for sale, which are the homes that have not sold, so it measures the wait so far of homes still waiting.
That last point explains much of the gap. A median of listings that are still active leans toward homes that have sat, because the homes that sold quickly have left the count. The figure of 62 days is the age of the unsold. The figures of 15 and 27 are the times of the sold. Both can be true at once, in a market where good homes go in two to four weeks and others sit for two months or more.
A seller should therefore ask which clock a page is using. For a well-priced home in a good position, 15 to 27 days is a fair expectation on these pages. For a home that is priced above the market, 62 days or more is the more likely wait, and the page for the region shows waits rising.
The Portland-Vancouver-Hillsboro series shows the median days on market at 49 in March, 47 in April and May, 51 in June and 57 in July, a rise of 10 days or 21% from May. Lake Oswego's pages do not show the same rise, but the direction in the region is a caution.
| Source | Wait | Price figure |
|---|---|---|
| Zillow | About 15 days to pending | Value $894,142 (down 0.2%) |
| Redfin | 27 days (33 a year earlier) | Median sale $1,049,306 (up 11.3%) |
| Realtor.com | 62 days for active listings (down 8.70%) | Median sold $1,020,000 (up 2.10%) |
Sources: Zillow, Redfin and Realtor.com pages and Realtor.com series on FRED as cited. The 21% figure is this brief's arithmetic. The explanation of the clocks is this brief's reasoning and not a finding of the pages. Commercial content; not independently verified.
Is Lake Oswego cool, balanced or a seller's market?
The Realtor.com page uses all three labels. Its hotness index calls the market cool, because homes sell in a median of 62 days. It calls the market balanced for August 2026, with a sale-to-list ratio of 100%. In a summary it describes a seller's market with a strong price anchor. It also says that a median wait down 8.70% means homes are selling faster than last year and buyers should be prepared to act quickly.
The figures on the same page are mixed. Active listings are 370, up 7.28% on the year and up 66.79% over three years. The median listing price is down 11.45%. The median sold price is up 2.10%. The price per square foot is down 3.44%. A market in which supply is up two thirds in three years and asking prices are falling is not a seller's market in the usual sense.
Redfin's page puts the market at somewhat competitive, with an average of two offers per home. Two offers per home is some competition, though not a contest.
The labels come from templates and the numbers come from the data, and where they differ a reader should trust the numbers. The numbers say that Lake Oswego has more homes for sale than it did three years ago, that asks are lower than a year ago and that sale prices are about level.
Sources: Realtor.com and Redfin pages as cited. Commercial content; not independently verified.
Which price should a Lake Oswego owner start from?
The spread is smaller than it looks if the Zillow figure is set aside. Redfin's $1,049,306, Realtor.com's $1,020,000 and the Census owner estimate of $1,047,500 lie within $29,306 of each other, or 2.9%. Three sources that agree within 3% are better evidence than one that stands apart, though the three are not independent, since owners may anchor on what neighbors report and sites may share data.
Zillow's $894,142 is $155,164 lower than Redfin's median, which is 17% of Zillow's own figure. It is also described as an average value, a different thing from a median sale, and the text on the page I read carries an update date of April 30, 2026, which is four months before the Redfin figure. A model value that is smoothed and older will sit below a recent sale median in a market with rising prices.
For a seller, a sensible starting point is the cluster near $1.02 million to $1.05 million, treated as the middle of what sold recently in the city as a whole. From there, the home's size, age, lot, condition and street move the figure. A house on the lake or with a view sells for more, and one needing work sells for less, and none of these pages says by how much.
The cluster is not a promise. Redfin's change of 11.3% and Realtor.com's change of 2.10% disagree on the speed of growth, and a median of 200 sales in a month is still a median.
Sources: Redfin, Realtor.com, Zillow and U.S. Census Bureau as cited. The $29,306, 2.9%, $155,164 and 17% figures are this brief's arithmetic. Commercial content; not independently verified.
What do listings and sales add up to?
If the two counts are both right, Realtor.com's 370 active listings against Redfin's 200 sales in August would be about 1.85 months of supply. Months of supply divides the homes for sale by the number that sell in a month. The two numbers come from different sources, and they may count different homes, so this is a rough illustration and not a measurement.
The sold count is slightly higher than a year ago, 200 against 193, a rise of 3.6%. Listings are up 7.28%. Sales and listings are both up a little, and listings are up more. That is consistent with a market that is steady and a little more crowded.
A median sold price of $1,020,000 against a median listing price of $1,085,750 means that asks run 6.4% above sales. On a home listed at $1,085,750, a sale at the median would be $65,750 lower. The two medians are not for the same homes, so the gap is a rough guide to the distance between asking and selling.
The sale-to-list ratio of 100% on the page says that homes sold at the list price on average, which is hard to square with a gap of 6.4% between the medians. A ratio compares each home's sale with its own listing, while two medians compare two lists, so they can differ. For a seller, the safer expectation is that a well-priced home sells near its ask and that an overpriced one waits.
Sources: Realtor.com and Redfin pages as cited. The 1.85, 3.6%, 6.4% and $65,750 figures are this brief's arithmetic and illustrations. Commercial content; not independently verified.
What does the Census say about Lake Oswego homes?
The Census profile covers the postal area that includes Lake Oswego. It counts 21,331 people and 9,183 housing units, of which 8,634 are occupied and 549 are vacant, a vacancy rate of 6.0%. Owners live in 6,388 homes (74.0% of those occupied) and renters in 2,246 (26.0%). Median household income is $149,236 and median gross rent is $2,241 a month.
Owners estimate the median home at $1,047,500, with a margin of error of $58,392, or 5.6%. That is almost exactly Redfin's median sale price of $1,049,306, a difference of $1,806. It is 17% above Zillow's average value of $894,142 and 3% above the Realtor.com median sold price. The agreement between owners and Redfin is closer than that between any other pair of sources in this brief.
The homes are of the 1960s and 1970s. The median year built is 1977. The largest group, 1,828 homes (19.9%), dates from the 1970s, followed by 1,451 (15.8%) from the 1960s and 1,180 (12.8%) from the 1980s. In all, 5,226 homes, 56.9%, were built before 1980. Only 949 homes, 10.3%, were built since 2010.
Homes of the 1960s and 1970s in the Pacific Northwest have their own points. Roofs of that age have been replaced, original windows may be single pane, and crawl spaces, drainage and the condition of older wood siding are matters for an inspector. The sources here do not give the condition of Lake Oswego homes, and I do not estimate costs.
| Indicator | Value | Note |
|---|---|---|
| Population | 21,331 | Whole postal area |
| Housing units | 9,183 | All units |
| Built before 1980 | 5,226 | 56.9% of all units |
| Owner-occupied homes | 6,388 | 74.0% of occupied |
| Median household income | $149,236 | Estimate |
| Median gross rent | $2,241 | Per month |
| Owner-estimated median value | $1,047,500 | Margin of error $58,392 |
| Median year built | 1977 | Estimate |
Source: U.S. Census Bureau, American Community Survey 2020-2024 five-year estimates. The 17%, 3%, 949 and 10.3% figures are this brief's arithmetic.
What should a seller of a 1970s house expect from a buyer's inspector?
In the postal area, 1,828 homes (19.9%) were built in the 1970s and 1,451 (15.8%) in the 1960s, so 3,279 homes, 35.7%, come from those two decades. A house of that age is old enough to have had its first major repairs and young enough that many owners think of it as modern. A buyer's inspector does not make that distinction.
The report on such a house may list the age of the roof and the heating system, the type of windows, the wiring and panel, the water heater and the state of the crawl space and the drainage around the foundation. In a wet climate, moisture in crawl spaces and under decks is a common item. The sources here do not measure how often these appear in Lake Oswego, and I do not estimate costs.
What matters to a seller is the sequence. The buyer's offer is made, the inspection follows, and the findings become a request for a credit, a repair or a lower price. The seller who gets this request after weeks of showings has little room, because the home is under contract and the next buyer would face the same report.
A seller who sells to a buyer who takes the house as it is avoids the sequence. The price already reflects the condition, and the sale does not depend on a report.
Source: U.S. Census Bureau as cited. The 3,279 and 35.7% figures are this brief's arithmetic. The points about inspections are this brief's general reasoning and not findings about Lake Oswego homes.
What does a rental count up 838 percent mean?
The Realtor.com page reports 133 rental properties in Lake Oswego, up 838.10% on the year and up 2,088.89% on three years. A rise of 838% means that a year earlier there were about 14, and a rise of nearly 2,100% means there were about 6 three years ago. Median rent is $2,288 a month, down 20.97%.
These are very small bases. A count of 14 a year ago is not a stable figure, and a jump to 133 says that many more homes were listed for rent in the last year, whatever the cause. A fall of a fifth in the median rent fits a rise in supply of that size, since landlords who compete for tenants cut their asking rents.
A year of rent at $2,288 is $27,456. Against the sold median of $1,020,000 that is 2.7% a year before taxes, insurance, repairs, vacancy and management. The Census median rent for the postal area is $2,241, so the page's figure is 2% higher. A gross return of 2.7% is thin, and the sources here give no costs of ownership for Lake Oswego, so I make no estimate of the net.
What the rental surge may signal is that some owners have decided to rent rather than sell. That is a choice that makes sense when a sale looks poor, and it carries the work of a landlord. For an owner who does not want that work, a direct sale offers a way out.
Sources: Realtor.com page and U.S. Census Bureau as cited. The 14, 6, $27,456, 2.7% and 2% figures are this brief's arithmetic. Commercial content; not independently verified.
What does the Portland series say about the climate?
The Portland-Vancouver-Hillsboro series from Realtor.com, published by the Federal Reserve Bank of St. Louis, covers a large region whose median listing price is near $595,000, much lower than Lake Oswego's $1,085,750. It cannot describe the city. It can show the direction.
Active listings in the region rose from 7,724 in May to 8,281 in June, 8,759 in July, 8,935 in August and 8,984 in September, a rise of 16% (Realtor.com, active listings). New listings fell from 3,924 in May to 2,968 in August, a fall of 24%. Listings with a price reduction rose from 2,486 in February to 4,264 in June (Realtor.com, price reduced listings), an increase of 72%. In June that was about 51% of the 8,281 active listings, if the two series count the same homes.
More homes for sale, fewer new ones arriving, a longer wait and half of listings carrying a cut is the shape of a region in which sellers who price high are made to wait. Lake Oswego's own pages give a mixed picture, and the region is a reason for care. Readers comparing markets can also read the Bend brief and the Bend brief.
Sources: Realtor.com series on FRED as cited. The 16%, 24%, 72% and 51% figures are this brief's arithmetic and assume that the two series count the same homes. Commercial content; not independently verified.
What does a private sale change in a lake town?
Privacy is the first change. A listing in a town of this size puts the house, its photographs and its price before neighbors and the wider community, and the days on market become public. A private sale involves no showings and no talk among neighbors about the sale.
A flexible closing date is the second. An owner who is moving to another state, downsizing or settling an estate can set the date. No commission and no closing costs are the third and fourth. On a home at $1,020,000, each 1% is $10,200, and I do not state a rate because no source here gives one.
Avoiding inspections and repairs is the fifth, and in a postal area where 56.9% of homes predate 1980 it carries weight. A buyer who purchases as is does not send an inspector, and the seller does not credit or repair anything.
A public listing can still produce a good price for a well-kept home in a strong position, where Redfin reports an average of two offers. The pages above do not rule that out. They show three clocks that differ by a factor of four, a price that depends on the page and a region in which waits and cuts are rising.
Before choosing, an owner can ask three questions of any buyer or agent. Which clock does your wait figure use, to pending, to closing or for homes still listed? Which sales are behind the price you quote, with addresses and dates? And what will I receive at closing after every charge? In a city where the same year yields waits of 15, 27 and 62 days, answers to those questions are firmer than any page, and a seller who has them in writing can compare a private offer with a listing on equal terms.
It also helps to consider timing. The regional wait rose from 47 days in May to 57 in July, and listings and cuts have been rising. A seller who plans to list next spring should expect conditions at least as slow as today's, and may value an offer that can close on a date already chosen.
Sources: Redfin, Realtor.com and U.S. Census Bureau as cited. The $10,200 figure is this brief's arithmetic for 1% of $1,020,000. The reasoning about owners is this brief's and not a measured finding.
Methodology and limitations
Values, prices, price per square foot, days on market, listing counts, sale-to-list ratio and rents for Lake Oswego come from three commercial pages: two national home sites and a national brokerage. They measure different things and were not independently verified. The Zillow page text carries an update date of April 30, 2026.
Age, tenure, vacancy, income, rent and owner-estimated value come from the American Community Survey 2020-2024 five-year estimates for the postal-code area that includes Lake Oswego. Shares are calculated from published counts, and owner-estimated value carries a margin of error.
Days on market, active and new listings, median listing price and price reduced counts are Realtor.com series published by the Federal Reserve Bank of St. Louis for the Portland-Vancouver-Hillsboro metropolitan area. They describe the region and not the city. The brief makes no forecast and values no home.
Conclusion
The Lake Oswego record shows three waits of 15, 27 and 62 days, a value, a sale median and a listing median that move in different directions, a rental count that rose more than eightfold and a region in which listings and cuts are rising.
It does not fix a price for any one home. The choice between a public listing and a private sale comes down to whether an owner would rather compete in that market or take privacy, a flexible closing date, no commission, no closing costs and no inspections or repairs. To see what a direct offer would look like for your home, use the contact form on this page.
Frequently Asked Questions
What is the median home price in Lake Oswego?
Redfin reports $1,049,306 for three months to August 2026, Realtor.com $1,020,000 as the median sold price, and Zillow an average value of $894,142.
How long do Lake Oswego homes take to sell?
Zillow says about 15 days to pending, Redfin 27 days and Realtor.com 62 days for active listings, because each measures a different clock.
Is Lake Oswego a seller's market?
Realtor.com labels it cool, balanced and a seller's market on one page, while its supply is up two thirds in three years.
Does the Portland data describe Lake Oswego?
No. It covers a large region with a median listing price near $595,000 and shows direction only.
Does a private sale always beat a public listing?
No. A public listing can attract competing bids. A private sale offers privacy, a flexible closing date, no commission, no closing costs and no inspections or repairs.
Compare your options before committing. Request a written private offer for your property, with no obligation, then weigh it against your listing plan.
Sources
- Zillow, 2026. Lake Oswego, OR Housing Market. https://www.zillow.com/home-values/5504/lake-oswego-or/.
- Redfin, 2026. Lake Oswego Housing Market Trends. https://www.redfin.com/city/30777/OR/Lake-Oswego/housing-market.
- Realtor.com, 2026. Lake Oswego, OR Housing Market and Rental Trends. https://www.realtor.com/local/market/oregon/clackamas-county/lake-oswego.
- U.S. Census Bureau, 2026. American Community Survey 2020-2024 five-year estimates, the Lake Oswego area (via Census Reporter). https://censusreporter.org/profiles/86000US97034-97034/.
- Realtor.com, 2026. Housing Inventory: Median Days on Market in Portland-Vancouver-Hillsboro, OR-WA (CBSA). https://fred.stlouisfed.org/series/MEDDAYONMAR38900.
- Realtor.com, 2026. Housing Inventory: Active Listing Count in Portland-Vancouver-Hillsboro, OR-WA (CBSA). https://fred.stlouisfed.org/series/ACTLISCOU38900.
- Realtor.com, 2026. Housing Inventory: Price Reduced Count in Portland-Vancouver-Hillsboro, OR-WA (CBSA). https://fred.stlouisfed.org/series/PRIREDCOU38900.
Related research

Seller Guide · October 6, 2026
How to Prepare Point Pleasant Beach Rental Records Before Selling
Separate rental approval, income history and booked stays before comparing sale terms.

Seller Guide · October 6, 2026
How to Prepare Rumson Flood and Waterfront Records Before Selling
Separate flood disclosure, elevation, repairs and waterfront rights before comparing sale terms.

Seller Guide · October 6, 2026
How to Prepare Sarasota Condo Inspection and Reserve Records Before Selling
Separate building condition, reserve funding and resale documents before comparing sale terms.