Market Brief · by Aidan Sowa · October 5, 2026
Why Do San Carlos Homes Sell Above Asking on One Page and At Asking on Another? Reading the Older Homes, the High Incomes and the Missing Census Value
Reading the Older Homes, the High Incomes and the Missing Census Value for San Carlos, CA, with each source dated and its limits noted, for owners weighing a listing against a direct sale.
Why do San Carlos homes sell above asking on one page and at asking on another? Redfin's page for the postal area that includes San Carlos reports March 2026, with a sale-to-list ratio of 104.2% and 53.3% of homes sold above list. Realtor.com's page, with key indicators as of September 2026, shows a sale-to-list ratio of 100% and a median listing price of $1,824,500, down 5.51% in a year. The pages are six months apart, and the difference may be a matter of timing.
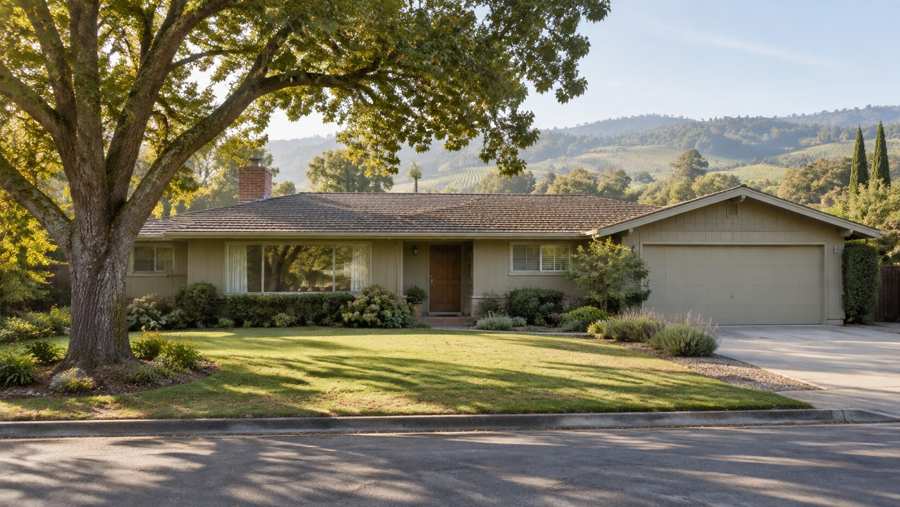
The Census shows a place of older homes and high incomes. Of 11,905 housing units, 9,068, or 76.2%, were built before 1980, and 6,502 were built in the 1940s, 1950s and 1960s. Of 11,279 occupied homes, 7,742, or 68.6%, are owned and 3,537, or 31.4%, are rented. Detached houses are 8,047 of the units, 67.6%. The median household income is $240,074, plus or minus $16,440.
Maison Off-Market speaks only to sellers, and this brief is for an owner in San Carlos. Every figure is dated and linked, every ratio is computed here from the published figures, and where a source is dated, conflicting or implausible the brief says so. Nothing here says that a private sale always beats a public listing.
Key Findings
- Redfin's page reports March 2026, a single month six months before the Realtor.com page, so it is the older of the two and is dated. It shows a median sale price of $2,750,000, up 7.5%, a median sale price per square foot of $1,360, up 8.6%, 60 homes sold, up from 54, a median of 12 days on the market against 13, a sale-to-list ratio of 104.2%, down 2.5 points, and 53.3% of homes sold above list, down 11.5 points (Redfin, San Carlos postal area).
- Realtor.com's page, with key indicators as of September 2026 and changes shown against the month before and a year before, shows a median listing price of $1,824,500, down 5.36% and 5.51%, a median sold price of $2,428,444, up 0.45% and 20.22%, $1,088 per square foot, up 0.72% and 2.11%, 54 active listings, up 9.23% and 4.41%, a median of 26 days on the market, down 16.67% and 19.36%, and a median rent of $5,360 a month, up 19.11% and 28.85% (Realtor.com, San Carlos postal area).
- No Zillow home values page for the postal area could be found. The only Zillow page returned was for the city as a whole, so no Zillow figure is used.
- In the Census postal area, 11,905 housing units were counted, 11,279 occupied, 7,742 by owners and 3,537 by renters, and 626 vacant. The median build year is 1962, the median household income is $240,074, plus or minus $16,440, and the median gross rent is $2,854, plus or minus $128. The median owner value is reported only as a top-coded figure of $2,000,001 or more, and is not used.
- The picture is a postal area of mid-century houses, where Redfin's older page shows competition and Realtor.com's newer page shows sales at about the asking price, and where the pages disagree about the level of prices by more than a tenth.
Which San Carlos price figure should an owner trust?
The pages disagree, and the dates explain some of it. Redfin's median of $2,750,000 for March 2026, up 7.5%, implies about $2,558,140 a year before. Realtor.com's sold median of $2,428,444 for September 2026, up 20.22% in a year, implies about $2,020,000 a year earlier. The Redfin figure is 13.2% above the Realtor.com sold median. Part of the gap is the six months between them, and part is that a single month in a postal area with about sixty sales a month is a small sample.
Realtor.com's own medians do not agree. The sold median is 33.1% above the listing median on the same page, and it is up 20.22% in a year while the listing median is down 5.51%. At $1,824,500, the listing median implies about $1,927,832 the month before, and about $1,930,892 a year earlier. The sold median, up 0.45% in a month, implies about $2,417,565 the month before. Sold homes in a high-priced postal area tend to be larger and better than the typical listing, but that is an inference and the page does not say so.
Per-foot prices show the gap between the pages. Redfin's $1,360 for March 2026, up 8.6%, implies about $1,252 a year before. Realtor.com's $1,088, up 2.11% in a year, implies about $1,066 a year earlier, and up 0.72% in a month implies about $1,080. The Redfin figure is 25.0% above the Realtor.com figure. The pages may measure different sets of homes, with Redfin counting sales and Realtor.com counting listings.
The Census median owner value is top-coded at $2,000,001 or more, which means that at least half of owner-occupied homes are valued above that figure, and it is not used as a median. That fact is itself a guide to the price level. A cap at this height tells an owner that the Census cannot describe the upper half of the market, and that the sold and listing medians above are the better guide.
The median household income of $240,074, plus or minus $16,440, is high. The Realtor.com sold median is 10.1 times that income, and the Redfin sold median is 11.5 times it. The best guide to a single home is closed sales of similar homes of the same type and age, in the last few months, set next to the homes now listed.
Owners comparing a listing with a direct offer should keep two questions apart. The first is what the typical home in the postal area sells for, which the pages answer with figures from about $1.8 million to $2.75 million depending on the source and the measure. The second is what a particular home would bring, which depends on its type, size, age, condition and lot, and only the closed sales of the most similar homes can answer it. A mid-century house on a large lot and a smaller home nearby can differ by a wide margin.
| Source | Figure | What it measures |
|---|---|---|
| Realtor.com | $1,824,500, down 5.51% | Median listing price, September 2026 |
| Realtor.com | $2,428,444, up 20.22% | Median sold price, September 2026 |
| Redfin | $2,750,000, up 7.5% | Median sale price, March 2026 (dated) |
Sources as cited. Ratios and earlier values in this section are computed from the published figures and percentages.
How fast do San Carlos homes sell, and what do sellers get against asking?
Fast. Realtor.com shows a median of 26 days on the market, down 16.67% in a month, which implies about 31 days the month before, and down 19.36% in a year, which implies about 32 days a year earlier. Redfin's March 2026 page shows a median of 12 days against 13 a year before, and says the average home goes pending in around 12 days and hot homes in around 8 days. The six months between the pages and the different measures account for the gap between 12 and 26 days.
Sales settle at or above asking, depending on the page. Realtor.com puts the sale-to-list ratio at 100%, and says homes sold for approximately the asking price in September 2026. Redfin's March 2026 ratio was 104.2%, down 2.5 points, which implies about 106.7% a year before, and it says the average home sells for about 5% above list and hot homes for about 13% above. Homes sold above list were 53.3% of March sales, down 11.5 points, which implies about 64.8% a year before. Redfin's compete score is 71 of 100, which it calls very competitive, with an average of 6 offers per home.
The two pages describe a market that cooled between March and September, or one that is measured differently, and the pages alone cannot say which. Realtor.com calls the area warm and a seller's market, in which homes sell in a median of 26 days. Supply is small. It shows 54 active listings, up 4.41% on the year, which implies about 52 a year earlier, and up 9.23% on the month, which implies about 49. Redfin shows 60 homes sold in March, up 11.1% from 54, which agrees with the arithmetic.
Rentals are few. Realtor.com shows 16 rental properties, down 33.33% on the month and down 47.37% on the year, which implies about 24 the month before and about 30 a year earlier. The median rent of $5,360 is up 19.11% on the month, which implies about $4,500, and up 28.85% on the year, which implies about $4,160. Rent changes of that size, from a sample of 16 listings, are flagged as volatile. The Census median gross rent of $2,854, plus or minus $128, is far below the Realtor.com figure, which is 87.8% above it, and the two cover different groups.
A fast market with sales at about the asking price rewards a price set close to recent sales of comparable homes. In a market this quick, a price set too high costs little in the first week and more after it, because the days on a listing are counted from the start.
A median of 12 days, or 26 days, is an average, and the spread around it matters to a seller with a fixed date. Some homes sell in days, and others sit for weeks and then cut their price. The pages report medians and not the spread, so an owner who needs to close by a given date can ask for the days on market of homes sold in the last few months, which gives a better guide to the risk of a long wait than the postal area median.
Sources as cited. Earlier values and differences are computed from the published percentages.
Who lives in San Carlos, and how heavy is the cost of housing?
Owners are two thirds of households. Of 11,279 occupied homes, 7,742 are owner-occupied, 68.6%, and 3,537 are renter-occupied, 31.4%. Of 11,905 units, 626 are vacant, 5.3%, including 310 for rent, 57 for sale only, 16 rented and not yet occupied, 105 for seasonal, recreational or occasional use, and 138 other vacant units.
Owners have mostly been in place a while. Of 7,742 owner households, 147 moved in during 2023 or later, 1.9%, 723 between 2020 and 2022, 9.3%, 2,450 in the 2010s, 31.6%, 1,806 in the 2000s, 23.3%, 1,185 in the 1990s, 15.3%, and 1,431 before 1990, 18.5%. Owners who moved in before 2010 are 57.1%. Renters are newer: of 3,537, 334 moved in during 2023 or later, 9.4%, 1,080 between 2020 and 2022, 30.5%, 1,666 in the 2010s, 47.1%, and 457 earlier, 12.9%.
The population is spread across ages. Of 30,447 people counted, 7,206 are under 18, 23.7%, 1,819 are 18 to 24, 6.0%, 2,893 are 25 to 34, 9.5%, 4,859 are 35 to 44, 16.0%, 8,692 are 45 to 64, 28.5%, and 4,978 are 65 or older, 16.3%. Owner homes lean to three and four bedrooms: of 7,742, 3,316 have three, 42.8%, 2,281 have four, 29.5%, 1,322 have two, 17.1%, 710 have five or more, 71 have one and 42 have none. Renter homes lean to two and one bedrooms: of 3,537, 1,378 have two, 39.0%, 1,093 have one, 30.9%, 631 have three, 281 have none, 117 have four and 37 have five or more.
Owners with a mortgage carry a real burden. Of 7,742 owners, 5,624 have a mortgage, 72.6%, and 2,118 do not, 27.4%. Among the 5,616 mortgage holders with a computed figure, 1,385 spent 30% or more of income on housing costs, 24.7%, and 622 spent 50% or more, 11.1%. Among the 2,113 owners without a mortgage and with a computed figure, 209 spent 30% or more, 9.9%, and 105 spent 50% or more, 5.0%. Mortgage holders are therefore far more likely to be stretched than owners without a mortgage.
Renters carry a heavier burden. Of 3,537 renters, 3,377 with a computed figure, 1,279 spent 30% or more of income on rent, 37.9%, and 626 spent 50% or more, 18.5%. About three renter households in eight are above the 30% mark, and about one in five is above 50%. An owner who rents out a home is dealing with tenants who are often stretched, which matters to anyone comparing a rental income with a sale.
Source: U.S. Census Bureau, American Community Survey 2020-2024 five-year estimates, tables B01001, B25003, B25004, B25038, B25042, B25070 and B25091, via Census Reporter. Shares are computed here.
How old is the San Carlos stock, and what does that mean for inspections?
Most of it was built before 1980. Of 11,905 units, 900, or 7.6%, were built before 1940, 2,217, or 18.6%, in the 1940s, 2,461, or 20.7%, in the 1950s, 1,824, or 15.3%, in the 1960s, 1,666, or 14.0%, in the 1970s, and 1,377, or 11.6%, in the 1980s. After that, 343, or 2.9%, were built in the 1990s, 402, or 3.4%, in the 2000s, 507, or 4.3%, in the 2010s and 208, or 1.7%, in 2020 or later. Homes built before 1980 total 9,068, or 76.2%, and the 1940s, 1950s and 1960s alone hold 6,502, or 54.6%.
The building types lean to detached houses. Of 11,905 units, 8,047 are detached, 67.6%, 511 are attached, 4.3%, 121 are in two-unit buildings, 312 are in buildings of three or four units, 839 in buildings of 5 to 9, 926 in buildings of 10 to 19, 741 in buildings of 20 to 49 and 408 in buildings of 50 or more. Buildings of five or more units hold 2,914, or 24.5%. There are no mobile homes counted.
A house built in the 1940s, 1950s or 1960s is now sixty to eighty years old. Roofs, windows, heating systems, wiring, plumbing and drains may all be near the end of their lives unless they have been replaced, and a buyer's inspector will note each item. The sources do not say which items apply to any home. These are general points and not figures from the sources.
In a market where homes sell in days and a large share sell above asking, the inspection is one of the few places where a buyer can ask for a price cut, and repair requests can reduce the final price. A seller can address them before listing, which costs money and time, or sell to a buyer who takes the home as it stands.
A seller who would rather not have an inspector's list negotiated can choose a private sale, in which a buyer buys the home as it stands. That is the fifth benefit of Maison Off-Market, avoiding inspections and repairs, and it is not a claim that a private sale always yields a higher price.
Age also affects what a buyer will accept. A home built before 1960 may have its original layout, and a buyer may plan to renovate or to rebuild. The sources give no figures for renovation or rebuilding in the postal area, so that is a general point. What the Census does show is that only 1,460 of the 11,905 units were built from the 1990s on, so newer comparable sales are few, and a seller of an older home should look for sales of homes of similar age. Readers comparing markets can also read the Huntington Beach brief and the Santa Rosa brief.
Source: U.S. Census Bureau, American Community Survey 2020-2024 five-year estimates, tables B25024, B25034 and B25042, via Census Reporter. Shares are computed here.
What should a San Carlos owner ask before choosing a listing or a private sale?
Five questions are worth asking. Is my price based on closed sales of homes like mine, of the same type, size and age, and not on one median? How many weeks might a listing take, and how far above or below the first ask are sales settling? What will inspections and repairs cost me on a home of this age? Who will see the home during showings, and who will hear about the sale? And what date do I need to close, given where I plan to live next?
Fees are simple arithmetic, and no rate is assumed here. Each 1% of a $1,200,000 sale is $12,000, of a $2,000,000 sale is $20,000, and of a $3,000,000 sale is $30,000. At 3%, those sales cost $36,000, $60,000 and $90,000, and at 5% they cost $60,000, $100,000 and $150,000. At the Realtor.com sold median of $2,428,444, 1% is $24,284 and 5% is $121,422. Maison Off-Market does not charge commissions or closing costs.
A private sale has no showings and no neighbors talking about it, which is the first benefit. The second benefit is a closing date the owner can set, which gives time to find a new home. The third is no commission costs, the fourth is no closing costs and the fifth is avoiding inspections and repairs. In a market where homes sell in days, a listing can work well, and an owner may still value a sale that does not depend on showings.
A fair comparison puts the commission, the closing costs, the repairs a buyer may ask for, the weeks of carrying costs and the preparation for showings next to the privacy given up. It also puts a realistic listing result, and not the best case, next to a direct offer. In a quick market the realistic listing result may be good, and an owner is right to ask for both and compare.
Maison Off-Market buys luxury homes and estates directly from their owners and speaks only to sellers. It does not say that every private sale beats a listing. An owner who wants to see what a direct purchase would look like, with no public listing and no showings, can use the contact form below and ask for an offer before deciding.
Sources as cited. Fee illustrations are arithmetic only and assume no commission rate.
Methodology and limitations
Each page's date, title and place were read before use. The Redfin page reports March 2026, a single month, and is the older of the two, and the Realtor.com page has key indicators as of September 2026 and is the newest, so the pages are six months apart. The Realtor.com sold median, up 20.22% in a year while its listing median is down 5.51%, does not fit its own listing median and is flagged as probably reflecting the mix of homes sold. The Realtor.com rent change, up 28.85% in a year from a sample of 16 rental listings, is flagged as volatile. The Census median owner value is top-coded and is not used. No Zillow postal-area page was found, so no Zillow figure is used. The Realtor.com neighborhood tables list other places and were not relied on. The Census figures are five-year survey estimates with margins of error. Earlier values are computed from published percentages and are approximate. No figure here is a forecast.
Conclusion
The record for San Carlos, as far as the pages allow, is a fast market where sales settled at or above asking, with a March page showing competition and a September page showing sales at about the asking price, where the sold median is hard to reconcile with the listing median, and where three quarters of the homes were built before 1980. For an owner, the practical step is to ask for the closed sales of comparable homes of the same type, compare the cost and risk of a listing with a direct offer, and decide how much of the showing, inspection and timing risk to carry.
Frequently Asked Questions
What is the median home price in San Carlos?
Realtor.com showed a median sold price of $2,428,444 and a median listing price of $1,824,500 for September 2026. A Redfin page for March 2026 showed a median sale price of $2,750,000.
How long do San Carlos homes take to sell?
Realtor.com showed a median of 26 days for September 2026. A Redfin page for March 2026 showed a median of 12 days.
Do San Carlos homes sell above asking?
Many did in March 2026. Redfin showed 53.3% of homes sold above list and a sale-to-list ratio of 104.2%, and Realtor.com showed a ratio of 100% for September 2026.
How old are San Carlos homes?
The Census counts 9,068 of 11,905 housing units in the postal area, 76.2%, as built before 1980.
Can I sell my San Carlos home privately?
Yes. Maison Off-Market buys luxury homes and estates directly from their owners with no showings, flexible closing dates, no commission costs, no closing costs and no inspections or repairs. It does not say a private sale always beats a listing.
Compare your options before committing. Request a written private offer for your property, with no obligation, then weigh it against your listing plan.
Sources
- Redfin, postal area housing market, 2026. Housing Market Trends. https://www.redfin.com/zipcode/94070/housing-market.
- Realtor.com, postal area housing market, 2026. Housing Market Data. https://www.realtor.com/local/market/california/zipcode-94070.
Related research

Seller Guide · October 6, 2026
How to Prepare Point Pleasant Beach Rental Records Before Selling
Separate rental approval, income history and booked stays before comparing sale terms.

Seller Guide · October 6, 2026
How to Prepare Rumson Flood and Waterfront Records Before Selling
Separate flood disclosure, elevation, repairs and waterfront rights before comparing sale terms.

Seller Guide · October 6, 2026
How to Prepare Sarasota Condo Inspection and Reserve Records Before Selling
Separate building condition, reserve funding and resale documents before comparing sale terms.