Data Report · by Aidan Sowa · October 5, 2026
Does a Dated Santa Rosa House Still Sell Without Repairs? Reading the Age Tables, the Price Cuts and the Days on Market
Reading the Age Tables, the Price Cuts and the Days on Market for Santa Rosa, CA, with each source dated and its limits noted, for owners weighing a listing against a direct sale.
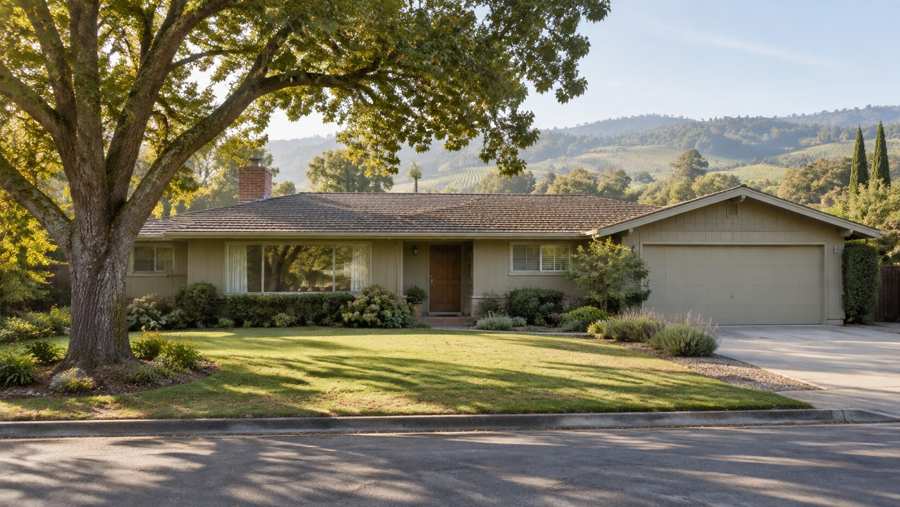
An owner in this part of Santa Rosa who asks whether a worn house will sell untouched is asking two separate questions: how many other homes look like theirs, and how hard the buyers around them are pushing back on price. The first has a clean answer. Of 16,861 housing units in the area, 10,039 (59.5%) were built before 1980, and the median year built is 1973 (U.S. Census Bureau, 2020-2024). A home with a 1960s roofline is the ordinary house here, not the exception.
The second question is harder, because no public source reports condition or days on market for one small area. The closest public series cover the Santa Rosa-Petaluma metropolitan area. In September 2026 the area had 1,169 active listings, 388 of them with a price reduction, and the median listing had been up for 55 days (Realtor.com, 2026). This report sets those figures side by side and says plainly where they stop being able to speak for a single street.
Key Findings
- The Santa Rosa study area has 16,861 housing units. 10,039 (59.5%) were built before 1980 and 3,758 (22.3%) before 1950.
- The median owner-estimated home value is $903,900, with a margin of error of plus or minus $20,647. 60.9% of occupied homes are owner-occupied.
- In September 2026, 388 of 1,169 active listings in the Santa Rosa-Petaluma area (33.2%) carried a price reduction, down from 36.3% a year earlier.
- The median listing sat 55 days in September 2026, against 63 a year earlier. The 2026 high was 87 days in January (Realtor.com, days on market, 2026).
- The median list price was $908,500, down 6.8% from $974,500 in September 2025 and 20.9% below its April 2023 peak of $1,149,000 (Realtor.com, list price, 2026).
How old are the homes in the Santa Rosa area?
Age is the one condition fact the Census does publish for small areas. Its five-year estimates count housing units by the decade they were built, and for this part of Santa Rosa the distribution is lopsided toward the early postwar years. The pre-1950 group is the single largest bar, at 3,758 units. The 1950s, 1960s and 1970s add 1,897, 1,915 and 2,469. Together those four groups make up 10,039 of 16,861 units.
Age is not condition. A 1962 house with a new roof is in better shape than a 1998 house nobody has maintained. What age does tell an owner is how a buyer will read the listing. Where six in ten homes are old, buyers expect to see old systems, and a seller who lists a dated house is competing against many similar ones, not against a market of new construction.
Source: U.S. Census Bureau, American Community Survey 2020-2024 five-year estimates, tables B25034 and B25077, the postal-code area studied in Santa Rosa.
What does the value estimate say, and how much should an owner trust it?
The same survey asks owners to estimate what their home would sell for. In this part of Santa Rosa the median answer is $903,900. The survey publishes a margin of error, and here it is plus or minus $20,647, about 2.3% of the estimate. That is tight for a small area, which reflects a large sample of 9,430 owner-occupied homes.
Two cautions apply. Owners tend to answer from memory of past sales, so the figure lags a falling market. And the median describes all owner homes together. A house that needs a roof and a kitchen belongs below the middle of that range, and nothing in the table says by how much. The sensible reading is a ceiling for a clean, updated house, not a price for yours.
How many nearby listings have already cut their price?
Realtor.com counts the active listings that carry at least one price reduction. For the Santa Rosa-Petaluma area that count was 388 in September 2026, out of 1,169 active listings, or 33.2%. A year earlier the figures were 450 of 1,240, or 36.3%. Three years earlier they were 276 of 762, or 36.2%.
So roughly one listing in three has needed a cut in each of the last three Septembers. The share has eased slightly this year, but the pattern is stable enough to plan around. A seller pricing at the top of the range should treat a first reduction as a normal event in this market, not as a sign that something is wrong with the house.
Source: Realtor.com via FRED, Housing Inventory: Price Reduced Count and Active Listing Count, Santa Rosa, CA (CBSA).
How long does a Santa Rosa-area listing take to sell?
The median listing in the area had been on the market 55 days in September 2026. A year earlier it was 63. Three years earlier it was 46, and the fastest reading in the last five years was 30 days, in April 2024. The slowest of 2026 so far was January, at 87 days.
Those swings are large, and they follow the calendar as much as the house. A seller who lists in January should expect a different clock than one who lists in the spring. The figure also counts only homes that were listed. Time spent preparing a house for the market, and the weeks between accepting an offer and closing, sit outside it.
Is it often said that an older house always sells slower?
It may be true, but the public data neither confirm it nor refute it. No open series splits days on market by year built for one small area, so anyone quoting a precise penalty for old houses in this part of Santa Rosa is working from a private dataset or from a guess.
What the data do show is how much the clock moves for reasons unrelated to age: 30 days in one spring, 87 in one winter, in the same metropolitan area. If seasonal timing can move a listing by two months, then a vague belief about age is a weak basis for deciding to spend money on repairs. The better test is a specific one. Ask what a particular repair would add to the price a buyer pays, and compare that with its cost.
What has the price index done over five years?
The Federal Housing Finance Agency publishes an all-transactions price index for the Santa Rosa-Petaluma area. It stood at 422.74 in the second quarter of 2026. That is 0.8% above the second quarter of 2025 (419.42) and 17.6% above the second quarter of 2021 (359.57) (FHFA, price index, 2026).
This index tracks repeat sales and appraisals, so it moves more slowly than list prices. It describes the long climb. The list-price series describes the last year, when asking prices fell 6.8%. Both can be true together: values rose over five years while sellers today are asking for less than they asked in 2025. An owner anchoring on the 2023 peak of $1,149,000 is anchoring on a price the market no longer pays.
Source: U.S. Federal Housing Finance Agency, All-Transactions House Price Index for the Santa Rosa-Petaluma, CA (MSA), index 1995 Q1 = 100.
Who lives in the homes: owners, renters or no one?
The survey finds 15,478 occupied homes in this part of Santa Rosa out of 16,861 units. The 1,383 units left over, 8.2% of the total, are vacant, which includes homes for sale, homes for rent and homes held for seasonal or other use. Of the occupied homes, 9,430 (60.9%) are owned and 6,048 (39.1%) are rented.
The mix matters because it shapes who a seller meets. An area that is four-tenths rental has a deep pool of people who may want to buy their first home, and also a share of older houses that have been run as rentals and show their wear. An owner who has lived in the house for decades is in a different position from a landlord, and a buyer who plans to renovate is a different customer from one who wants to move in this month.
Do new listings and the price per square foot add anything?
Two more Realtor.com series fill in the picture. New listings in the Santa Rosa-Petaluma area numbered 510 in September 2026, against 516 a year earlier, 396 three years earlier and 624 five years earlier. The flow of homes coming to market is close to flat on the year and well below the 2022 peak of 670 in May (Realtor.com, new listings, 2026; Realtor.com, price per square foot, 2026).
The median list price per square foot was $539, down from $546 a year earlier. That is a fall of 1.3%, much smaller than the 6.8% fall in the median list price. The difference suggests that part of the drop in headline prices reflects which homes are being listed, with smaller or older homes making up more of the mix, rather than a fall in what each square foot is worth. A seller of a dated house should note that the smaller measure is the fairer one to compare.
Source: Realtor.com via FRED, Housing Inventory: New Listing Count and Median Listing Price per Square Feet in Santa Rosa, CA (CBSA).
How has each September compared since 2021?
A single month can mislead, so Table 1 lines up the September reading of each series for six years. The median list price rose from $875,000 in 2021 to $1,060,495 in 2023, a gain of 21.2%, and has since fallen to $908,500. That leaves 2026 only 3.8% above 2021. Active listings moved the other way for most of the period, rising from 744 to 1,169, or 57% (Realtor.com, price cuts, 2026; Realtor.com, days on market, 2026).
Read across the rows, the market loosened in steps. Price cuts, days on market and active listings all bottomed in 2021 to 2023 and have risen since. The 2024 column is the odd one: only 27.9% of listings had a cut that September, the lowest share in the table, with 975 active listings and a 54-day median. The following year the share jumped to 36.3%. An owner who watched the 2024 market and priced to it would have missed the change.
| September | Median list price | Active listings | With price cut | Median days on market |
|---|---|---|---|---|
| 2021 | $875,000 | 744 | 240 (32.3%) | 54 |
| 2022 | $940,500 | 718 | 274 (38.2%) | 57 |
| 2023 | $1,060,495 | 762 | 276 (36.2%) | 46 |
| 2024 | $1,049,249 | 975 | 272 (27.9%) | 54 |
| 2025 | $974,500 | 1,240 | 450 (36.3%) | 63 |
| 2026 | $908,500 | 1,169 | 388 (33.2%) | 55 |
What does the calendar do to a listing?
The median days on market for the area over the last thirteen months reads 63 in September 2025, 60 in October, 71 in November, 84 in December and 87 in January. It then drops to 52 in February, 39 in March, 37 in April and 40 in May, before climbing again to 49 in June, 53 in July and 55 in both August and September. The gap between the slowest and fastest months is 50 days.
Active listings follow a similar path. The count fell to 619 in January and rose to 1,169 by September, an 88.9% increase. The fall and winter months combine fewer buyers with fewer homes, and the spring brings both back. For a seller whose house needs work, the calendar can be as important as the condition. A dated house listed in March meets a market that sells in 37 days. The same house listed in December meets one that takes more than 80.
This does not mean every seller should wait for spring. Waiting costs months of carrying expense, and spring also brings the most competing listings. It does mean that a seller who has a choice should compare dates as well as prices.
What would a longer wait cost in dollars?
Arithmetic helps here, with an assumption the owner can replace. Suppose a seller still owes $300,000 at an interest rate of 4%. The interest alone is $1,000 per month, about $33 per day. A listing that sells in the March median of 37 days costs about $1,200 in interest. One that takes the December median of 84 days costs about $2,800. Add property taxes, insurance and utilities, and the gap widens. The assumptions are the author's, not data, and they are meant to be changed.
The cost that deserves more attention is the price cut. At the area median list price, a 5% cut is $45,425, and 33.2% of listings take one. If each cut were 5%, the expected cost averaged across sellers would be roughly $15,000 at that price, which is more than the interest on any plausible wait. This is the reason why the question to answer first is the price at which the house will sell, and the repair question comes second.
It also explains why some owners of older homes skip the listing period entirely. A private sale to a buyer who pays cash and accepts the condition removes the showing season, the repair list and the price-cut risk. In return, the seller usually accepts a price below the best retail outcome. Whether that trade is worth it depends on the numbers above, applied to the owner's own house and mortgage.
What can the data not tell a seller in Santa Rosa?
It cannot tell a seller what the house will sell for. The Census value is an estimate by owners, the list prices are asks, and the price index covers the whole metropolitan area. Only an appraisal, a comparable-sales review or an offer prices a particular house.
It cannot tell a seller about condition. A pre-1950 house with a rebuilt electrical panel and an intact foundation and a pre-1950 house with knob-and-tube wiring and a cracked foundation fall in the same Census row. Condition determines how much a buyer will deduct, and the deduction is where the real negotiation happens.
It cannot tell a seller about the street. Two blocks in the same area can differ in lot size, noise, flood exposure and school boundaries. Anyone using a small-area figure to price a house should treat it as a starting range and check the nearest sold homes before settling on a number.
Is Santa Rosa moving with California or apart from it?
The Federal Housing Finance Agency also publishes a statewide all-transactions index. California stood at 974.97 in the second quarter of 2026, up 0.9% from 966.27 a year earlier and 28.1% above its second-quarter 2021 level of 761.06. The Santa Rosa-Petaluma index rose 0.8% on the year and 17.6% over five years (FHFA, California index, 2026; FHFA, price index, 2026).
The one-year movements are almost identical, which says that Santa Rosa is not having a separate year. Over five years, the local index has risen about ten points less than the state's. That is the gap an owner should keep in mind when a relative quotes statewide gains. The state figure includes coastal and Bay Area markets that have climbed faster, and it is a poor yardstick for a house in this part of Santa Rosa.
The comparison is also a reminder of scale. A 17.6% gain over five years on a $903,900 home is about $135,000 of paper value, spread over a time in which an owner paid property tax, insurance and maintenance. Owners of older houses should subtract from that figure the repairs they have deferred, since those costs reduce what a buyer will pay when the time comes to sell.
Source: U.S. Federal Housing Finance Agency, All-Transactions House Price Index for California, index 1980 Q1 = 100.
How should an owner compare a listing outcome with a private offer?
A fair comparison puts both routes in net terms. For a listing, the owner starts with an expected sale price, subtracts the likely price cut, the cost of repairs the buyer will demand, the carrying costs for the listing period and the selling costs the owner's agent quotes in writing. For a private offer, the owner starts with the offer and subtracts whatever closing costs the contract assigns to the seller.
The Santa Rosa numbers give the first route a shape. At the area median list price of $908,500, a 5% reduction brings the price to $863,075. The Realtor.com series says one listing in three takes a cut, and the median listing takes 55 days. A private offer that equals the post-cut price, with no repairs and no wait, is the same money at lower risk. An offer well below it is not.
The point of the exercise is to replace a feeling with a break-even. The owner can write one line: the private offer must equal the expected listing price, less the expected cut, less repairs and carrying costs. If an offer clears that line, the choice is a matter of preference. If it does not, the listing deserves a try, and the owner can still sell privately later if the market gives no better result. Readers comparing markets can also read the Encino brief and the Truckee brief.
What does waiting cost a seller of a dated house?
Consider simple arithmetic at the area median list price of $908,500. A single 5% reduction removes $45,425. If one listing in three takes a cut, an owner who prices high and waits is accepting a one-in-three chance of losing roughly that sum, on top of the carrying costs for the 55 days the median listing needs. These numbers are illustrative, not a forecast (Realtor.com, price cuts, 2026; Realtor.com, list price, 2026).
Repairs follow the same logic. A repair is worth doing when the price buyers add for it exceeds its cost and the delay it causes. A new roof usually removes a buyer objection. A kitchen remodel usually costs more than the price premium it creates, though the data here cannot test that for a particular house. An owner who cannot fund or wait out the work has a third path: sell without repairs to a buyer who prices the condition in directly and does not need the house to show well.
Methodology and limitations
Housing age, tenure and value come from the American Community Survey 2020-2024 five-year file, tabulated for the postal-code area that covers part of Santa Rosa. These areas approximate postal delivery areas and do not match neighborhood or city boundaries. Home values are owner estimates with published margins of error.
Listing counts, price-cut counts and days on market come from Realtor.com and cover the Santa Rosa-Petaluma metropolitan area, not the area. Listing prices are asking prices, not sale prices. The price index is repeat-sale based and lags. None of these sources measures the physical condition of a house, and none reports sold prices for as-is sales.
Conclusion
For an owner in this part of Santa Rosa, the numbers support a narrow conclusion. Dated houses are the norm, a third of nearby listings need a price cut, and the time to sell swings widely with the season. They do not say that a house in poor repair will fail to sell. They say it will be priced against a market that has already moved down from its 2023 peak.
The decision comes down to cost and time: what a repair adds, what waiting costs, and how much of each the owner can carry.
Frequently Asked Questions
Does the 59.5% figure mean most houses in Santa Rosa need repairs?
No. It counts houses built before 1980. It says nothing about maintenance or updates since.
Why use metro-area listing data for a single small area?
No public source publishes price cuts or days on market for small areas. Metro series are the nearest open data, and this report labels them as such.
Is the median home value a fair price for my house?
It is a median across owner estimates in the whole area, so it describes the middle of the range, not any one house.
When were these figures last updated?
The Realtor.com series run through September 2026, the FHFA index through the second quarter of 2026, and the Census estimates cover 2020-2024.
Compare your options before committing. Request a written private offer for your property, with no obligation, then weigh it against your listing plan.
Sources
- U.S. Census Bureau, 2026. American Community Survey 2020-2024 five-year estimates, the Santa Rosa area (via Census Reporter). https://censusreporter.org/profiles/86000US95404-95404/.
- Realtor.com, 2026. Housing Inventory: Price Reduced Count in Santa Rosa, CA (CBSA). https://fred.stlouisfed.org/series/PRIREDCOU42220.
- Realtor.com, 2026. Housing Inventory: Median Days on Market in Santa Rosa, CA (CBSA). https://fred.stlouisfed.org/series/MEDDAYONMAR42220.
- Realtor.com, 2026. Housing Inventory: Median Listing Price in Santa Rosa, CA (CBSA). https://fred.stlouisfed.org/series/MEDLISPRI42220.
- U.S. Federal Housing Finance Agency, 2026. All-Transactions House Price Index for Santa Rosa-Petaluma, CA (MSA). https://fred.stlouisfed.org/series/ATNHPIUS42220Q.
- Realtor.com, 2026. Housing Inventory: New Listing Count in Santa Rosa, CA (CBSA). https://fred.stlouisfed.org/series/NEWLISCOU42220.
- Realtor.com, 2026. Housing Inventory: Median Listing Price per Square Feet in Santa Rosa, CA (CBSA). https://fred.stlouisfed.org/series/MEDLISPRIPERSQUFEE42220.
- U.S. Federal Housing Finance Agency, 2026. All-Transactions House Price Index for California. https://fred.stlouisfed.org/series/CASTHPI.
Related research

Seller Guide · October 6, 2026
How to Prepare Point Pleasant Beach Rental Records Before Selling
Separate rental approval, income history and booked stays before comparing sale terms.

Seller Guide · October 6, 2026
How to Prepare Rumson Flood and Waterfront Records Before Selling
Separate flood disclosure, elevation, repairs and waterfront rights before comparing sale terms.

Seller Guide · October 6, 2026
How to Prepare Sarasota Condo Inspection and Reserve Records Before Selling
Separate building condition, reserve funding and resale documents before comparing sale terms.