Market Brief · by Aidan Sowa · October 5, 2026
Why Do Redfin and Realtor.com Disagree on Days on Market in the Same Arts District? Reading the NoDa Condos, the Townhouses and the Parking Spaces
Reading the NoDa Condos, the Townhouses and the Parking Spaces for NoDa, NC, with each source dated and its limits noted, for owners weighing a listing against a direct sale.
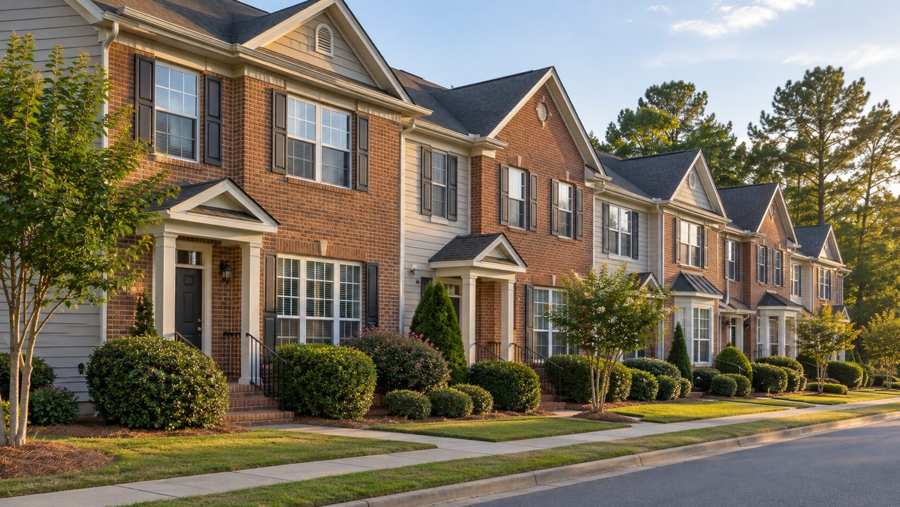
Why do two NoDa pages show 82 days and 48 days to sell a home? Redfin's page, for the three months to August 2026, shows a median of 82 days on market against 53 a year earlier. Realtor.com's page, with key indicators as of May 2026, shows a median of 48 days. The slower figure is 1.7 times the faster, a ratio computed here, and the two pages describe the same arts district. A Houzeo page shows 96 days with no date that could be read, and a local broker's article shows 70 days for the three months to May. A seller who reads one of them has one clock, and a seller who reads all of them has four.
The prices disagree less, though they still disagree. Redfin shows a median sale price of $504,756, up 1.5%. Realtor.com shows $505,000 sold and $499,900 listed. A local broker's article shows about $520,000, up 6.3%, and says the average price fell 3.9% to $495,000 in the same window. Houzeo shows $480,000, and an old Movoto page shows $535,900 for April 2025. The spread from the lowest to the highest is 11.6%, computed here, and the brokers say the explanation is the mix of condos, townhouses and new construction that happens to close.
Maison Off-Market speaks only to sellers. In the Census postal area that includes NoDa, 50.0% of the 24,963 homes are detached houses and 33.8% are in buildings of five or more units. This brief takes the building-type, vehicle and commute cuts of that Census area, since the sibling Plaza Midwood brief shares it and took the decade and tenure cuts. The last section sets out what a private sale changes for an owner.
Key Findings
- Redfin showed a NoDa median sale price of $504,756 for the three months to August 2026, up 1.5%, a median price per square foot of $342, down 2.8%, a median of 82 days on market against 53, 30 homes sold in August against 26, and a Compete Score of 37, somewhat competitive, with homes selling for about 1% below list price (Redfin, NoDa housing market).
- Realtor.com showed a median listing price of $499,900, a median sold price of $505,000, $336 per square foot, 87 active listings, a median of 48 days on market, a sale-to-list ratio of 98% with homes selling 2.02% below asking, and a median rent of $1,610 for May 2026, and called the market balanced (Realtor.com, NoDa housing market).
- Houzeo showed a median sale price of $480,000, an average of 96 days on market, a sale-to-list ratio of 98.56% and 3.6 months of supply, with no readable update date and year-over-year changes shown as 0% (Houzeo, NoDa housing market).
- A local broker's article said NoDa's median sale price rose 6.3% to about $520,000 for the three months to May 2026 while homes took 70 days to sell against 41 and 30 sold against 35 a year earlier (Local brokerage blog, the NoDa paradox), and another said the average price fell 3.9% to $495,000 over the same period while the median rose, with condos listing near $360,000, townhouses near $485,000 and new construction near $515,000 (Local brokerage blog, what is shaping the NoDa market).
- The Census postal area that includes NoDa has 24,963 housing units, half of them detached houses and 33.8% in buildings of five or more units, 24.7% of workers who work from home, 58.3% who drive alone, and 11.7% of renter households with no vehicle.
Why do the NoDa clocks and medians differ so much?
The pages differ in period and in what they count. Redfin's figures run to August 2026, Realtor.com's to May, the broker articles' to May, and Houzeo's page has no readable date. A Movoto page for NoDa was last updated May 14, 2025 and shows a median sold price of $535,900 for April 2025, 58 active listings and, under a Charlotte label, 109 days on market against 88 and 50 sales against 37. That page is more than a year older than the others. This brief does not use it as a current figure and lists it only to show how far a stale page can sit from the rest.
The clocks run 48 on Realtor.com, 70 in the brokers' articles, 82 on Redfin and 96 on Houzeo. The highest is twice the lowest, computed here. Redfin's 82 days compares with 53 a year earlier, a rise of 29 days, and the page's own text rounds that to 30 in one place. The brokers' 70 days compares with 41, a rise of 29 days, which is 70.7% more. Every page that gives a year-earlier clock shows a longer one this year. Redfin also gives 75 days as the time to go pending, which is lower than its 82 days on market, and the pages do not say why a median of days on market would run longer than the time to pending.
The price per square foot gives the size of the typical sale. At $336 on Realtor.com, a $505,000 median implies a home of about 1,500 square feet, and at Redfin's $342 a $504,756 median implies about 1,480, both computed here. That is a small home for a neighborhood where one broker says new construction lists near $515,000.
Some of the percentages need care. Realtor.com's table shows active listings at 87, with a change of 100% over a year, and rental properties at 623, up 100.72% over a year and 3,379.17% over three years. Those are the page's own figures, and a count that doubles in a year and multiplies thirty-fold in three points to a new building boom or a change in how the page counts, which the page does not say. Redfin's page says 30 sales in August against 26, which is 15.4%, while its panel says up 15.1%. The gap is small, and it shows that the panel is computed from unrounded data. The Houzeo page shows 0% over a year for price, sales and days, beside a text that says no change, which is a field that may simply not be filled in.
Why did the median rise while the average fell?
Two local articles take up this puzzle, and they agree on the figures. The median rose 6.3% to about $520,000 for the three months to May 2026, and the average sale price fell 3.9% to $495,000, according to the second article. Applied to the current numbers, a 3.9% fall to $495,000 implies that the average was about $515,000 a year earlier, and a 6.3% rise to $520,000 implies a median of about $489,000, both computed here. A rising median and a falling average mean the middle of the distribution moved up while the extremes moved down, which can happen when a few expensive sales close a year earlier and not this year, and the pages do not break out which.
The second article offers a reading of the mix. It lists three products with their list medians and days on market. Condos list near $360,000 and take 65 days, townhouses list near $485,000 and take 79 days, and new construction lists near $515,000, takes 96 days, and averages one offer before going under contract. The new construction list median is 43.1% above the condo median, a ratio computed here, and its clock is 1.5 times as long. Three different products under one neighborhood name feed one median.
The first article offers a reading of the counts. It says NoDa sold 30 homes in May 2026 against 35 a year earlier, and that with so few sales, the median is sensitive to which homes close. This is arithmetic and not a finding about NoDa. At 30 sales a month, 15 of the homes sit above the median and 15 below it, and the sale of two or three more homes at the top can move a median by thousands of dollars. The Redfin page shows 30 sales in August as well, so the monthly count is stable near 30 across the pages, and a count that size cannot support a firm trend.
The second article ties the mix to building. It says a 335-unit apartment project on North Tryon Street was slated for completion around July 2026, that a second phase of 242 units was financed to add to a project that already delivered 292, and that a conversion of a former warehouse into a mixed-use space with courts and a restaurant has been filed with the city. It adds that a car-optional building opened with 136 parking spaces for close to 600 residents, which is 0.23 spaces per resident, a ratio computed here, and that structured parking costs $25,000 to $50,000 per space to build. At those costs, 136 spaces would cost between $3.4 million and $6.8 million, also computed here. These are the article's statements. They matter to a seller only as a sign that the neighborhood is adding rental homes and residents, and this brief has not checked any of them with the city or the developers.
The first article also makes a comparison with South End, where it says homes still move in about two weeks at a median value near $525,000, and with the Charlotte metro, at about $435,000 and 48 days with 3,215 sales in May. By that article's figures NoDa's median of about $520,000 is 19.5% above the metro's, and its 70 days is 1.5 times the metro's 48. The article adds that Villa Heights, to the east, prices typically run $50,000 to $80,000 below comparable NoDa homes. These are the article's claims, and this brief has not checked the South End or Villa Heights figures.
| Source | Figure | What it measures |
|---|---|---|
| Redfin | $504,756, up 1.5% | Median sale price, three months to August 2026; 82 days; 30 sold in August |
| Realtor.com | $505,000 sold, $499,900 listed | May 2026 medians; 48 days; 98% sale-to-list |
| Houzeo | $480,000 | Median sale price, undated; 96 days; 3.6 months of supply |
| Local broker article | $520,000, up 6.3% | Median, three months to May 2026; 70 days; average $495,000, down 3.9% |
| Local broker article | $360,000 / $485,000 / $515,000 | List medians for condos, townhouses and new construction; 65, 79 and 96 days |
| Movoto (stale) | $535,900 | April 2025, page last updated May 2025 |
Sources as cited. The periods, measures and areas differ and the figures are not directly comparable. Commercial content; not independently verified.
What does the Census say about NoDa homes, cars and commutes?
The Census postal area that includes NoDa has 24,963 housing units, and the building types are mixed. Detached houses number 12,471, 50.0%, and attached houses 1,615, 6.5%. Small buildings of two to four units hold 2,334, 9.3%. Buildings of five or more units hold 8,444, 33.8%, of which 2,753, 11.0%, are in buildings of 50 or more units. There are 99 mobile homes. The area is larger than the neighborhood the pages describe, and the pages themselves give townhouses, condos and new construction as the products that sell.
Parking and cars are the topic one local article raises. It says most of the housing stock predates the idea of a dedicated parking space per household, and that a new car-optional building has 136 parking spaces for close to 600 residents. The Census gives a reading of vehicles. Of 13,426 renter households, 1,576, 11.7%, have no vehicle, and 7,549, 56.2%, have one. Of 9,931 owner households, 290, 2.9%, have none, and 6,572, 66.2%, have two or more, against 32.0% of renters, all computed here. Owners are much more likely to have two or more vehicles.
Commuting shows the working pattern. Of 30,438 workers, 17,731 drive alone, 58.3%, and 3,075 carpool, 10.1%. Public transportation carries 789, 2.6%, including 348 on light rail and 400 on buses, 476 walk, 1.6%, and 196 bike, 0.6%. Another 7,528, 24.7%, work from home, so about one worker in four needs no commute and a home office instead. The broker article that stresses the light rail corridor is describing a minority mode in this postal area, and this brief does not say how that differs in the blocks closest to the stations, which the postal area does not isolate.
The rental side deserves a note. Realtor.com counts 623 rental properties against 87 homes for sale, a ratio of 7.2 to one, computed here, which fits a postal area where 57.5% of occupied homes are rented and 33.8% of all homes sit in buildings of five or more units. It does not mean that NoDa houses are rented at that ratio, because the rental count includes apartments. For a seller of a single-family home or a townhouse, the lesson is that the buyers and renters who walk the neighborhood have a lot of apartment choices, and that the median for sold homes describes a smaller group than the neighborhood's residents.
The Census median household income for the postal area is $75,622, the median rent is $1,460 a month and the median owner-occupied value is $457,200, with a margin of error of $16,743. The value is owners' own estimate over five years and not a sale price, and it is 90.6% of Redfin's $504,756, 88.0% of the broker's $520,000 and 95.3% of Houzeo's $480,000, all computed here. Realtor.com's median rent of $1,610 is 10.3% above the Census figure and 5.9% above the $1,521 shown on the Plaza Midwood page, though the pages measure different homes. The page shows rent down 5.01% over a year and down 24.24% over three. Readers comparing markets can also read the Plaza Midwood brief and the Mint Hill brief.
Source: Census Reporter, American Community Survey 2020-2024 five-year estimates, tables B25024, B25044, B08301, B25077, B25064 and B19013. Percentages and ratios are this brief's arithmetic.
What should an owner ask, and what does a private sale change?
The first question is which product a home is. A condo, a townhouse, a new-construction home and a bungalow do not share a median, and the clocks differ with them. A seller should ask for closed sales of the same type, in the same part of the neighborhood, in the last six months, with the days to contract and the gap between the first ask and the final price. One article's numbers suggest the gap in clocks between a condo at 65 days and new construction at 96 days is 31 days.
The second question is parking. One broker's article says deeded parking deserves more scrutiny than the finish level in a kitchen, and asks whether a space is deeded to the unit or merely assigned by the association, which can change. That is the article's advice and not a finding, but the Census shows 66.2% of owner households with two or more vehicles, so a buyer will ask. A seller who knows the answer for a home has a cleaner conversation than one who does not.
The third question is the commission, and the arithmetic is simple. Each 1% of a $480,000 price is $4,800. At 3% the figure is $14,400 and at 5% it is $24,000. At $505,000, each 1% is $5,050, 3% is $15,150 and 5% is $25,250. At $520,000, each 1% is $5,200, 3% is $15,600 and 5% is $26,000. These illustrate the size of each percentage point and are not quotes of any rate a seller would be charged. No page in this brief names a NoDa commission rate, and the medians are not the price of any one home.
The fourth question is time and exposure. The pages show a clock from 48 to 96 days. Redfin says homes sell for about 1% below list price, which on a $505,000 home is about $5,050, and Realtor.com says 2.02%, about $10,200, both computed here. A public listing means showings, photographs and a price history in front of every buyer, and at 82 days that record builds up. A private sale has no showings, and no neighbors talking about a sale.
A fifth point is the buyer pool. When a clock runs 82 days and a market is called somewhat competitive by Redfin, with an average of one offer on new construction in a broker's figures, a seller has to decide how long to wait for the right buyer. A listing invites the whole pool, including investors who count the rents above and buyers who count the parking. A private sale invites one buyer at a time. That narrows the field, and Maison Off-Market does not claim it raises the price. It removes the exposure, the showings and the open record, and it lets the owner pick the closing date.
The benefits are plain. Maison Off-Market buys luxury homes and estates directly from their owners and speaks only to sellers. A private sale has no showings. It allows closing dates that give a seller time to find a new home. It has no commission costs and no closing costs, and it avoids inspection repairs. The company does not say that a private sale always beats a public listing, and in a neighborhood where one month's clock runs from 48 to 96 days depending on the page, an owner is right to ask what each route yields. If you would like a private, no-obligation offer for a NoDa home, call 401-219-4207 or use the contact form on this site.
Methodology and limitations
Redfin's figures run to August 2026 and the page says the market is somewhat competitive. Realtor.com's key indicators are as of May 2026, and its tables show some changes of 100% or more that the page does not explain. Houzeo's page carries no readable update date and shows 0% changes. A Movoto page for NoDa was last updated May 14, 2025 and is stale, so it is not used. The two broker articles are commercial pieces that draw on the same portal data and are not independent of each other, and their claims about South End, Villa Heights and new projects were not checked. The Census figures are five-year estimates for a postal area that is larger than the neighborhood, and the same postal area is used in the Plaza Midwood brief.
Conclusion
The NoDa record shows medians from $480,000 to $535,900, clocks from 48 to 96 days, a median that rose while the average fell, and a postal area where a third of the homes are in buildings of five or more units. The pages differ because they measure different periods and different products, and the useful figure for an owner is the one for the home's own type, building and parking.
Frequently Asked Questions
What is the median home price in NoDa, Charlotte?
Pages differ. Redfin shows $504,756 for the three months to August 2026, Realtor.com shows $505,000 sold for May, a local broker shows about $520,000 for the three months to May, and Houzeo shows $480,000.
How long does it take to sell a home in NoDa?
Pages differ. Realtor.com shows 48 days, a local broker shows 70 days, Redfin shows 82 days and Houzeo shows 96 days.
Why did the NoDa median rise while the average fell?
Two local brokers say the mix of condos, townhouses and new construction changed, and that with about 30 sales a month the median is sensitive to which homes close. This brief reports that as their claim.
What kinds of homes are in the NoDa postal area?
In the Census postal area that includes NoDa, 50.0% of homes are detached houses and 33.8% are in buildings of five or more units.
Can I sell my NoDa home privately?
Yes. Maison Off-Market buys luxury homes and estates directly from their owners with no showings, flexible closing dates, no commission costs, no closing costs and no inspections or repairs. Call 401-219-4207 or use the contact form.
Compare your options before committing. Request a written private offer for your property, with no obligation, then weigh it against your listing plan.
Sources
- Redfin, 2026. NoDa, NC Housing Market. https://www.redfin.com/neighborhood/526358/NC/Charlotte/NoDa/housing-market.
- Realtor.com, 2026. NoDa Neighborhood of Charlotte, NC Housing Market. https://www.realtor.com/local/market/north-carolina/charlotte/noda.
- Houzeo, 2026. Noda, Charlotte, NC Housing Market. https://www.houzeo.com/housing-market/north-carolina/charlotte/noda.
- Local brokerage blog, 2026. The NoDa Paradox. https://darleneteeter.com/blog/the-noda-paradox-why-charlottes-trendiest-neighborhood-costs-more-and-sells-slower-in-2026.
- Local brokerage blog, 2026. What's Shaping the NoDa Charlotte Real Estate Market. https://liveloveluxeproperties.com/blog/nodas-median-price-went-up-the-average-went-down-heres-what-both-numbers-are-actually-telling-you.
Related research

Seller Guide · October 6, 2026
How to Prepare Point Pleasant Beach Rental Records Before Selling
Separate rental approval, income history and booked stays before comparing sale terms.

Seller Guide · October 6, 2026
How to Prepare Rumson Flood and Waterfront Records Before Selling
Separate flood disclosure, elevation, repairs and waterfront rights before comparing sale terms.

Seller Guide · October 6, 2026
How to Prepare Sarasota Condo Inspection and Reserve Records Before Selling
Separate building condition, reserve funding and resale documents before comparing sale terms.