Market Brief · by Aidan Sowa · October 5, 2026
Why Do Pages Disagree on Plaza Midwood Prices? Reading the Bungalows, the Infill and the Teardown Lots
Reading the Bungalows, the Infill and the Teardown Lots for Plaza Midwood, NC, with each source dated and its limits noted, for owners weighing a listing against a direct sale.
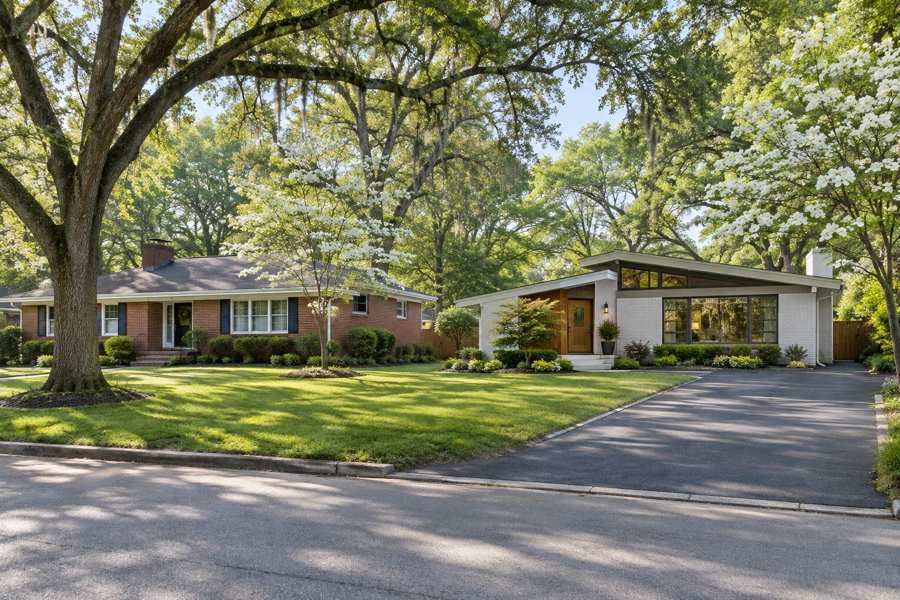
Why do three pages show a different median for Plaza Midwood? A Movoto page updated July 18, 2026 shows a median sold price of $825,000 for June. A Houzeo page shows a median of $775,000 as of February 2026. Realtor.com shows a median sold price of $1,133,750. The highest is 46.3% above the lowest, a ratio computed here. The clocks differ too, from 32 days on Realtor.com to 39 on Movoto and 68 on Houzeo, so the slowest is 2.1 times the fastest. A seller who reads one of these pages is pricing against a guess, and a seller who reads all three has three guesses that cannot be averaged.
Two local broker articles explain the spread in the same way. Both say Plaza Midwood is not one market. They describe 1920s bungalows, new infill and duets, and lots sold as teardowns, which close in different proportions each month. One article gives a single-family median of $1,005,000 for the twelve months to August 2026, and another figure of $965,000 for the twelve months to February. This brief reports those claims as the articles' own. It finds them plausible, since the Census postal area has both a median year built of 1972 and 4,870 homes built since 2010, but it cannot confirm the mix from the pages.
Maison Off-Market speaks only to sellers. In the Census postal area that includes Plaza Midwood, 59.5% of the 24,963 homes were built before 1980 and 57.5% of occupied homes are rented. The last section sets out what a private sale changes for an owner, and why a property's own type matters more than any neighborhood median.
Key Findings
- Movoto showed 39 active listings and a median sold price of $825,000 for June 2026, a median list price of $825,000 against $930,000 in 2025, 39 days on market against 26 a year earlier and 41 homes sold against 38, though two of those figures sit under a Charlotte label on the page (Movoto, Plaza Midwood market trends).
- Realtor.com showed a median listing price of $837,499, down 20.80% over a year, a median sold price of $1,133,750, up 34.41%, $450 per square foot, 45 active listings, a median of 32 days on market, a sale-to-list ratio of 101% for June 2026 and a median rent of $1,521 a month (Realtor.com, Plaza Midwood housing market).
- Houzeo showed a median home price of $775,000 as of February 2026, down 0.17% over a year, a median of 68 days on market, a sale-to-list ratio of 99.53%, 20 homes on the market, condos around $590,000 and single-family homes averaging $950,000 (Houzeo, Plaza Midwood housing market).
- A local broker's August 20, 2026 article listed four portal figures that disagree, from a $799,000 list median down 13% in a month to a $1,005,000 single-family median for the twelve months to August 2026, and called the neighborhood at least three markets blended differently each month (Local brokerage blog, the median is arguing with itself), while another broker's article separates bungalows, infill and duets, and teardown lots (Local brokerage blog, three markets in one postal area).
- The Census postal area that includes Plaza Midwood has 24,963 housing units, 59.5% of them built before 1980, a median year built of 1972, 57.5% of occupied homes rented and a median owner-occupied value of $457,200, which is 59.0% of Houzeo's $775,000 and 40.3% of Realtor.com's $1,133,750, ratios this brief computes.
Why do the Plaza Midwood medians differ so much?
The pages differ in period, product and measure. Houzeo's $775,000 is a February 2026 figure. Movoto's $825,000 is June 2026. Realtor.com's $1,133,750 is labeled as the neighborhood-wide median sold price on a page that gives June 2026 as its key month. The local broker adds a $965,000 median for the twelve months to February and a $985,000 median for February alone, both from other portals. That makes three February 2026 figures, $775,000, $965,000 and $985,000, from three pages, and the pages do not say whether they count the same sales.
The movements disagree as well as the levels. Realtor.com shows the median sold price up 34.41% over a year and the median listing price down 20.80%. Applied to the current medians, those two changes imply that sold prices were about $843,500 a year earlier and list prices about $1,057,000, both computed here from the page's percentages, so the sold median rose while the list median fell, and the sold median is 35.4% above the list median. That order is odd, since homes usually list near where they sell, and a likelier reading is that a few high closings and a different set of listings are moving each median. The page does not explain it. Houzeo's median is down 0.17% and Movoto shows its list median down from $930,000 to $825,000, a fall of 11.3%.
One broker's article makes the point about averages. It says one portal shows the average sale price swinging by more than 40% over a year next to a median that barely moved, and that this can only come from a handful of very different sales. The article's logic is sound as arithmetic, since a median is much less sensitive to a few extreme sales than a mean, though this brief cannot see the portal page the article refers to.
The price per square foot shows how different the products are. Realtor.com shows $450, down 3.74%, and the local broker's single-family figure is $474 over twelve months. At $474, a $1,005,000 median implies a typical home of about 2,120 square feet, and at $450 a $1,133,750 median implies about 2,520, both inferences computed here from two figures that may not cover the same homes.
What do the clock, the competition and the counts show?
The clocks are 32 days on Realtor.com, 39 on Movoto and 68 on Houzeo. On Realtor.com, 32 days earns the label hot. On Houzeo's own scale, under 45 days is a seller's market, 45 to 70 days is balanced and over 70 favors buyers, so 68 days is balanced. Movoto's 39 is under that line, and the page says June 2026 was a seller's market. A median of 32 days on Realtor.com is up 3.23% over a year and 28% over three years, and Movoto's 39 compares with 26 a year earlier, a rise of 50%, though that line sits under a Charlotte label.
The sale-to-list ratio does not separate the pages as much. Realtor.com shows 101% for June 2026, which means homes closed about 1% above the list price, and Houzeo shows 99.53%, about 0.5% below. Both say close to asking, and on a $825,000 home, the gap between them is about $12,000, computed here from 101% and 99.53%. The pages do not give the share of homes with price cuts for Plaza Midwood, so this brief gives none.
The counts are small, and they disagree. Movoto shows 39 active listings and 3 new, Realtor.com shows 45 and Houzeo shows 20, with 21 new. At 39 active listings and 41 homes sold in June, Movoto's page implies about one month of supply, an inference from two figures, one of which sits under a Charlotte label. Realtor.com's neighborhood table counts for-sale homes by subdivision, with Chatham Estates and Midwood at 4 each, Eastern Retreat, and Forest Circle at 3, and the rest at 2 or fewer, and with counts that small, one closing moves a median.
Houzeo's page contradicts itself on rates. One line gives a mortgage rate of around 6.58% and another says 6.23%, and its panels read 0% year over year beside a text that says the median is down 0.17%. This brief uses its price, days and ratio figures as the page's own claims and does not use its rate or its national projection of about 3% appreciation. Movoto's page also lists 143 public schools, a number that can only be citywide, so its Charlotte label is the likelier description of its school data, and the page does not say which of its other figures are neighborhood figures.
| Source | Figure | What it measures |
|---|---|---|
| Houzeo | $775,000, down 0.17% | Median home price, February 2026; 68 days; 99.53% sale-to-list |
| Movoto | $825,000 | Median sold price, June 2026; 39 days (Charlotte label) |
| Realtor.com | $1,133,750, up 34.41% | Median sold price; listing median $837,499, down 20.80%; 32 days; 101% |
| Local broker article | $965,000, up 7% | Trailing twelve months to February 2026, from a portal |
| Local broker article | $1,005,000 | Single-family median, twelve months to August 2026; $474 per square foot |
| Local broker article | $799,000, down 13% | List median, August 2026, down 12% over a year |
Sources as cited. The periods, measures and areas differ and the figures are not directly comparable. Commercial content; not independently verified.
Is Plaza Midwood one market, or three?
Both broker articles say three. The first calls it at least three markets blending in whatever proportion happened to close that month. The second names them: the original bungalow, built between roughly the 1920s and the 1940s on lots under a quarter acre, often without a garage; the infill build or duet, new and attached homes near the Gold Line stops and the Commonwealth corridor, with garages and fenced yards; and the teardown lot, priced as a buildable parcel with a structure still standing.
The articles give figures for the mix. Recent sales of single-family homes in the Midwood subdivision, they say, run from construction years of 1920 to 2026, with a median year built around 2003, lot sizes from 0.08 to 0.6 acres with a median around 0.2, and prices from $350,000 to $2.43 million. A median year of 2003 in a neighborhood known for 1920s bungalows means, in the articles' reading, that about half of what sells was built after the streetcar era. The two articles repeat the same figures in similar words, so they are not independent confirmation of each other.
The Census postal area looks different, as it should, because it is a larger area. Its median year built is 1972, 59.5% of homes were built before 1980 and 18.4% before 1950. Homes built since 2010 are 19.5%, with 4,199 in the 2010s and 671 since 2020. The postal area has two peaks, one in the 1950s and 1960s and one in the 2010s, and the 1980s through the 2000s are the quiet decades, each under 2,000 homes. That shape fits a place with an old core and recent infill, which is consistent with what the articles describe, though the Census does not say where the new homes stand.
The second article adds a note on rules. It says one recent lot listing in Plaza Midwood carried a zoning designation that would allow a new build once local requirements are met, which is what lets a small cleared lot sit beside homes built before the interstate highways, and that new construction near a protected historic property went through a Historic District Commission review. The article draws the point that the zoning code opens the door to more infill while the historic review constrains how it looks. For an owner, the practical question is which of those two forces applies to a given parcel. This brief has not checked the zoning of any lot, and it takes the article's statements as claims.
The articles tie the mix to projects. They say a cotton-processing company filed a rezoning application in May 2026 for roughly 21 of its 35 acres, and that no development plans exist yet. They say a finished project on 12 acres at Central and Pecan Avenues holds about 1.1 million square feet of apartments, a hotel, retail and 400,000 square feet of office, that a venture plans 370 multifamily units on Central Avenue with construction starting in mid-2026, and that first-quarter 2026 data showed apartment starts across the Charlotte area at their lowest point in 11 years. This brief has not checked any of these claims against the city or the companies, and it does not use them to say where prices will go.
What does the Census say about Plaza Midwood homes and households?
The Census postal area that includes Plaza Midwood has 24,963 housing units, and 14,857 of them, 59.5%, were built before 1980. Of those, 1,951 were built in 1939 or earlier, 7.8%, and 2,647 in the 1940s, 10.6%. The 1950s hold 3,757, 15.1%, the 1960s 3,694, 14.8% and the 1970s 2,808, 11.2%. Since 2000, 6,697 homes were built, 26.8%, computed here. The median year built is 1972.
Renting is the majority. Of 23,357 occupied homes, 9,931 are owner-occupied, 42.5%, and 13,426 are rented, 57.5%. Among owners, 393 moved in from 2023 on and 2,100 in 2020 to 2022, together 25.1% of owners, and 3,568 moved in during the 2010s, 35.9%. Another 3,870 owners, 39.0%, moved in before 2010. Among renters, 6,095 of 13,426 moved in from 2020 on, 45.4%. Owners here are a mix of long tenure and recent arrival.
Vacancy is 6.4%, with 1,606 vacant units. Of those, 676 are for rent, 42.1%, 171 are rented and not yet occupied, 110 are for sale, 146 are sold and not yet occupied, 53 are held for seasonal use and 450 are in the other category, 28.0%. The 110 for-sale units are 0.4% of the stock. The survey is a five-year average, so it does not measure the 39, 45 or 20 active listings the pages count on a single day.
The Census median owner-occupied value is $457,200, with a margin of error of $16,743, which is 3.7% of the value. It is owners' own estimate over five years and not a sale price, and it covers a postal area of 51,806 residents that is far larger than the neighborhood pages describe. It is 59.0% of Houzeo's $775,000, 55.4% of Movoto's $825,000 and 45.5% of the broker's $1,005,000. The Census median household income is $75,622 and the median rent is $1,460 a month. Realtor.com's median rent of $1,521 is 4.2% higher, a ratio computed here. The page shows rent down 9.36% over a year and down 36.63% over three, and 57 rentals up 435.71% over three years, which is a count of about 11 three years ago, so the three-year changes rest on small counts. Readers comparing markets can also read the Mooresville brief and the NoDa brief.
Source: Census Reporter, American Community Survey 2020-2024 five-year estimates, tables B25034, B25038, B25004, B25077, B25003, B25002, B25064 and B19013. Percentages and ratios are this brief's arithmetic.
What should an owner ask, and what does a private sale change?
The first question is which product a home is. A 1920s bungalow, a 2022 duet and a cleared lot do not share a median, and the broker articles say as much. A seller should ask for closed sales of the same type, on the same kind of lot, in the last six months, with the days to contract and the gap between the first ask and the final price. Pulling three renovated bungalows and three new builds and averaging them, as one article puts it, produces a figure that describes nothing real.
The second question is which period a number covers. A February figure, a June figure and a twelve-month figure are different measures, and the pages show a spread of 46.3% between the lowest and the highest median. The third question is what a small count means. Twenty to 45 active listings in a neighborhood this size leave each median open to one or two sales.
The fourth question is the commission, and the arithmetic is simple. Each 1% of a $775,000 price is $7,750. At 3% the figure is $23,250 and at 5% it is $38,750. At $1,005,000, each 1% is $10,050, 3% is $30,150 and 5% is $50,250. At $1,133,750, each 1% is $11,337.50, 3% is $34,012.50 and 5% is $56,687.50. These illustrate the size of each percentage point and are not quotes of any rate a seller would be charged. No page in this brief names a Plaza Midwood commission rate, and the medians are not the price of any one home.
A sixth point is the buyer pool. If a lot is worth more to a builder than the house on it is worth to a family, a public listing will bring both kinds of buyer through the door, and the listing photographs and price history will be read by each. The broker article says the teardown segment is responsible for the top of its $350,000 to $2.43 million range and is priced like a buildable parcel with a structure still standing. An owner of such a property may prefer to talk to one buyer privately, before deciding whether to list publicly, and the owner can decide that with the figures above in hand.
The fifth question is exposure. The pages show a clock from 32 to 68 days, and a public listing means showings, photographs and a price history that every buyer sees. A listing that sits at 68 days is in the open for over two months, and a price cut becomes part of the record. A private sale has no showings, and no neighbors talking about a sale.
The benefits are plain. Maison Off-Market buys luxury homes and estates directly from their owners and speaks only to sellers. A private sale has no showings. It allows closing dates that give a seller time to find a new home. It has no commission costs and no closing costs, and it avoids inspection repairs, which matters for an older home, since 59.5% of the homes in the postal area were built before 1980, though the Census says nothing about condition. The company does not say that a private sale always beats a public listing, and in a neighborhood where one month's median runs from $775,000 to $1,133,750 depending on the page, an owner is right to ask what each route yields. If you would like a private, no-obligation offer for a Plaza Midwood home, call 401-219-4207 or use the contact form on this site.
Methodology and limitations
Movoto's page was updated July 18, 2026 and gives some figures under a Charlotte label, including the school count, so its days and sales counts may not be neighborhood figures. Houzeo's page is dated February 2026 in its text, contradicts itself on mortgage rates, and shows year-over-year changes of 0% beside a text that says 0.17%. Realtor.com's page gives June 2026 as its key month and its change columns are labeled one-year and three-year. The two broker articles are commercial pieces that repeat the same portal figures and framing. A Redfin neighborhood page returned a different place and was discarded. The Census figures are five-year estimates for a postal area, not the neighborhood, and the area is larger than the neighborhood.
Conclusion
The Plaza Midwood record shows medians from $775,000 to $1,133,750, clocks from 32 to 68 days, small counts of active listings, brokers who describe three markets, and a postal area where 59.5% of homes were built before 1980. The pages differ because they measure different periods and different homes, and the useful figure for an owner is the one for the home's own type and lot.
Frequently Asked Questions
What is the median home price in Plaza Midwood, Charlotte?
Pages differ. Houzeo shows $775,000 as of February 2026, Movoto shows $825,000 for June 2026, and Realtor.com shows a median sold price of $1,133,750.
How long does it take to sell a home in Plaza Midwood?
Pages differ. Realtor.com shows a median of 32 days on market, Movoto shows 39 days under a Charlotte label, and Houzeo shows 68 days.
Why do Plaza Midwood prices look so inconsistent?
Two local brokers say the neighborhood trades three different products, original bungalows, new infill and duets, and teardown lots, and that the mix changes each month. This brief reports that as their claim.
How old are the homes in Plaza Midwood?
In the Census postal area that includes Plaza Midwood, 59.5% of homes were built before 1980, 18.4% before 1950, and the median year built is 1972.
Can I sell my Plaza Midwood home privately?
Yes. Maison Off-Market buys luxury homes and estates directly from their owners with no showings, flexible closing dates, no commission costs, no closing costs and no inspections or repairs. Call 401-219-4207 or use the contact form.
Compare your options before committing. Request a written private offer for your property, with no obligation, then weigh it against your listing plan.
Sources
- Movoto, 2026. Plaza Midwood Charlotte Market Trends. https://www.movoto.com/charlotte-nc/plaza-midwood/market-trends/.
- Realtor.com, 2026. Plaza Midwood in Charlotte, NC Housing and Rental Market. https://www.realtor.com/local/market/north-carolina/charlotte/plaza-midwood.
- Houzeo, 2026. Plaza Midwood, Charlotte, NC Housing Market in 2026. https://www.houzeo.com/housing-market/north-carolina/charlotte/plaza-midwood.
- Local brokerage blog, 2026. In Plaza Midwood, the Median Price Is Arguing With Itself. https://thelawscollective.com/blog/in-plaza-midwood-the-median-price-is-arguing-with-itself.
- Local brokerage blog, 2026. Plaza Midwood Home Prices Across Three Distinct Markets. https://oliviagalarde.com/blog/the-three-markets-hiding-inside-one-plaza-midwood-zip-code.
Related research

Seller Guide · October 6, 2026
How to Prepare Point Pleasant Beach Rental Records Before Selling
Separate rental approval, income history and booked stays before comparing sale terms.

Seller Guide · October 6, 2026
How to Prepare Rumson Flood and Waterfront Records Before Selling
Separate flood disclosure, elevation, repairs and waterfront rights before comparing sale terms.

Seller Guide · October 6, 2026
How to Prepare Sarasota Condo Inspection and Reserve Records Before Selling
Separate building condition, reserve funding and resale documents before comparing sale terms.