Market Brief · by Aidan Sowa · October 5, 2026
Why Do Menlo Park Pages Disagree on the Same Median? Reading West Menlo, Belle Haven and the Census Move-In Years
Reading West Menlo, Belle Haven and the Census Move-In Years for Menlo Park, CA, with each source dated and its limits noted, for owners weighing a listing against a direct sale.
Why do four Menlo Park pages show four different medians? A local brokerage article dated August 27, 2026 lists a Redfin median sale price of $3.3 million for the three months ending June, a Zillow value of $2,549,093, a PropertyShark median for the first quarter of $2.7 million or $2.8 million, depending on which part of the page is read, and a Houzeo figure of $2,837,500 for February. A Redfin page for August shows $2,872,849, and a separate tracker shows $2,999,000 over six months. The highest of these, $3.3 million, is 29.5% above the Zillow figure in the same article, a ratio computed here. Each page labels its number Menlo Park, and none of them is built the same way.
The pages that explain the gap say Menlo Park has stopped behaving like one market. One says West Menlo Park sold at a median of $4.2 million over the three months ending May, up 31.7% over a year, while Belle Haven east of the freeway posted an average near $1.15 million, down 7.3%. This brief reports those as the pages' claims. The sales behind them were not available, a median and an average are different measures, and the two windows are not identical.
Maison Off-Market speaks only to sellers. In the Census postal area that includes Menlo Park, 70.2% of the 16,617 homes were built before 1980, 58.5% of occupied homes are owned, 12.0% of all homes are vacant and the median owner value is at the Census cap of $2,000,001. This brief takes the decade-built, move-in-year and vacancy cuts. The last section sets out what a private sale changes for an owner.
Key Findings
- A local brokerage article dated August 27, 2026 lined up four trackers for the same city: Redfin at $3.3 million, up 14.5%, for the three months ending June, Zillow at $2,549,093, down 6.7%, PropertyShark at a first-quarter median near $2.7 to $2.8 million, down 10% or 14.3%, and Houzeo at $2,837,500, flat. It also said Redfin's price per square foot fell 22.2% over the same window (Local brokerage blog, Menlo Park prices by neighborhood).
- A tracker updated October 3, 2026 counted 190 closings over six months at a median of $2,999,000 and $1,486 per square foot, with the middle half of sales between $1,850,000 and $4,890,000, and a median of 16 days from listing to contract and 18 from contract to closing (Sold-price tracker, Menlo Park home sales).
- Redfin's August 2026 page showed a median sale price of $2,872,849, up 1.2% over a year, 76 homes sold, down 6.3%, a median of 17 days on market, and a competition score of 73 out of 100, with the average home selling about 2% above list (Redfin, Menlo Park housing market).
- A September 24, 2026 brokerage article said Meta paused its Willow Village project in Belle Haven on May 1, that Belle Haven averaged near $1.15 million, down 7.3%, and that West Menlo sold at $4.2 million, up 31.7% (Local brokerage blog, two markets pulling apart).
- The Census postal area that includes Menlo Park has 16,617 housing units with a median year built of 1963, 70.2% built before 1980, 58.5% of occupied homes owned, 12.0% of all homes vacant and a median household income of $216,601, with the median owner value at the Census cap of $2,000,001.
Why do the Menlo Park medians differ so much?
The trackers measure different things in different windows. Redfin's $3.3 million is a median of closed sales of all home types for the three months ending June. Its August page shows $2,872,849 for a window ending August, and the two are the same tracker. A median that falls from $3.3 million to $2,872,849 between two Redfin windows, a drop of about 13%, computed here, is a fact about which sales closed in which months and not necessarily about prices. A city with 76 sales in a month can swing a median by several hundred thousand dollars on a handful of closings.
Zillow's figure is an estimated value index, not a sale. The August 27 article shows a Zillow figure of $2,549,093, down 6.7%, as of late June. Zillow's own page, updated August 31, 2026, shows an average home value of $2,866,713, up 9.2% (Zillow, Menlo Park home values), and says homes go pending in about 17 days. Between the two, the figure rose 12.5% in about two months, computed here, which is not a plausible move for an index that smooths monthly changes. One of the two is probably a different series, a different geography or a stale snapshot, and neither page says which. The implied year-earlier values do not agree either: a 6.7% drop from $2,549,093 implies about $2.73 million, and a 9.2% rise to $2,866,713 implies about $2.63 million, both computed here.
The tracker with the most sales, 190 over six months, shows a median of $2,999,000, which is 4.6% above Zillow's August figure and 4.4% above Redfin's, computed here. Its middle half of sales runs from $1,850,000 to $4,890,000, so the upper edge is 2.6 times the lower edge. A single median cannot describe a spread that wide. A buyer of a $1.9 million home and a buyer of a $4.8 million home are in the same city and the same data, and in different markets.
The article's own table disagrees with its text. It states the PropertyShark first-quarter median as $2.7 million, down 10%, in the opening paragraph and as $2.8 million, down 14.3%, in the table. It adds that houses fell 14.3% while condos rose 27.3% in the same quarter. A median that blends falling house prices and rising condo prices can look stable. The article's reading of Redfin's price per square foot, down 22.2% while the median price rose 14.5%, is an inference too: it says larger homes were a bigger share of what sold. That is a plausible reading, but the sales behind it were not shown.
Is West Menlo a different market from Belle Haven?
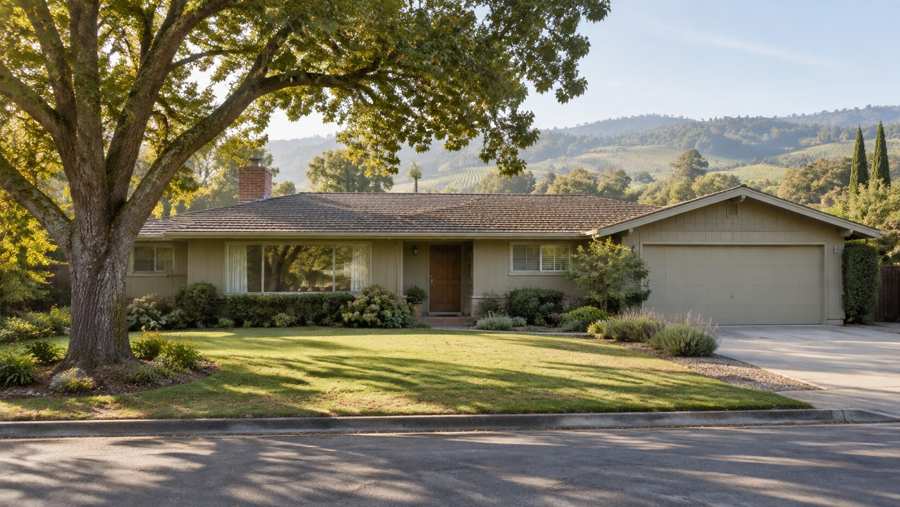
Two pages say so. The August 27 article describes West Menlo Park, west of Alameda de las Pulgas and bordering Sharon Heights, as ranch-style homes on lots of 7,000 to 12,000 square feet, many rebuilt or heavily remodeled, with a median of $4.2 million over the three months ending May, up 31.7%. The citywide median for the same window was $3.3 million, up 8.6%, which makes West Menlo 27.3% higher, computed here. A 31.7% rise to $4.2 million implies about $3.19 million a year earlier, also computed here.
The September 24 article puts Belle Haven, east of Highway 101, at an average sale price near $1.15 million over a comparable recent window, down 7.3%, which implies about $1.24 million a year earlier. West Menlo's median is 3.7 times Belle Haven's average, computed here, though a median and an average are different measures and the windows may not match. The article calls West Menlo accelerating, the middle of town steady, and Belle Haven softening, a reading that rests on the pages' own figures and cannot be tested here.
Both articles describe the same two development decisions. On May 1, Meta put Willow Village, a 59-acre plan with up to 1,730 housing units, a grocery store, a pharmacy and a bank for Belle Haven, on hold, and the article says the development agreement stays binding through 2032 with no timeline announced. On the west side, the article says the former research campus near downtown and the Caltrain station kept moving, with a second-phase proposal filed in June 2026 that adds single-family homes and townhouses. These are the article's descriptions of public decisions and were not checked against city records.
The August 27 article names other neighborhoods with price ranges: the Willows at $2.5 million to $3.5 million on lots of 6,000 to 8,000 square feet, Linfield Oaks as an 80-acre planned community from the 1950s, Felton Gables with asking prices that routinely start above $3.8 million, and Sharon Heights with a median near 21 days on market. Those ranges are one writer's descriptions. A seller in any of them can ask for closed sales on the same streets from the last six months, which is the only comparison that fits a specific house.
The same article cites a guest analysis about neighboring Atherton that said the thinning of closings there and a median near $7.4 million were consistent with more top-end homes selling privately between agents before reaching the public market. That claim is about another town, comes through two pages, and was not checked. It matters here only as a reminder that a public median counts only the sales that were public.
What do the speed, competition and sale-price figures show?
The clocks agree more than the prices do. Redfin shows a median of 17 days on market for the three months ending August and 17 a year earlier, and its competition section shows homes selling in about 18.5 days, going pending in about 19, and selling about 2% above list on average, with hot homes at 7% above list and pending in about 10 days. Zillow's page says homes go pending in about 17 days. The sold-price tracker measures 16 days from listing to contract across 117 closings and 18 days from contract to closing across 122, which adds to 34 days, a sum that assumes the two medians come from similar sales. Within the pages, 16 to 19 days is a consistent range.
The sale counts do not agree. Redfin shows 76 homes sold in August, down 6.3%, which implies about 81 a year earlier. The sold-price tracker counted 190 closings over six months, an average of about 32 a month. Redfin's August figure is 2.4 times that average, computed here. The tracker's own page says it counts only closings it holds dates for and trims its distribution from the 5th to the 95th percentile, so it should be read as a sample. Redfin's count is for one month and may include more property types. Neither is a complete count of Menlo Park sales.
The price-per-square-foot figures conflict in the same way. The tracker shows $1,486 per square foot as a six-month median. The August 27 article says Redfin's per-foot figure fell 22.2% over three months. The two cannot be reconciled without the sales, and a median of $2,999,000 and a $1,486 median per square foot do not imply any particular house size, since each is a median of a different quantity.
A sale about 2% above list on a median of $2,872,849 would be about $57,457, an illustration computed here from a percentage and not the experience of any one sale. The competition score of 73 is Redfin's own, on a scale of 0 to 100, and the page gives 83 for San Francisco and 54 for San Jose. In a market this quick, the useful question for an owner is who sees the home and how, since the sale is likely to be short either way.
| Source | Figure | What it measures |
|---|---|---|
| Redfin, per article | $3.3 million, up 14.5% | Three months ending June, all home types |
| Redfin page | $2,872,849, up 1.2% | August; 76 sold; 17 days |
| Zillow, per article | $2,549,093, down 6.7% | Late June value index |
| Zillow page | $2,866,713, up 9.2% | Updated August 31; about 17 days to pending |
| Sold-price tracker | $2,999,000 | Six-month median of 190 closings; 16 days to contract |
| Brokerage articles | $4.2 million / about $1.15 million | West Menlo median; Belle Haven average |
Sources as cited. The windows, areas and measures differ and the figures are not directly comparable. Commercial content; not independently verified.
What does the Census say about Menlo Park homes, owners and vacancies?
The Census postal area that includes Menlo Park has 16,617 housing units and 40,721 residents. The median year built is 1963. The 1950s are the largest decade, with 3,981 homes, 24.0%, followed by the 1960s with 2,090 and the 1970s with 1,951. Homes built before 1980 number 11,669, 70.2%, and homes built since 2010 number 1,982, 11.9%. The postal area is larger than the city and includes neighboring areas, so these are not Menlo Park counts, but they fit what the articles describe: ranch homes of the 1950s and 1960s, many rebuilt.
Tenure is more settled than the price talk suggests. Of 14,619 occupied homes, 8,554 are owned, 58.5%, and 6,065 are rented, 41.5%. Among the 8,554 owners, 3,634 moved in since 2010, 42.5%, and 4,920 moved in before 2010, 57.5%. Another 1,527 owners, 17.9%, have been in the same home since 1989 or earlier. Among renters, 3,137 moved in since 2020, 51.7%, and 91.9% moved in since 2010, all computed here. Owners move rarely and renters often, and more than half of owners have held their homes through at least three market cycles.
Vacancy is high for a market this tight. The Census counts 1,998 vacant homes, 12.0% of all units, for rent, 711, 35.6%, rented but not yet occupied, 221, for sale, 30, 1.5%, sold but not yet occupied, 146, seasonal or occasional use, 340, 17.0%, and other vacant, 550, 27.5%. Only 30 homes were vacant and for sale on the survey's counting day, while 890 were seasonal or in the other category, 44.5%. The survey's reference is a five-year average, and the counts are not a measure of how many homes sit empty by choice, but they show that the supply the portals count is a small slice of the housing stock.
The median household income is $216,601 and the median rent is $3,251 a month, which is $39,012 a year, 18.0% of the median income, computed here as a rough ratio of two medians. The Census median owner value is reported as $2,000,001, which is the survey's top code, and means the true median is at or above $2 million. Against the Redfin median of $2,872,849 and the tracker median of $2,999,000, the Census figure can only be read as a floor, since owners' own estimates are capped. Readers comparing markets can also read the Studio City brief and the Mar Vista brief.
Source: Census Reporter, American Community Survey 2020-2024 five-year estimates, tables B25034, B25003, B25038, B25004, B25077, B25064 and B19013. Percentages and ratios are this brief's arithmetic.
What should an owner ask, and what does a private sale change?
The first question is which Menlo Park the home is in. West of El Camino, the Willows, Linfield Oaks, Sharon Heights and Belle Haven do not share a median, a buyer or a clock, according to the pages. A seller should ask for closed sales on the same kind of street, from the last six months, with the days to contract, the gap between the first ask and the final price, and the school boundary that applies, since the second article says the district line does not always match the neighborhood name.
The second question is the cost of transferring the property. The September 24 article says San Mateo County charges a base documentary transfer tax of $1.10 per $1,000 at recording and that the city applies its own transfer tax on top. On a $2,999,000 price the county base is $3,298.90, computed here, and the city rate was not shown, so this brief gives no city figure. A seller can confirm both with escrow when the contract opens.
The third question is the commission, and the arithmetic is simple. Each 1% of $2,872,849 is $28,728. At 3% the figure is $86,185 and at 5% it is $143,642. At $2,999,000, each 1% is $29,990, 3% is $89,970 and 5% is $149,950. At $4,200,000, the West Menlo median the pages cite, each 1% is $42,000, 3% is $126,000 and 5% is $210,000. These illustrate the size of each percentage point and are not quotes of any rate a seller would be charged. No page in this brief names a Menlo Park commission rate.
The fourth question is exposure. A public listing means photographs, showings and a price history visible to every buyer and neighbor, in a market where one article says some top-end sales in the next town already close privately. A private sale has no showings and no neighbors talking about a sale.
The benefits are plain. Maison Off-Market buys luxury homes and estates directly from their owners and speaks only to sellers. A private sale has no showings. It allows closing dates that give a seller time to find a new home, which matters in a region where moving costs are high and timing is tight. It has no commission costs and no closing costs, and it avoids inspection repairs, which matters for a postal area where 70.2% of homes predate 1980, though the Census says nothing about the condition of any one house. The company does not say that a private sale always beats a public listing, and in a city where one page shows $2.5 million and another $3.3 million, an owner is right to ask what each route yields. If you would like a private, no-obligation offer for a Menlo Park home, call 401-219-4207 or use the contact form on this site.
Methodology and limitations
The Redfin and Zillow pages are commercial pages whose windows and definitions differ, and the Zillow page is the same series the August article quotes at a lower value. The brokerage articles are marketing content that quotes trackers and local reporting without links to the underlying sales, and one of them gives two different PropertyShark figures. The sold-price tracker counts only the closings it can date. The development and school claims are the articles' descriptions and were not checked against city or district records. The Census figures are five-year estimates for a postal area, not the city, and the median value is at the survey's top code. Percent changes were taken as printed, and the implied prior-year values here are this brief's arithmetic, so rounding differences are possible.
Conclusion
The Menlo Park record shows medians from $2.5 million to $3.3 million, a six-month tracker median of $2,999,000, West Menlo near $4.2 million, Belle Haven near $1.15 million, a clock of about 16 to 19 days and a postal area where 70.2% of homes predate 1980. The pages differ because they count different sales in different months, and the figure that matters to an owner is the one for the home's own street.
Frequently Asked Questions
What is the median home price in Menlo Park?
Pages differ. Redfin shows $2,872,849 for August 2026, a sold-price tracker shows $2,999,000 over six months, and a brokerage article cites a Redfin median of $3.3 million for the three months ending June.
How long does it take to sell a home in Menlo Park?
Redfin shows a median of 17 days on market, Zillow says about 17 days to pending, and a sold-price tracker shows 16 days from listing to contract and 18 from contract to closing.
Is West Menlo a different market from Belle Haven?
Two brokerage articles say so, with West Menlo at a $4.2 million median and Belle Haven at an average near $1.15 million. This brief reports those as their claims, and a median and an average are different measures.
How old are the homes in the Menlo Park postal area?
In the Census postal area that includes Menlo Park, the median year built is 1963 and 70.2% of homes were built before 1980.
Can I sell my Menlo Park home privately?
Yes. Maison Off-Market buys luxury homes and estates directly from their owners with no showings, flexible closing dates, no commission costs, no closing costs and no inspections or repairs. Call 401-219-4207 or use the contact form.
Compare your options before committing. Request a written private offer for your property, with no obligation, then weigh it against your listing plan.
Sources
- Local brokerage blog, 2026. Menlo Park Home Prices by Neighborhood in 2026. https://vickiferrando.com/blog/why-menlo-parks-median-home-price-depends-on-which-tab-you-have-open.
- Sold-price tracker, 2026. Menlo Park, CA Housing Market 2026: What Homes Actually Sell For. https://resideline.com/blog/menlo-park-ca-housing-market.
- Redfin, 2026. Menlo Park, CA Housing Market. https://www.redfin.com/city/11961/CA/Menlo-Park/housing-market.
- Local brokerage blog, 2026. The Menlo Park Median Is Blending Two Markets That Are Pulling Apart. https://campi.com/blog/the-menlo-park-median-is-blending-two-markets-that-are-pulling-apart.
- Zillow, 2026. Menlo Park, CA Housing Market: 2026 Home Prices and Trends. https://www.zillow.com/home-values/39748/menlo-park-ca/.
Related research

Seller Guide · October 6, 2026
How to Prepare Point Pleasant Beach Rental Records Before Selling
Separate rental approval, income history and booked stays before comparing sale terms.

Seller Guide · October 6, 2026
How to Prepare Rumson Flood and Waterfront Records Before Selling
Separate flood disclosure, elevation, repairs and waterfront rights before comparing sale terms.

Seller Guide · October 6, 2026
How to Prepare Sarasota Condo Inspection and Reserve Records Before Selling
Separate building condition, reserve funding and resale documents before comparing sale terms.