Market Brief · by Aidan Sowa · October 5, 2026
Is Studio City Worth the Zillow Value, the Realtor.com Median or the Redfin Median? Reading a Typical Value Against Sold Medians
Reading a Typical Value Against Sold Medians for Studio City, CA, with each source dated and its limits noted, for owners weighing a listing against a direct sale.
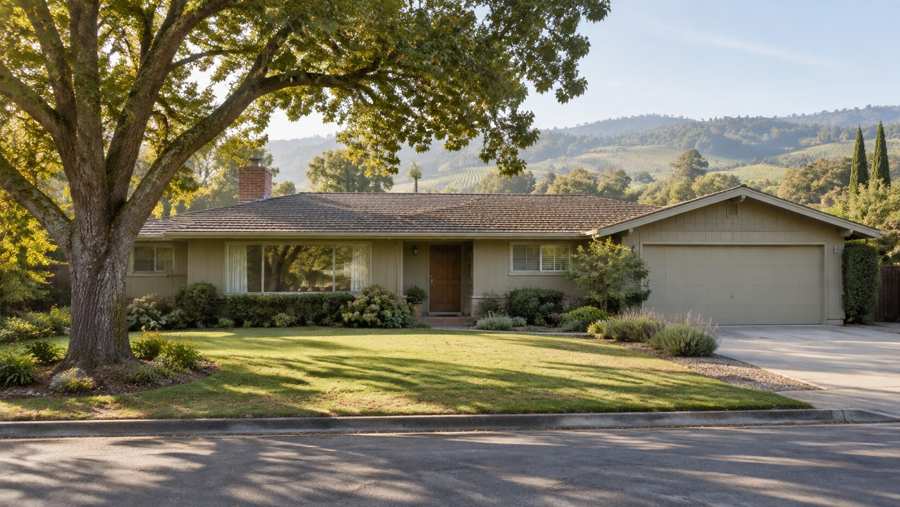
Is Studio City worth $1,568,123, $1,940,000, $2,026,000 or $2,300,000? Each is published for 2026. Zillow shows a typical home value of $1,568,123, up 3.2% on the year. Redfin shows a median sale price of $1,940,000 for the three months to September, up 38.2%. Realtor.com shows a median sold price of $2,026,000 for August, up 14.92%, beside a median listing price of $2,170,000 that fell 8.93%. A local brokerage reports a median sold price of $2,300,000 for August on 25 sales. The highest is 1.5 times the lowest, a ratio this brief computes.
The figures measure different things, and one of the pages says so. The brokerage writes that the median sold price fell from $2,514,500 in July to $2,300,000 in August, a fall of 8.5%, while the price per square foot rose from $905 to $927, and that with only 25 sales the swing reflects what happened to sell. A median over 25 sales moves when two or three large homes close in one month and not another.
Maison Off-Market buys luxury homes and estates directly from their owners and speaks only to sellers. We do not appraise homes, and nothing here is a valuation. This brief sets the published figures side by side, notes where pages disagree, adds a Census cut on the age of the homes and how long owners have stayed, and shows what a percentage of a price is worth in dollars. Every calculation is this brief's own arithmetic and every inference is labeled as one.
Key Findings
- Realtor.com showed for the Studio City neighborhood of Los Angeles, as of August 2026, a median listing price of $2,170,000 (down 8.93% on the year), a median sold price of $2,026,000 (up 14.92%), $790 per square foot, 218 active listings, 50 days on market, a sale-to-list ratio of 100% and a median rent of $4,772 (Realtor.com, Studio City market data).
- Redfin showed a median sale price of $1.94 million for the three months to September 2026, up 38.2%, $821 per square foot, 75 days on market, 36 homes sold, and a compete score of 45 that it labeled somewhat competitive (Redfin, Studio City housing market).
- Zillow showed a typical home value of $1,568,123 as of August 31, 2026, up 3.2% on the year, with homes going to pending in around 40 days (Zillow, Studio City home values).
- A local brokerage's report for the postal area for August showed 84 active listings, 25 homes sold, a median sold price of $2,300,000, a median list price of $2,799,500 on active inventory, 46 average days on market and $927.14 per square foot (Local brokerage blog, Studio City market update, August 2026).
- The Census describes a postal area of 32,469 people where 63.2% of homes were built before 1980, the median year built is 1972, 54.9% of occupied homes are rented and only 8 homes have been built since 2020.
Is Studio City a buyer's market, a seller's market or a balanced one?
The pages give mixed signals. Realtor.com's August page says that homes sold for about the asking price with a sale-to-list ratio of 100% and calls the market warm, with homes selling in a median of 50 days. At the same time it shows 218 active listings, up 10.08% on the year and up 80.69% over three years, and a median listing price down 8.93%. Redfin calls the market somewhat competitive, with a compete score of 45 out of 100, and says homes sell in 75 days. Its figure for homes sold under list price is 1.9%.
The brokerage's report adds the supply view. It shows active listings falling from 100 in July to 84 in August while closings rose from 20 to 25, which moves its months of supply from about 5 to about 3.4. Over the same month, the average days on market rose from 30.2 to 46, up 52%, a figure this brief computes. The brokerage's explanation is that correctly priced homes are still moving and that aging listings drag the average up. That is the brokerage's reading and not a measurement.
The clocks that the pages publish are 40, 46, 50 and 75 days. Zillow's 40 is days to pending, the brokerage's 46 is the average days on market for August closings, Realtor.com's 50 is the median for homes for sale and Redfin's 75 is for homes that sold over three months. These cannot be compared directly, and a seller should not read a clock from one page against a price from another.
The inference from the pages together is that Studio City is neither frantic nor stalled. Supply is higher than it was a year or three years ago on Realtor.com's count, and the brokerage's count fell in a month. The Realtor.com page also contains a small oddity: its median listing price is shown as down 8.93% on the year and down 8.93% on the month, which cannot both be exactly right, and this brief flags it as a likely template error.
| Measure | Value | One-year change | Three-year change |
|---|---|---|---|
| Median listing price | $2,170,000 | -8.93% | -8.09% |
| Median sold price | $2,026,000 | 14.92% | 33.34% |
| Price per square foot | $790 | -6.86% | -9.23% |
| Active listings | 218 | 10.08% | 80.69% |
| Median days on market | 50 | 4.26% | 8.89% |
| Rental properties | 190 | 0% | 34.23% |
| Median rent | $4,772 | -19.12% | -23.03% |
Source: Realtor.com Economic Research, as shown on the page. Commercial content; not independently verified.
Which Studio City price is the real one?
Five published figures run from $1,568,123 to $2,300,000, and one more, the listing medians, runs to $2,799,500. Zillow's $1,568,123 is a typical value across all homes, including condominiums. Redfin's $1,940,000 is a three-month median for homes that sold. Realtor.com's $2,026,000 is for August and its $2,170,000 is an asking median. The brokerage's $2,300,000 is for August in the postal area, and its $2,799,500 is the median asking price of the 84 active listings.
The Redfin median is 4.3% below Realtor.com's sold median, and the brokerage's median is 13.5% above it, ratios this brief computes. Redfin says its median is up 38.2% on the year and Realtor.com says its is up 14.92%. A rise of 38.2% in a neighborhood is not something that happens to every home. It is what a median does when the mix of sales shifts, and Redfin's count of 36 homes sold over three months is small. This is an inference, and the page does not give the count behind the prior year.
The brokerage warns against the comparison that most readers make. It says that the median list price of $2,799,500 and the median sold price of $2,300,000 should not be set side by side, and that the gap of about half a million dollars measures a difference in the mix of homes and not what sellers conceded. The ratio of the two is 0.82. To know what sellers conceded, the page says, compare each sold price with the same home's list price. This brief takes the same care and does not use the gap.
The Census owner value in the postal area is $1,700,300, with a margin of error of $74,249, or 4.4%. It sits between Zillow's typical value and the sold medians: 8.4% above the Zillow figure, 16.1% below the Realtor.com sold median and 26.1% below the brokerage's median, ratios this brief computes. Owners who rent out or own condominiums pull the Census figure down, and large houses pull the sold medians up.
The dollars are large. One percent of $1,940,000 is $19,400, one percent of $2,026,000 is $20,260 and one percent of $2,300,000 is $23,000. A seller who reads the wrong figure for the home's segment can be off by a very large sum.
| Source | Figure | What it measures |
|---|---|---|
| Zillow | $1,568,123 | Typical home value, August 31 |
| Redfin | $1,940,000 | Median sale price, three months to September |
| Realtor.com | $2,026,000 | Median sold price, August |
| Realtor.com | $2,170,000 | Median listing price, August |
| Local brokerage | $2,300,000 | Median sold price, postal area, August, 25 sales |
| Local brokerage | $2,799,500 | Median list price, 84 active listings, August |
Sources as cited. The measures, areas and periods differ and the figures are not directly comparable. Commercial content; not independently verified.
How uneven are the places around Studio City?
The Realtor.com page lists fifteen nearby places with listing medians, and the spread is wide. Beverly Crest shows $5,724,972 and $1,311 per square foot, Outpost $3,990,000 and $1,147, Mount Olympus $3,500,000 and $1,016, Hollywood Hills West $3,395,000 and $1,132, Laurel Canyon $1,725,000 and $995, Sherman Oaks $1,595,000 and $727, Valley Village $1,095,000 and $652, and Mid-Town North Hollywood $905,188 and $565. Nichols Canyon shows $849,000 and Noho Arts District $709,000. The highest listing median is 8.1 times the lowest, and the highest price per square foot is 2.3 times the lowest, ratios this brief computes.
These are neighbors and not parts of Studio City, and the page shows them because its table covers the area around the neighborhood. The page's own list of nearby neighborhoods includes Valley Village, Greater Toluca Lake, Mount Olympus and Laurel Canyon. A seller in Studio City should not read the hills' figures as a description of a home on the flats, and this brief does not use them to value any home.
The brokerage makes the same point about the postal area. It says that a condominium on Ventura Boulevard, a home in the flats and a hillside property off the canyon draw different buyers at different price bands on different timelines, and that a median across the postal area blends all three and describes none. That is the brokerage's statement.
The counts and clocks differ among the neighbors too. The page shows 336 homes for sale in Sherman Oaks and 304 in Hollywood Hills West, against 218 for Studio City as a whole, and median days on market of 29 in Magnolia Park, 45 in Noho Arts District, 48 in Valley Village and 51 in Sherman Oaks. Sherman Oaks has 1.5 times as many homes for sale as Studio City, a ratio this brief computes, and the listing medians in the table are the asking prices of very different mixes of homes.
Source: Realtor.com and the brokerage report, as cited above. Ratios are this brief's arithmetic. Commercial content; not independently verified.
How many homes sell, and how long do they take?
The sales counts are small. Redfin counts 36 homes sold in the three months to September, which is about 12 a month. The brokerage counts 25 closings in August and 20 in July for the postal area. A neighborhood that records 12 to 25 sales a month produces medians that swing, and the brokerage says as much: two or three large closings move the median considerably.
The supply counts differ by provider. Realtor.com shows 218 active listings for the neighborhood in August, up 11.02% on the month. The brokerage shows 84 active listings for the postal area, down from 100 in July. Both can be right because the boundaries differ, but the ratio of Realtor.com's count to the brokerage's is 2.6, a figure this brief computes, and a reader cannot tell which is the better view of what a buyer can actually choose from.
Realtor.com's rental figures move the other way. It shows 190 rental properties, flat on the year, and a median rent of $4,772, down 19.12% on the year and down 23.03% over three years. A fall of that size in a median rent may reflect a change in the mix of rentals and not a fall in the rent of any unit, though the page does not say.
The sale-to-list ratio gives a sense of negotiation. Realtor.com's 100% means that the median sale was about at the asking price. Redfin shows that 1.9% of homes sold under list price, although the label is unclear on its page. This brief does not rely on that figure. On a $2,026,000 sale each 1% of price is $20,260.
The price per square foot adds a check on the medians. Realtor.com shows $790 for the neighborhood, down 6.86% on the year, Redfin shows $821, up 24.8%, and the brokerage shows $927.14 for the postal area. The highest of the three is 1.17 times the lowest, a ratio this brief computes, which is a much narrower range than the price medians show. A per-foot figure removes some of the effect of home size, so the narrower range supports the idea that the medians differ largely because of the mix of homes that sold. This is an inference, and it does not mean that any one home is worth a per-foot figure times its size.
| Source | Figure | What it measures |
|---|---|---|
| Zillow | 40 days | Around the time to pending, August 31 |
| Local brokerage | 46 days | Average days on market, postal area, August |
| Realtor.com | 50 days | Median days on market, August |
| Redfin | 75 days | Days on market, three months to September |
| Realtor.com | 218 | Active listings, neighborhood, August |
| Local brokerage | 84 | Active listings, postal area, August |
| Local brokerage | 25 | Homes sold, postal area, August |
Sources as cited. Commercial content; not independently verified.
What does the Census say about the homes and the households?
The Census describes a postal area of 32,469 people and 16,129 homes with a median household income of $141,875 and a median rent of $2,535. Of the homes, 10,201 (63.2%) were built before 1980, and the median year built is 1972. By decade, 1,420 homes (8.8%) date from 1939 or earlier, 1,506 (9.3%) from the 1940s, 2,133 (13.2%) from the 1950s, 2,556 (15.8%) from the 1960s, 2,586 (16.0%) from the 1970s and 1,990 (12.3%) from the 1980s. Newer homes are fewer: 1,326 (8.2%) from the 1990s, 1,575 (9.8%) from the 2000s, 1,029 (6.4%) from the 2010s and only 8 since 2020. Homes built from 1960 to 1989 number 7,132, or 44.2%.
The stock matters because most of it is old enough that a buyer expects to inspect it. A house from the 1950s or 1960s raises questions about the roof, the plumbing, the electrical panel and the foundation, and a buyer on the open market usually brings an inspector. This is an inference about how buyers behave.
Studio City is also a place of renters. Of 15,365 occupied homes, 8,443 (54.9%) are rented and 6,922 (45.1%) are owner-occupied, and 764 homes (4.7%) are vacant. The vacant homes include 164 for rent, 97 for sale only, 77 held for seasonal or occasional use, 32 rented but not occupied, 31 sold but not occupied and 363 in other categories. The 363 in other categories are 2.3% of all homes, and the Census does not say what they are.
The Census also asks when owners moved in. Of the 6,922 owners, 2,295 (33.2%) moved in in the 2010s, 1,427 (20.6%) in the 2000s, 1,120 (16.2%) in the 1990s, 987 (14.3%) in 1989 or earlier, 945 (13.7%) in 2020 to 2022 and 148 (2.1%) in 2023 or later. Owners who moved in before 2000 number 2,107, or 30.4%, and many bought long before the rise in prices. Owners who moved in since 2020 number 1,093, or 15.8%.
The Census median owner-occupied value is $1,700,300. For renters, the figures show that 3,399 of the 8,443 renter households (40.3%) moved in in 2020 or later, so the rental side turns over quickly. Owners, who hold the homes that come to market, turn over slowly, and their decision about whether and when to sell has no deadline from the market. Readers comparing markets can also read the Brentwood, Los Angeles brief and the Menlo Park brief.
Source: Census Reporter, American Community Survey 2020-2024 five-year estimates, tables B25034, B25038, B25004, B25077, B25003, B25002 and B19013. Percentages and ratios are this brief's arithmetic.
What should an owner ask, and what does a private sale change?
Ask which Studio City a figure covers: the neighborhood, the postal area or the hills nearby. Ask which period and how many sales are behind it. Ask whether a price is a listing price, a sold price or an estimate. A seller who has the answers can read a page, and a seller who does not will find that four pages give four prices from $1.57 million to $2.3 million.
A private sale changes how a home reaches a buyer. With Maison Off-Market there are no showings and no neighbors talking about a sale, the closing date can be flexible so that an owner has time to find a new home, there are no commission costs, there are no closing costs and there are no inspections or repairs. For an owner of a 1950s or 1960s house, the last point matters, because an older home is where an inspection list tends to grow. This brief does not claim that a private sale always brings a higher price than a public listing.
Fee arithmetic shows what the commission point means in dollars, without assuming any rate. Each 1% of a sale price is $19,400 at $1,940,000, $20,260 at $2,026,000 and $23,000 at $2,300,000. At 3% those amounts are $58,200, $60,780 and $69,000. At 5% they are $97,000, $101,300 and $115,000. These are illustrations of what a percentage means on the figures in this brief, and they are not a statement of what any agent charges or what any sale would cost.
Timing is the other thing an owner controls. A public listing starts a clock, and the pages above show 40 to 75 days. A private sale lets the owner choose the closing date, which matters most to people who need to find the next home first or who want to close after a school year.
Privacy is often the first thing owners raise. A public listing puts photographs, a price and every price change in front of anyone, and Realtor.com shows that the median listing price fell 8.93% on the year, a fact neighbors can read. A private sale keeps those details out of view. That is a matter of preference and not a claim about price.
If you are weighing a sale of a Studio City home, one conversation costs nothing and obliges you to nothing. We ask about the home, the timing you would like and what you would need from a buyer, and we say plainly whether a private sale fits.
If you would like a private, no-obligation offer for a Studio City home, call 401-219-4207 or use the contact form on this site.
Methodology and limitations
Prices, days on market, counts and ratios come from a Realtor.com page with indicators as of August 2026, a Redfin page showing the three months to September 2026, a Zillow page updated August 31, 2026 and a brokerage report dated September 6, 2026 that cites a regional multiple-listing service. The pages cover different places and periods and are commercial, so they are not independent of each other. The Realtor.com page shows identical year-over-year and month-over-month changes for its listing median, and its neighborhood table covers places around Studio City; Redfin's label for its under-list figure is unclear. All are flagged above. The Census figures are five-year estimates for a postal area.
Conclusion
The Studio City record shows a typical value of $1,568,123, sold medians of $1,940,000, $2,026,000 and $2,300,000, clocks from 40 to 75 days, a handful of sales a month and a stock where 63.2% of homes predate 1980 and 54.9% of households rent. The pages differ because they measure different things in different windows, and because a median over 25 sales moves with the mix.
Frequently Asked Questions
What is the median home price in Studio City?
Pages differ. Realtor.com showed a median sold price of $2,026,000 for August 2026, Redfin showed $1,940,000 for three months to September, a brokerage showed $2,300,000 on 25 sales, and Zillow shows a typical value of $1,568,123.
Is Studio City a buyer's market?
Realtor.com shows a sale-to-list ratio of 100% and calls the market warm, with 218 active listings up 10.08% on the year. Redfin calls it somewhat competitive, with a compete score of 45.
How long do homes take to sell in Studio City?
Zillow shows around 40 days to pending, a brokerage shows 46 days on average, Realtor.com shows 50 days and Redfin shows 75 days.
How much is 1% of a Studio City home price?
It is $19,400 at $1,940,000 and $23,000 at $2,300,000. At 3% those amounts are $58,200 and $69,000. This is arithmetic and not an agent's rate.
Can I sell my Studio City home privately?
Yes. Maison Off-Market buys luxury homes and estates directly from their owners with no showings, flexible closing dates, no commission costs, no closing costs and no inspections or repairs. Call 401-219-4207 or use the contact form.
Compare your options before committing. Request a written private offer for your property, with no obligation, then weigh it against your listing plan.
Sources
- Realtor.com, 2026. Studio City Neighborhood of Los Angeles, CA Housing Market. https://www.realtor.com/local/market/california/los-angeles/studio-city.
- Redfin, 2026. Studio City, CA Housing Market. https://www.redfin.com/neighborhood/2629/CA/Los-Angeles/Studio-City/housing-market.
- Zillow, 2026. Studio City, CA Home Values. https://www.zillow.com/home-values/47880/studio-city-los-angeles-ca/.
- Local brokerage blog, 2026. Studio City Market Update, August 2026. https://alberto.jhagents.com/blog/2026/09/06/91604-market-update-august-2026-inventory-tightened-the-median-fell-and-both-are-true.
Related research

Seller Guide · October 6, 2026
How to Prepare Point Pleasant Beach Rental Records Before Selling
Separate rental approval, income history and booked stays before comparing sale terms.

Seller Guide · October 6, 2026
How to Prepare Rumson Flood and Waterfront Records Before Selling
Separate flood disclosure, elevation, repairs and waterfront rights before comparing sale terms.

Seller Guide · October 6, 2026
How to Prepare Sarasota Condo Inspection and Reserve Records Before Selling
Separate building condition, reserve funding and resale documents before comparing sale terms.