Market Brief · by Aidan Sowa · October 5, 2026
Why Do Crescent Lake Listings and Sales Sit Far Apart? Reading a Listing Median on a Few Homes and a Sale Median
Reading a Listing Median on a Few Homes and a Sale Median for Crescent Lake, FL, with each source dated and its limits noted, for owners weighing a listing against a direct sale.
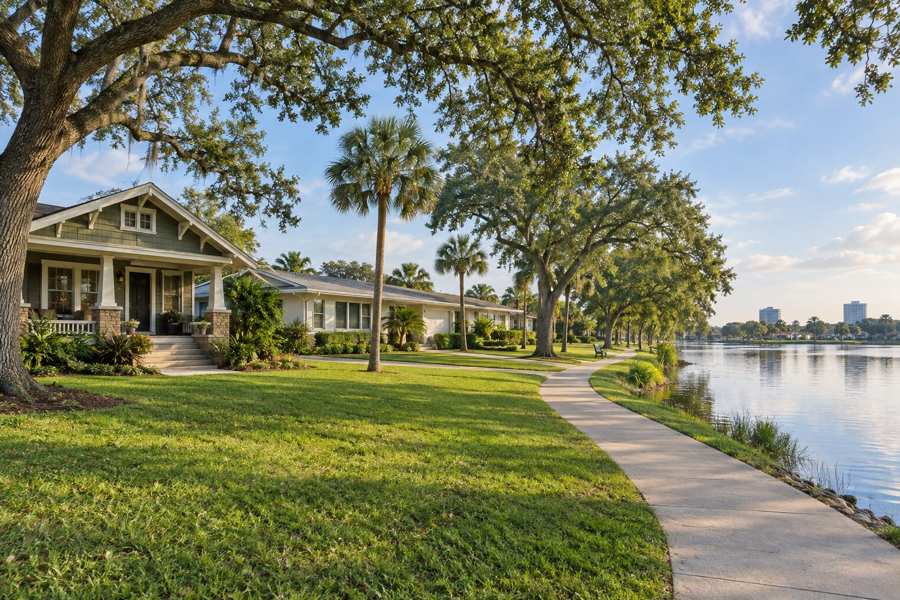
Crescent Lake is the St. Petersburg neighborhood built around a 42-acre park with a freshwater lake, and what its homes are worth depends on whether the number is an ask or a sale. A Realtor.com neighborhood table for June 2026 shows a median listing price of $1,274,500 and just 5 homes for sale. Redfin shows a median sale price of $787,500 for March, down 29.5%. A local brokerage guide says the April 2026 MLS median sold price was $655,000 on a small sample.
The asking median is 94.6% above the MLS sale median, which is $619,500 higher, and 61.8% above Redfin's. Asking prices that run at nearly twice the sale prices are not a normal discount. They are a sign that the few homes listed are of a different kind from the homes that sell, or that sellers' hopes have moved away from the buyers' prices.
This brief reads the three figures together with the Census profile of the postal area that includes Crescent Lake and a Realtor.com series for the Tampa area. It asks why asks and sales differ so much, what a count of five listings means, and how the age of the housing bears on a sale. It then sets out what a private sale changes for an owner.
Key Findings
- A Realtor.com neighborhood comparison table, with indicators as of June 2026, gave Crescent Lake a median listing price of $1,274,500, $517 per square foot of listing price, a median rent of $2,200 a month, 5 homes for sale (up 33.33%) and a median of 48 days on market (down 5.88% on the year) (Realtor.com, Bell Place page with neighborhood table).
- Redfin reported a Crescent Lake median sale price of $787,500 for March 2026 (down 29.5%) and $642 per square foot (up 64.2%) (Redfin, Crescent Lake).
- A local brokerage guide dated May 25, 2026 said the April 2026 MLS median sold price in Crescent Lake was $655,000 "based on a small transaction sample" and listed typical homes from $375,000 to more than $800,000 (Living St. Petersburg, Crescent Lake guide).
- In the Census postal area, 2,645 of 8,879 housing units (29.8%) were built in the 1950s or 1960s, 6,986 (78.7%) before 1980 and owners occupy 5,120 of 7,756 occupied homes (66.0%) (U.S. Census Bureau, 2020-2024).
- In the Tampa-St. Petersburg-Clearwater area the median days on market rose from 67 in May 2026 to 76 in September (Realtor.com, days on market).
Why are asking prices twice the sale prices?
Start with the count. Five homes for sale is a very small group, and a median of five listings is the price of the middle one. If two of the five are large, renovated houses beside the park, listed at well over $1 million, the median goes to the high end whatever the other three are. The guide's own table of budgets gives the typical range as $375,000 to more than $800,000, and a median listing of $1,274,500 sits far above it.
Then the kind of home. The homes that stay on the market long enough to be counted in a snapshot are often the highest priced, since cheaper homes sell quickly and leave the count. A snapshot of listings therefore tilts toward the expensive end, while a list of sales holds everything that closed, the cheap and the dear.
Then the period. Redfin's figure is for March, the MLS figure is for April and the listing table is for June. Prices of homes listed in June are not prices of homes that sold in March or April.
Last, sentiment. A seller who has watched a neighbor's house near the park sell for a high price may list at a similar figure, whatever the house. The market then tests the figure, and the homes that do not sell stay in the count. The gap between $1,274,500 and $655,000 is, in part, the gap between hope and result.
| Source | Figure | Period |
|---|---|---|
| Realtor.com neighborhood table | $1,274,500 median listing price (5 homes for sale) | June 2026 |
| Redfin | $787,500 median sale price (down 29.5%) | March 2026 |
| Local brokerage guide | $655,000 median sold price (small sample) | April 2026 |
| Local brokerage guide | Typical homes $375,000 to more than $800,000 | May 2026 |
Sources: Realtor.com, Redfin and Living St. Petersburg pages as cited. The 94.6%, $619,500 and 61.8% figures are this brief's arithmetic. The reasoning about listings is this brief's and not a finding. Commercial content; not independently verified.
Is the price per square foot $517, $642 or something else?
The Realtor.com figure of $517 is a price per square foot of the listing. Redfin's $642 is for sales, and it is up 64.2%, which would put it near $391 a year earlier. A price per foot that rose by two thirds while the median price fell by 29.5% is a sign that the homes that sold in March were much smaller than those that sold a year earlier, or that the sample was small. A $787,500 median at $642 a foot implies a typical home of about 1,230 square feet, while the earlier $1,117,000 at $391 would imply about 2,860.
These are inferences from the pages' own figures and not measured sizes. They show how a median price and a median price per foot can move in opposite directions: the mix of homes changed, and the sample is too small to hold the mix steady.
The same applies to the listing figure. At $517 a foot and $1,274,500 a median listing implies homes of about 2,470 square feet. That is a larger home than the one implied by the March sales. The listings are, on these figures, bigger houses than the ones that sold.
A seller whose house is 1,400 square feet should not compare it with a figure from a mix that is dominated by 2,500 square foot houses, and the reverse is also true. The comparison that counts is size for size.
It is worth noting where the three figures fall against the guide's tiers. The two sale medians, $655,000 and $787,500, sit inside its range from $375,000 to $800,000, and the listing median sits far above it. If the tiers are fair, a typical house sells in the middle of the range, and a seller who expects the listing median is expecting to land at the very top of it, and then some, which few homes do.
Sources: Redfin and Realtor.com pages as cited. The $391, $1,117,000 and implied sizes of about 1,230, 2,860 and 2,470 square feet are this brief's arithmetic from the published figures and are inferences, not measurements. Commercial content; not independently verified.
How should a seller read a single neighborhood table?
The Realtor.com figures for Crescent Lake come from a comparison table on the page for a neighboring area, Bell Place, which lists several nearby neighborhoods in rows. A table of this kind is a convenience, and it is easy to lose its context. It shows a median listing price, a count of homes for sale, a median wait and a rent for each neighborhood, with the changes. It does not say how many sales stand behind the numbers, and it does not give the sale price.
In the same table, other neighborhoods have 24, 22 and 10 homes for sale, so Crescent Lake's 5 is among the smallest counts. A median of 5 is the least stable of the group. The table's other rows show median listing prices from $857,000 to $877,450, and Crescent Lake's $1,274,500 stands apart from them by about 45%. A figure that stands apart in a small sample is more likely to reflect a few large listings than a difference in the neighborhood.
The date matters as well. The page says indicators as of June 2026. Four months later, the five listings may have sold or been cut or replaced, and the median may have moved by hundreds of thousands of dollars. A seller who reads the table in October is reading what the neighborhood looked like in June.
The sensible use of a table like this is as a pointer to which questions to ask. How many homes are for sale now? How many sold in the last six months? What did the three most similar homes sell for? Those answers are not on the page, and they are the ones that decide a price.
Source: Realtor.com page as cited. The 45% figure is this brief's arithmetic ($1,274,500 against about $877,450). The reasoning about tables is this brief's and not a finding. Commercial content; not independently verified.
What does the Census say about mid-century homes here?
The Census profile covers the postal area that includes Crescent Lake and Old Northeast. It counts 16,232 people and 8,879 housing units, of which 7,756 are occupied and 1,123 are vacant, a vacancy rate of 12.6%. Owners live in 5,120 homes (66.0%) and renters in 2,636 (34.0%). Median household income is $107,889 and median gross rent is $1,495 a month.
The mid-century stock is large. There are 1,708 homes (19.2%) from the 1950s and 937 (10.6%) from the 1960s, together 2,645 or 29.8%. Add the 1,199 (13.5%) from the 1940s and the 722 (8.1%) from the 1970s and the total from the 1940s to the 1970s is 4,566, or 51.4%. The guide says that Crescent Lake mixes bungalows, mid-century ranches and newer infill, and the Census age profile is consistent with that.
Owners estimate the median home at $753,600, with a margin of error of $61,467, or 8.2%. That is 15% above the $655,000 MLS median and 4% below Redfin's $787,500. It is also 7.0 times the median household income. The postal area also covers Old Northeast, whose homes sell for more, so the figure is for the whole area.
A mid-century ranch has particular points. Its roof is probably not original, its windows may be single pane or have been replaced, its plumbing may be of materials of the period and its air conditioning, in Florida, has probably been replaced more than once. The sources here do not give condition data for the neighborhood and I do not estimate costs.
| Indicator | Value | Note |
|---|---|---|
| Population | 16,232 | Whole postal area |
| Housing units | 8,879 | All units |
| Built in the 1950s or 1960s | 2,645 | 29.8% of all units |
| Built from 1940 to 1979 | 4,566 | 51.4% of all units |
| Median household income | $107,889 | Estimate |
| Median gross rent | $1,495 | Per month |
| Owner-estimated median value | $753,600 | Margin of error $61,467 |
| Median year built | 1955 | Estimate |
Source: U.S. Census Bureau, American Community Survey 2020-2024 five-year estimates. The 4,566, 51.4%, 15%, 4% and 7.0 figures are this brief's arithmetic.
What does a 48-day wait mean when five homes are for sale?
The table reports a median of 48 days on market for Crescent Lake, down 17.24% on the month and 5.88% on the year, which puts the figure a year ago near 51 days. With five homes for sale, the median is the wait of the third. A wait of 48 days is about seven weeks.
The wait is shorter than the Tampa area's. The Realtor.com series for the region shows 67 days in May, 68 in June, 72 in July, 74 in August and 76 in September, a rise of 13%. A neighborhood with 48 days and a region with 68 in June is a neighborhood that sells faster than the region, though on five homes the figure moves with each listing.
The count of five is up 33.33% on the year, so a year earlier there were about four. A neighborhood with four or five homes for sale at a time is a neighborhood where a seller is rarely competing with many others, and a buyer has few choices. That helps a seller in one way, since a buyer who wants this neighborhood has to take what is on offer, and hurts in another, since few buyers are watching.
The region's new listings fell from 6,200 in May to 5,534 in July (Realtor.com, new listings). That too is a sign of sellers holding back.
Sources: Realtor.com table and series on FRED as cited. The 51-day, 13% and four-listing figures are this brief's arithmetic from the published changes. Commercial content; not independently verified.
What does a park premium do to a sale?
The local guide says that homes on streets next to Crescent Lake Park command a meaningful premium over comparable homes further away, that larger lots on quieter streets command premiums and that the difference between a dated home and a well renovated one is often $100,000 or more. These are the guide's statements, from a brokerage that sells homes there, and I have not checked them against recorded sales.
If they hold, a median across the whole neighborhood blends homes with and without the premium, and a seller's own home may sit at either end. A house across the street from the park might sell for far more than the $655,000 median. A house six blocks away that has not been updated might sell for less.
The guide's own tiers make the same point. It lists homes from $375,000 to $500,000 for an updated or well maintained bungalow or ranch, up to $800,000 and more for exceptional custom or renovated properties on the best streets. A spread from $375,000 to over $800,000 is more than a factor of two within a single neighborhood.
For an owner, the question is where the house sits in that spread and what it would cost to move up. Renovation costs money and time, and the guide's $100,000 figure is a reason to compare. A seller who spends on a kitchen before listing hopes the premium will exceed the cost. A seller who does not spend takes the discount as the price of speed.
A private buyer who takes the house as it is has already priced that discount. The seller does not renovate, does not stage and does not wait, and the buyer carries the work.
Source: Living St. Petersburg guide as cited. The figures are the guide's, from a brokerage, and not independently verified. The reasoning about owners is this brief's.
What does a median rent of $2,200 say about the price?
The Realtor.com table puts the median rent in Crescent Lake at $2,200 a month, from 4 rental properties. A year of that rent is $26,400. Against the MLS median of $655,000 that is 4.0% a year and against the median listing price of $1,274,500 it is 2.1%. The Census median rent for the postal area is $1,495, so the table's figure is 47% higher, as it describes homes listed for rent.
The gap between 4.0% and 2.1% shows how the choice of price matters. An owner who rents at $2,200 earns twice as much against the sale price as against the asking price, and the sale price is the one that a buyer will actually pay. An owner who values the home at the ask would conclude that renting is a poor use, while one who values it at the sale price would see a better return.
These are gross figures before taxes, insurance, repairs, vacancy and management, and the sources here do not give those costs for St. Petersburg. I make no estimate.
An owner who has inherited a house here, or who has a rental that has become a burden, should compare the net from renting for a few years with the net from selling now, with real quotes for the repairs a mid-century house may need. A private offer is one of the figures for that comparison. Readers comparing markets can also read the Old Northeast brief and the Inlet Beach brief.
Sources: Realtor.com table and U.S. Census Bureau as cited. The $26,400, 4.0%, 2.1% and 47% figures are this brief's arithmetic. Commercial content; not independently verified.
What does a private sale change when asks and sales are far apart?
A seller who lists at $1.2 million into a market where the median sale is $655,000 is likely to wait and to cut. A private sale starts from the other end. A buyer who looks at the house sets a price, and the seller accepts or refuses. There is no ask to defend.
Privacy is the first change, with no showings and no talk among neighbors about the sale, which in a neighborhood built around a park is a real consideration. A flexible closing date is the second. No commission and no closing costs are the third and fourth. On a home at $655,000, each 1% is $6,550, and I do not state a rate because no source here gives one. Avoiding inspections and repairs is the fifth, and in a postal area where 51.4% of homes were built between 1940 and 1979, it carries weight.
A public listing may still produce a better price for a renovated house on a street beside the park, where the guide says buyers pay a premium. The pages above do not rule that out. They show that asks and sales differ by a factor of two, that the sample is a handful of homes and that a seller who plans around the ask may wait a long time.
Owners near a park often have a particular attachment to a house, and a sale may be a family decision as much as a financial one. If that is so, it helps to decide early what matters most: the highest price a lucky buyer might pay, or a quiet sale on a date that suits the family. The figures above say the first is uncertain, with asks and sales a factor of two apart, and that the second can be arranged by agreement. An owner who writes down a minimum acceptable net amount before talking to any buyer is in a stronger position than one who reacts to the first number offered.
Ask each buyer for the offer in writing, with the price, the closing date, who pays each charge and every condition. Ask for proof that the buyer can close. And ask which homes the buyer has bought or sold nearby, since a buyer who knows the streets is a better guide to value than any page.
In short, set the price you need, ask for terms in writing and compare every offer on what you keep.
Sources: Living St. Petersburg, Realtor.com and U.S. Census Bureau as cited. The $6,550 figure is this brief's arithmetic for 1% of $655,000. The reasoning about owners is this brief's and not a measured finding.
Methodology and limitations
Prices, price per square foot, days on market, listing counts and rents for Crescent Lake come from three commercial pages: a national listing site's neighborhood comparison table for June 2026, a national brokerage page for March 2026 and a local brokerage guide dated May 2026. They cover different periods and were not independently verified.
Age, tenure, vacancy, income, rent and owner-estimated value come from the American Community Survey 2020-2024 five-year estimates for the postal-code area that includes Crescent Lake, which is larger than the neighborhood. Shares are calculated from published counts, and owner-estimated value carries a margin of error.
Days on market and new listings are Realtor.com series published by the Federal Reserve Bank of St. Louis for the Tampa-St. Petersburg-Clearwater metropolitan area. They describe the region and not the neighborhood. The brief makes no forecast and values no home.
Conclusion
The Crescent Lake record shows a listing median of $1,274,500 on five homes, sale medians of $787,500 and $655,000, a wait of 48 days and a postal area in which 51.4% of homes date from 1940 to 1979.
It does not fix a price for any one home. The choice between a public listing and a private sale comes down to whether an owner would rather test a high ask or take privacy, a flexible closing date, no commission, no closing costs and no inspections or repairs. To see what a direct offer would look like for your home, use the contact form on this page.
Frequently Asked Questions
What is the median home price in Crescent Lake, St. Petersburg?
Redfin reports $787,500 for March 2026 and a local review $655,000 for April on a small sample. Realtor.com shows a median listing price of $1,274,500 for June.
Why are listing and sale prices so far apart?
The listing figure rests on five homes and tilts toward the expensive end, while sales include every home that closed.
How long do Crescent Lake homes take to sell?
Realtor.com reports a median of 48 days on market for June 2026.
Does the Tampa data describe Crescent Lake?
No. It covers a large metropolitan area and shows direction only.
Does a private sale always beat a public listing?
No. A public listing can attract competing bids. A private sale offers privacy, a flexible closing date, no commission, no closing costs and no inspections or repairs.
Compare your options before committing. Request a written private offer for your property, with no obligation, then weigh it against your listing plan.
Sources
- Realtor.com, 2026. Bell Place Neighborhood of St. Petersburg, FL Housing Market (neighborhood comparison table). https://www.realtor.com/local/market/florida/st-petersburg/bell-place.
- Redfin, 2026. Crescent Lake, St. Petersburg Housing Market. https://www.redfin.com/neighborhood/68361/FL/St-Petersburg/Crescent-Lake/housing-market.
- Living St. Petersburg, 2026. Crescent Lake St. Petersburg, FL: Complete Neighborhood Guide 2026. https://livingstpetersburgfl.com/crescent-lake-st-petersburg-fl-complete-neighborhood-guide-2026/.
- U.S. Census Bureau, 2026. American Community Survey 2020-2024 five-year estimates, the Crescent Lake area (via Census Reporter). https://censusreporter.org/profiles/86000US33704-33704/.
- Realtor.com, 2026. Housing Inventory: Median Days on Market in Tampa-St. Petersburg-Clearwater, FL (CBSA). https://fred.stlouisfed.org/series/MEDDAYONMAR45300.
- Realtor.com, 2026. Housing Inventory: New Listing Count in Tampa-St. Petersburg-Clearwater, FL (CBSA). https://fred.stlouisfed.org/series/NEWLISCOU45300.
Related research

Seller Guide · October 6, 2026
How to Prepare Point Pleasant Beach Rental Records Before Selling
Separate rental approval, income history and booked stays before comparing sale terms.

Seller Guide · October 6, 2026
How to Prepare Rumson Flood and Waterfront Records Before Selling
Separate flood disclosure, elevation, repairs and waterfront rights before comparing sale terms.

Seller Guide · October 6, 2026
How to Prepare Sarasota Condo Inspection and Reserve Records Before Selling
Separate building condition, reserve funding and resale documents before comparing sale terms.